XLU, the Utilities Select Sector SPDR Fund ETF has advanced +14.84% this past year, having gained +19.62% since it’s 52-week low in July of 2024, while sitting -2.78% below it’s 52-week high set in June of 2025 (all figures ex-distributions).
Much of their success has been due to the realization that the AI & data center boom is going to require a lot more energy than we currently produce, which is great for utility companies’ outlooks.
Some of their top holdings include NextEra Energy Inc. (NEE), The Southern Co. (SO), Constellation Energy (CEG), Duke Energy Corp. (DUK), Vistra Corp. (VST), American Electric Power (AEP), Sempra (SRE), Dominion Energy Inc. (D), Exelon Corp. (EXC) & Public Services Enterprise (PEG).
Given that the S&P 500 & NASDAQ are within striking distance of their all-time highs & the Russell 2000 has just poked its head out above the 200 day moving average (long-term trend line), it is worth taking a look at how XLU has performed historically, as in the event of a broader market pullback some market participants may use XLU as a temporary flight to safety.
Below is a brief technical analysis of XLU’s recent performance, along with an analysis of their volume sentiment at each price level they’ve traded at over the past ~4 years.
It is not financial advice, but rather an additional tool to reference while performing your own due diligence on XLU, as it shows how market participants have behaved previously at each price level.
This can be particularly useful when analyzing the strength/weakness of support/resistance levels.
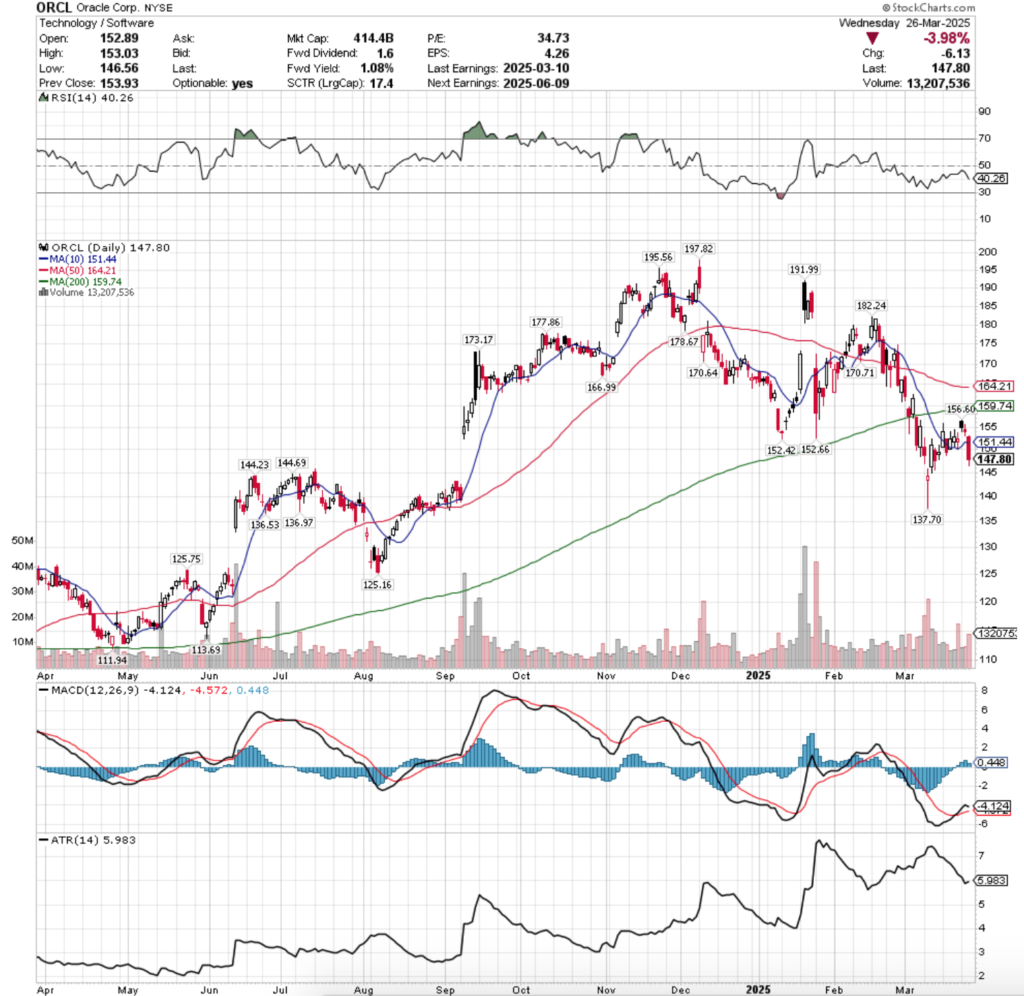
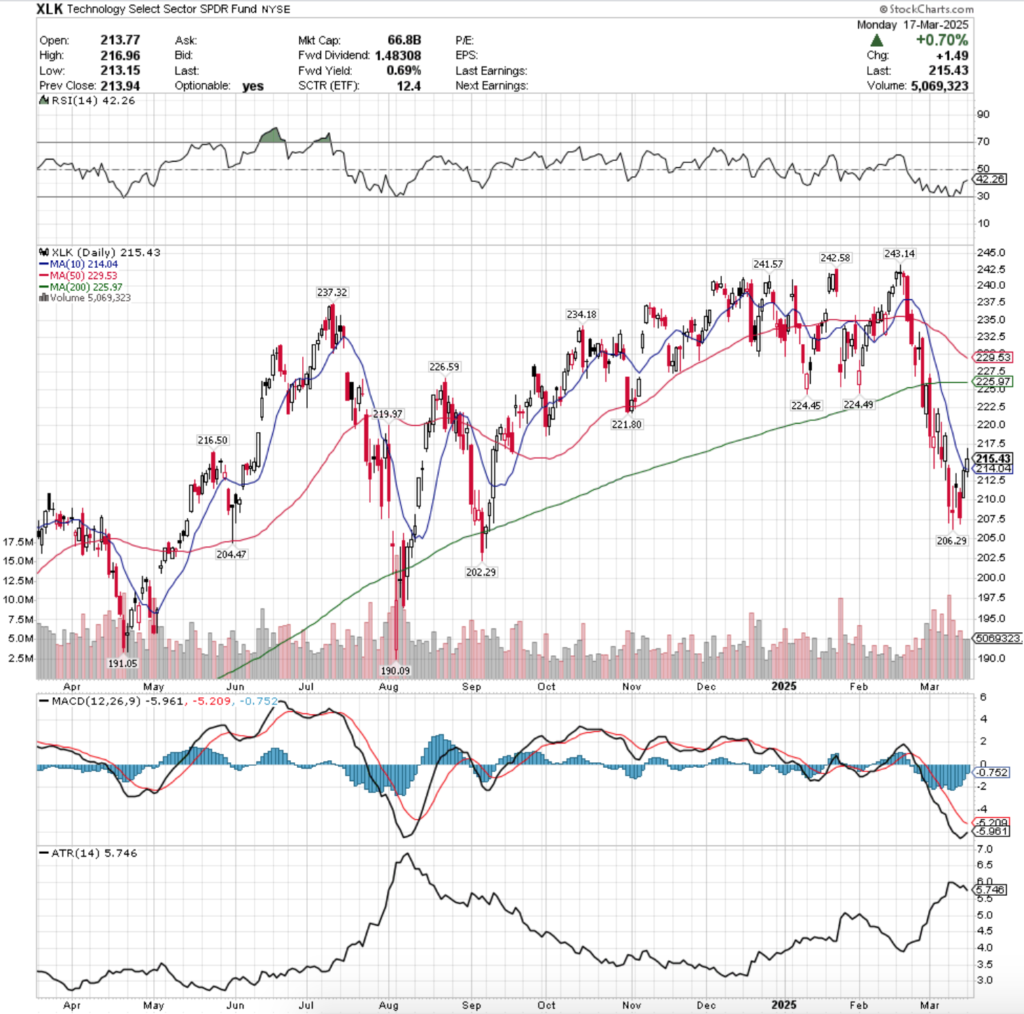
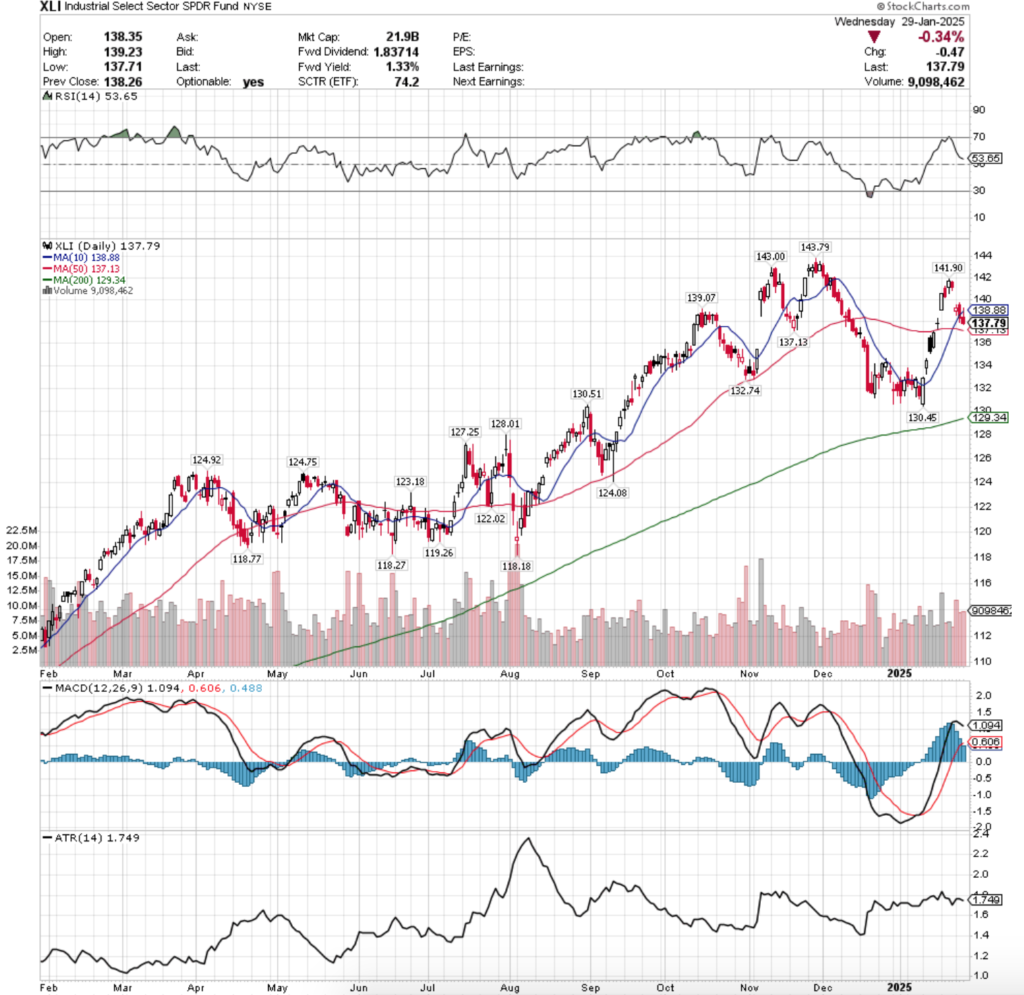
Technical Analysis Of XLU, The Utilities Select Sector SPDR Fund ETF
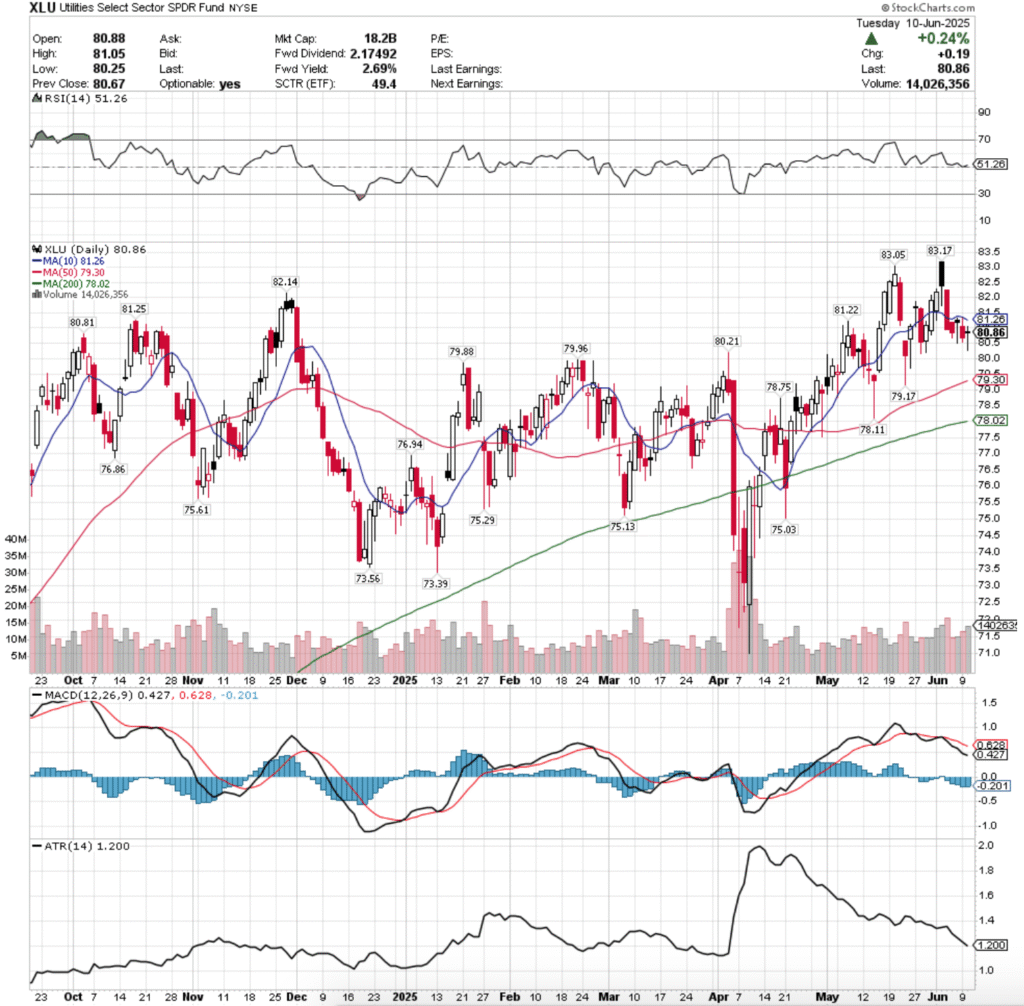
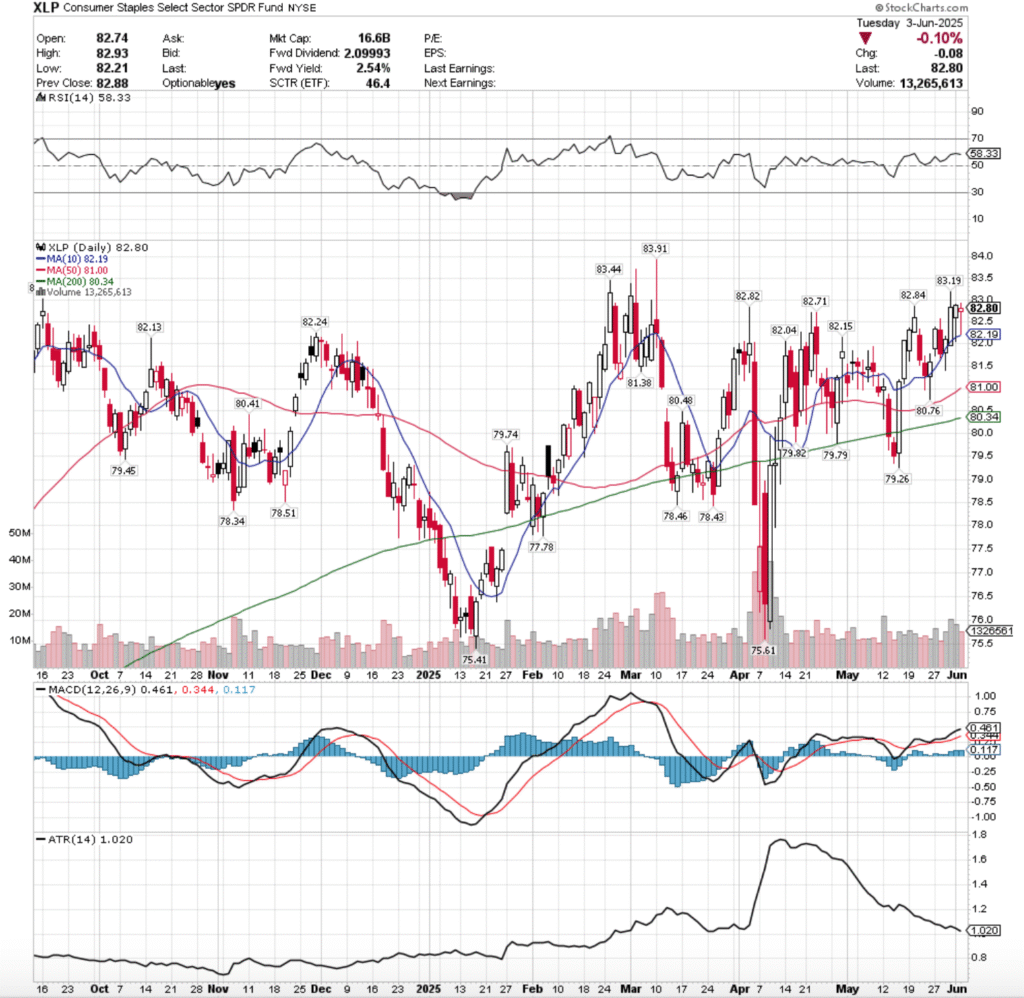
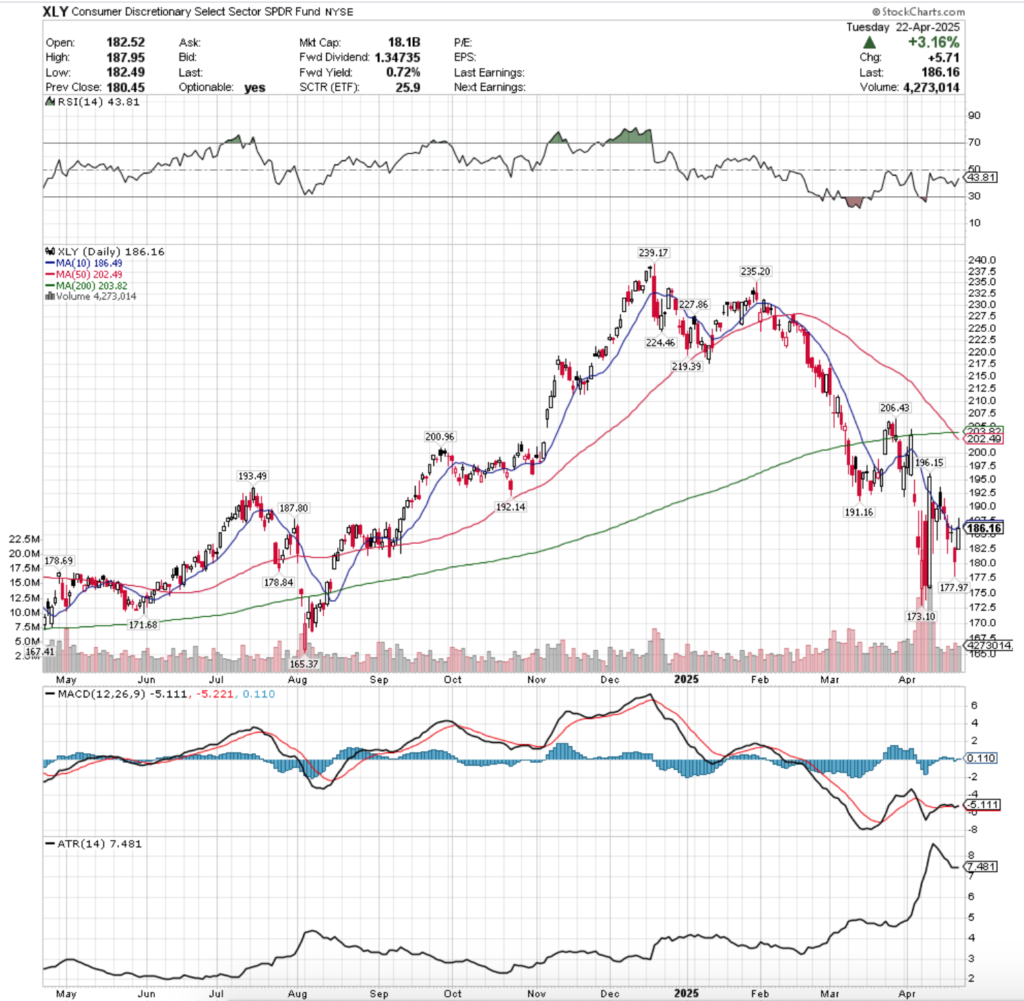
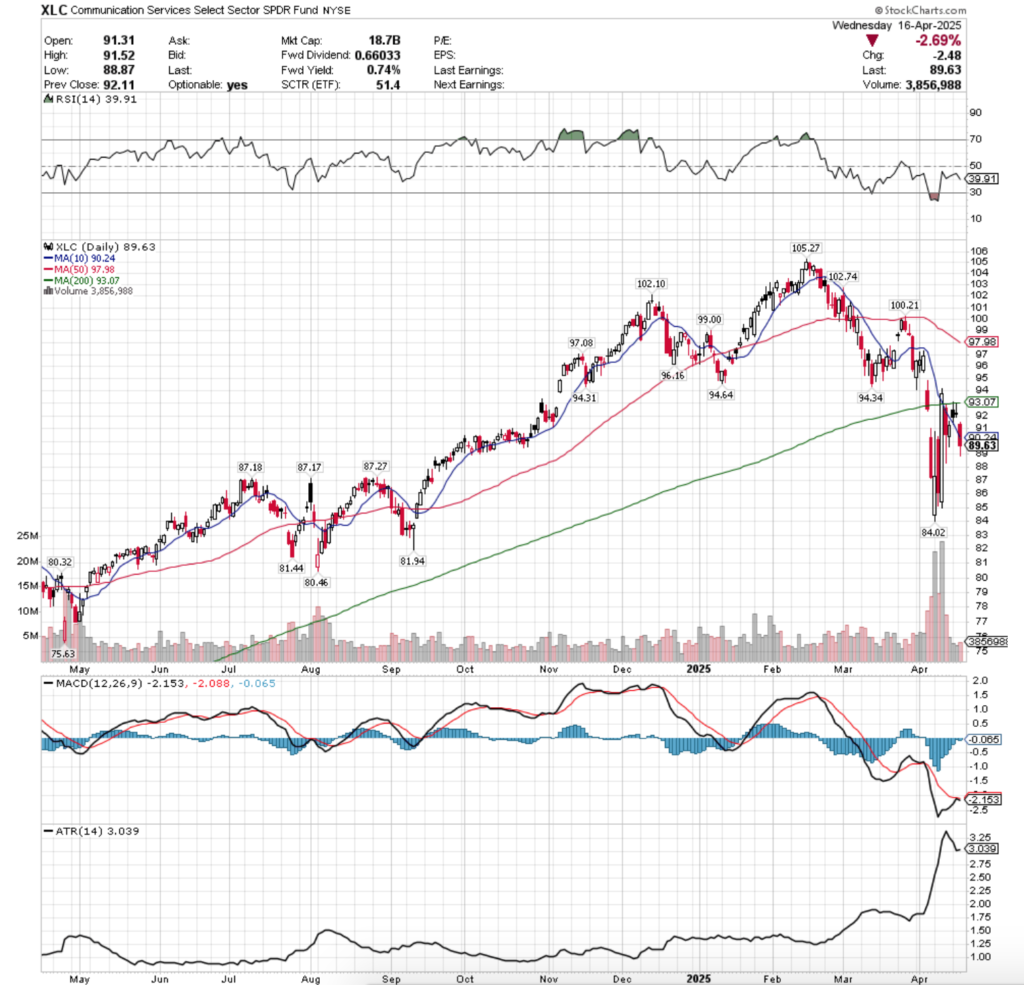
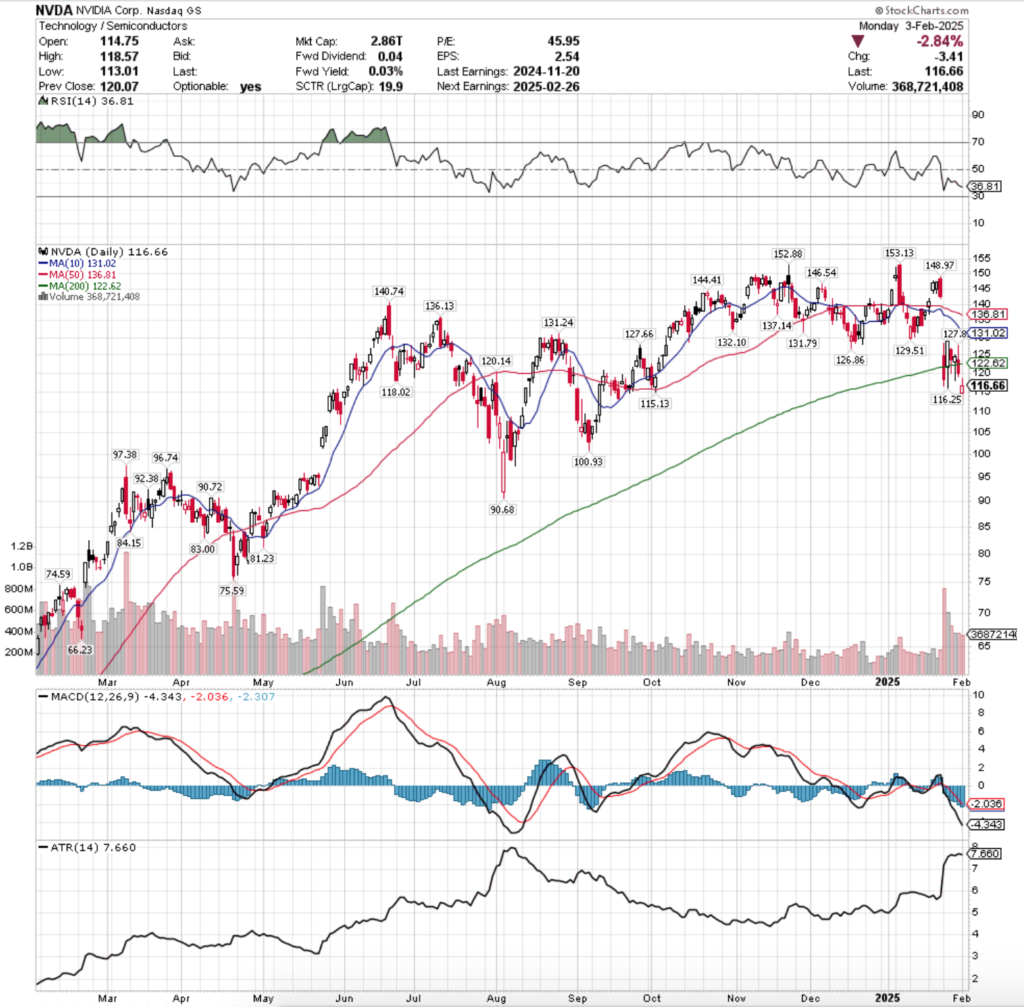
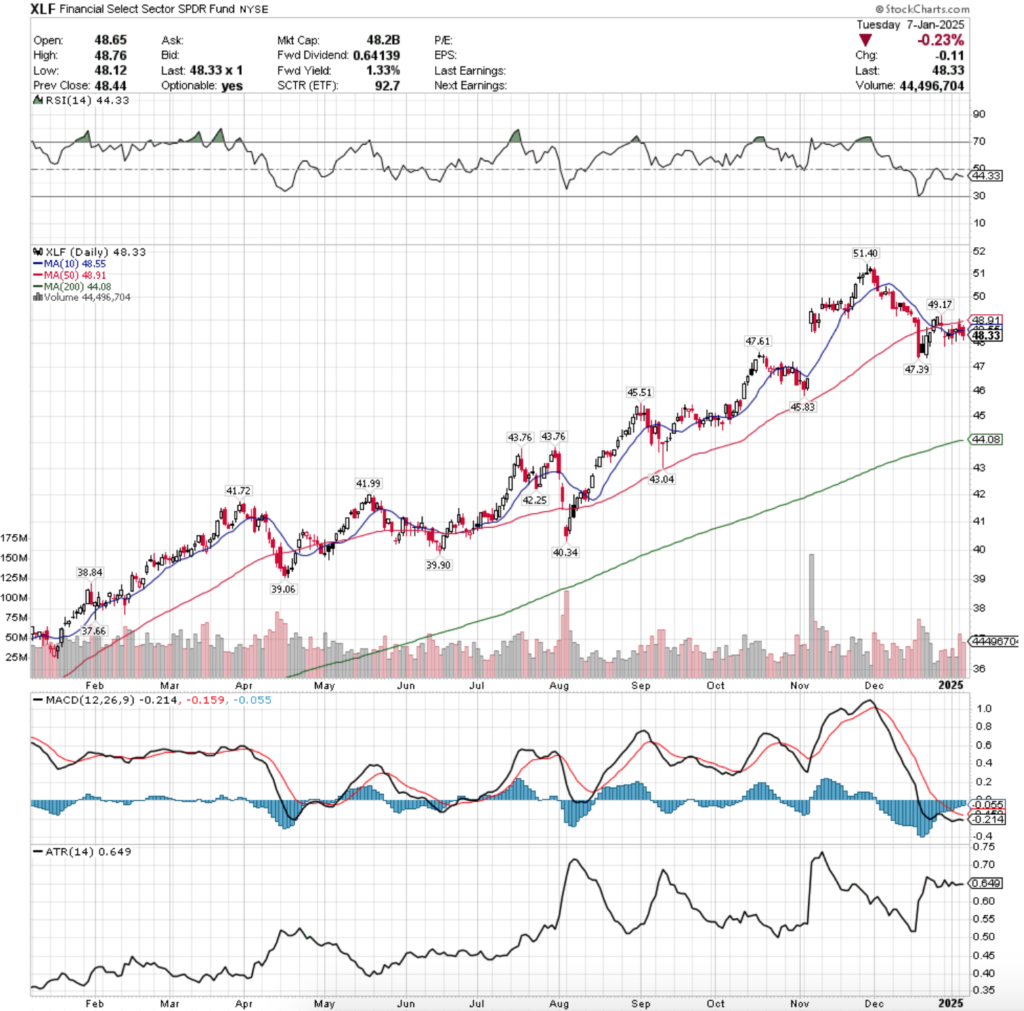
Their RSI is just above the neutral level at 52.37, while their MACD has been bearish since the beginning of June.
Volumes have been +22.86% higher than the past year’s average levels over the past week & a half (13,121,428.57 vs. 10,679,920), which is slight cause for concern coming off of their 52-week high, which occurred on a not-so-bullish session.
Last Monday saw XLU open on a slight decline, just above the 10 day moving average’s support, which it tested intraday, but remained sturdy & forced XLU higher to close as an advancing session with sturdy advancing volume.
Tuesday began to show signs of cracks, as XLU opened on a large gap up to above their upper Bollinger band, hitting a high of $83.17 (52-week high) before crumbling down to $81.74/share & recovering during the day to close below its opening price at $82.40.
This showed a lot of intraday profit taking, as well as folks taking chips off of the table following the run up of the previous three sessions & set the stage for more profit taking heading into the end of the week.
Wednesday opened on a gap down & everyone was jumping out of the pool, forcing XLU’s price lower to break down the support of the 10 day moving average, breaking the short-term trend on the highest volume that XLU has seen since early April 2025.
Thursday opened higher, but the theme of declines carried on & XLU crossed below the 20 day moving average, leaving a lower shadow that indicated that there was more downside than upside sentiment still lurking.
Friday also showed a lack of enthusiasm for XLU, as a gap up open quickly broke down to expose a lower shadow that went down to new depths not seen since late May, indicating that there was beginning to be a sense of fear in the market.
Volumes were about even with the previous day’s outflow volume, and the resistance of the 10 day moving average remained resilient to the upside.
The day’s candle was a hanging man despite not being in a true uptrend & it closed below its opening price, indicating that there is more danger on the horizon for XLU.
Monday opened up on a gap down, tried to rally & test higher but was rejected by the resistance of the 10 day moving average, and it all went downhill from there to close the day out as a declining session on volumes that were higher than the previous two days’.
Tuesday opened on a gap up, but again was unable to gather any steam to the upside & reversed well short of the 10 DMA, before sliding down to $80.25 before closing at $80.86 as a doji candle, indicating that there was a bit of uncertainty in the air.
While the day managed to advance, it also formed a bearish harami cross, which when paired with the deep lower shadow looks like there is more downside appetite for XLU on the horizon.
It is also worth noting that there was a bit of intraday profit taking & cutting losses short, as the sessions volume suggests, but the overall sentiment is still not enthusiastic in the near-term.
To the upside, the 10 day moving average will be the primary area of focus, as if it is broke through then XLU has one remaining test before retesting their 52-week high.
The 10 DMA is also an area of interest in the consolidation case, where prices would oscillate around the range that they’ve been in the past few sessions & around the 10 DMA while awaiting an upside or downside catalyst.
To the downside there is a solid amount of support in the $79-79.99/share zone, but should that break down & the $78/share level be encroached we will see a test of the long-term moving average.
This is important as it marks long-term sentiment & outlook, while also having a great deal of Seller dominated zones directly beneath it (four of the next five down, with the one non Seller zone being historically gridlocked between Buyers & Sellers).
The table in the section below is worth reviewing to assess the strength of each price level XLU may trade at in the coming weeks-to-months & can be used as a tool for evaluating the strength/weakness of support/resistance levels when they get re-tested, based on XLU’s performance over the past ~4 years.
Again, recall that this is not financial advice, but is meant to serve as an additional tool to use in doing your own due diligence on XLU.
Price Level:Volume Sentiment Analysis For XLU, The Utilities Select Sector SPDR Fund ETF
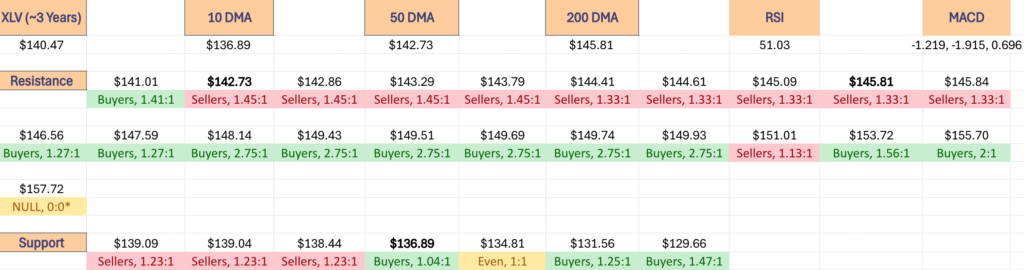
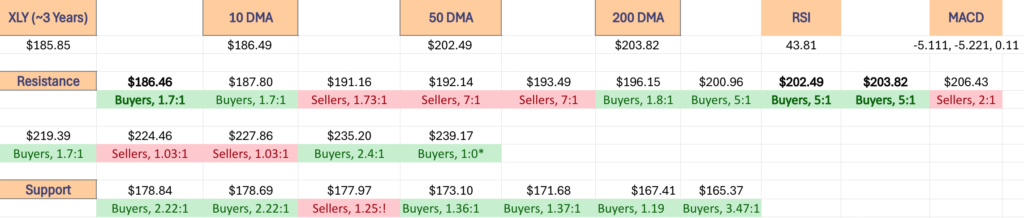
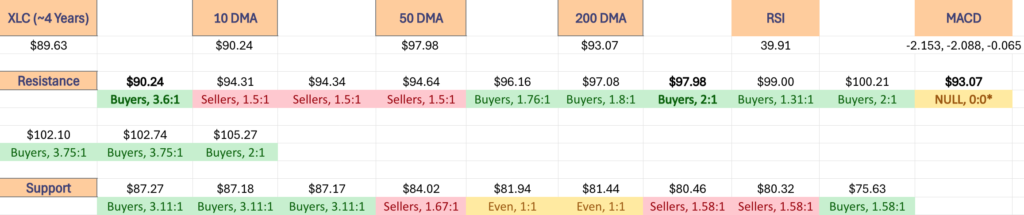
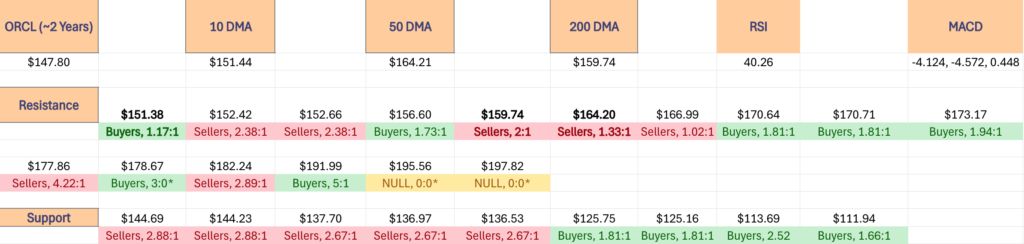
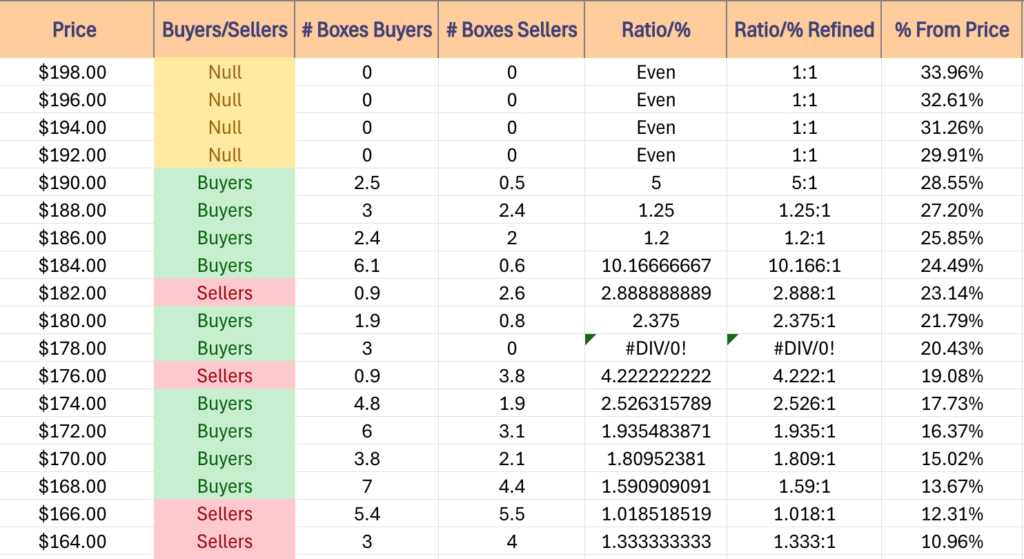
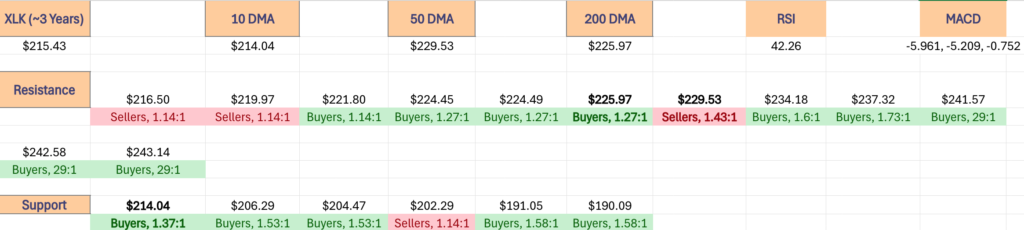
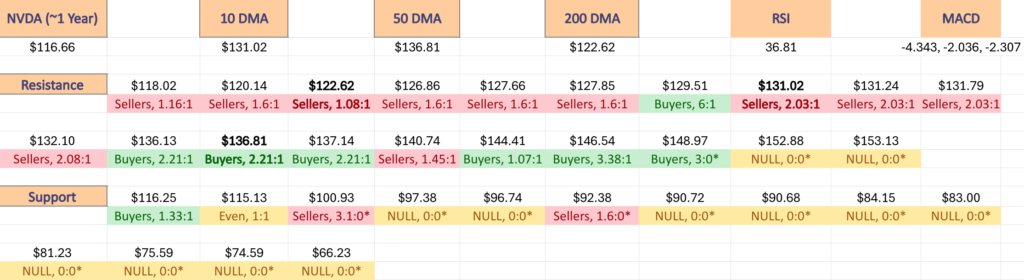
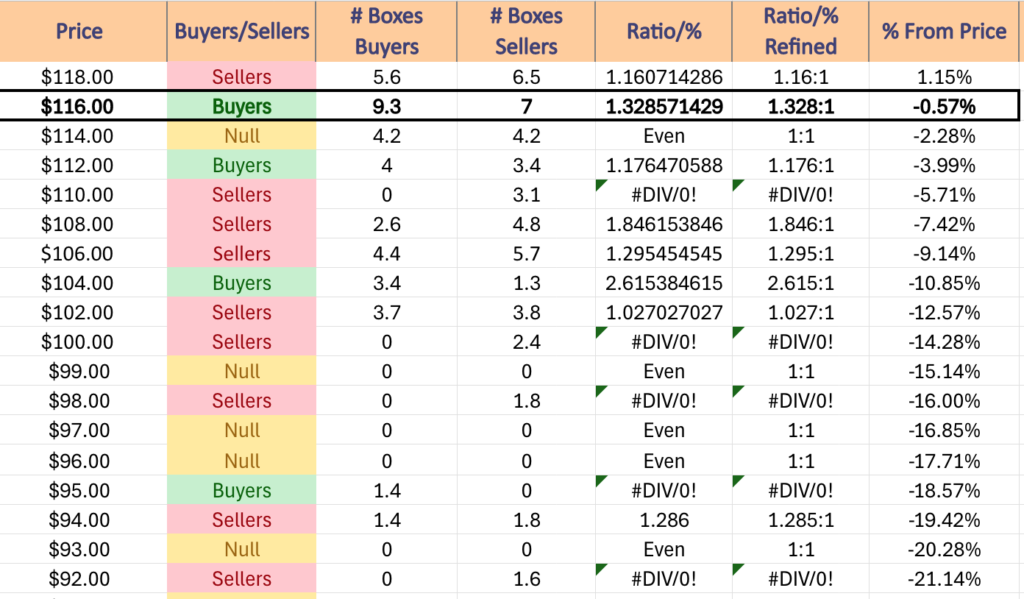
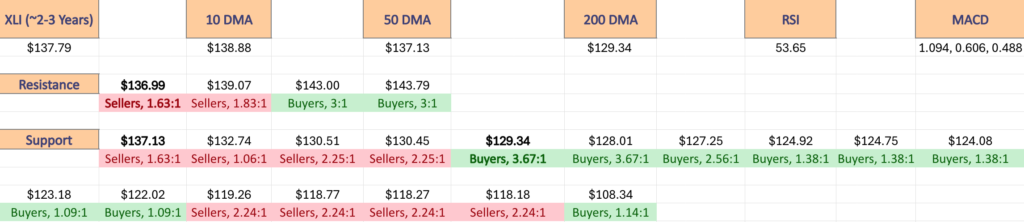
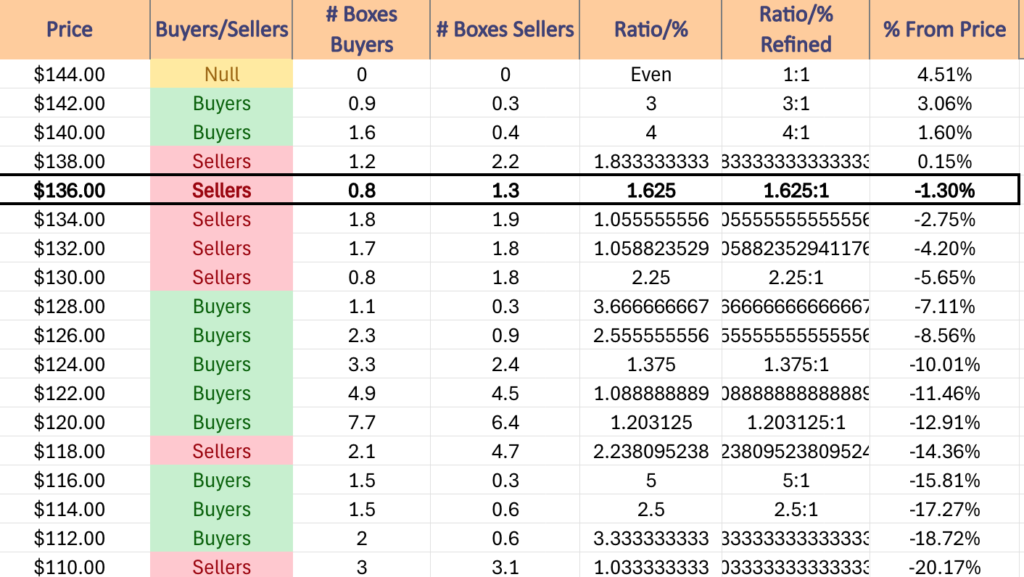
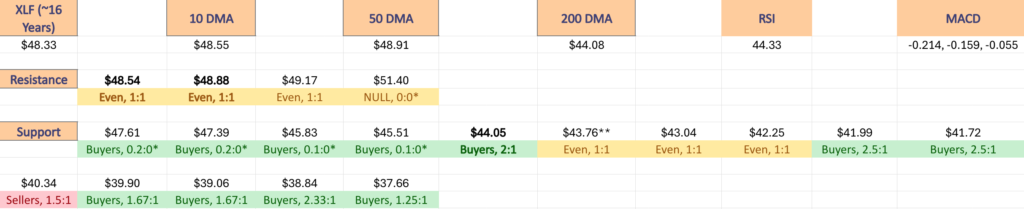
The top table below shows the support & resistance levels of XLU from the past year’s chart, as well as their price level:volume sentiment at each from data covering the past ~4 years, using Tuesday 6/10/2025’s closing data for their price & moving averages/other technicals.
The 10, 50 & 200 day moving averages are denoted with bold.
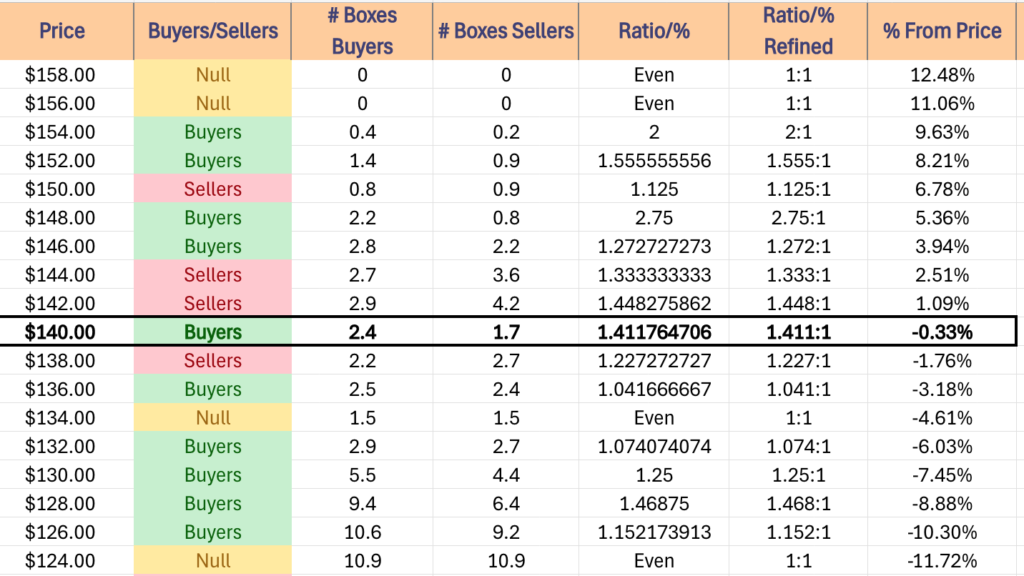
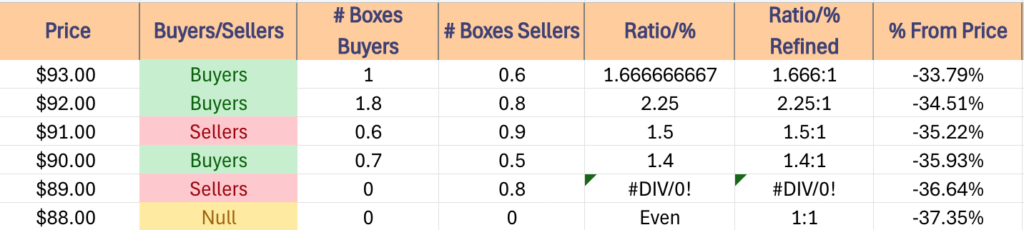
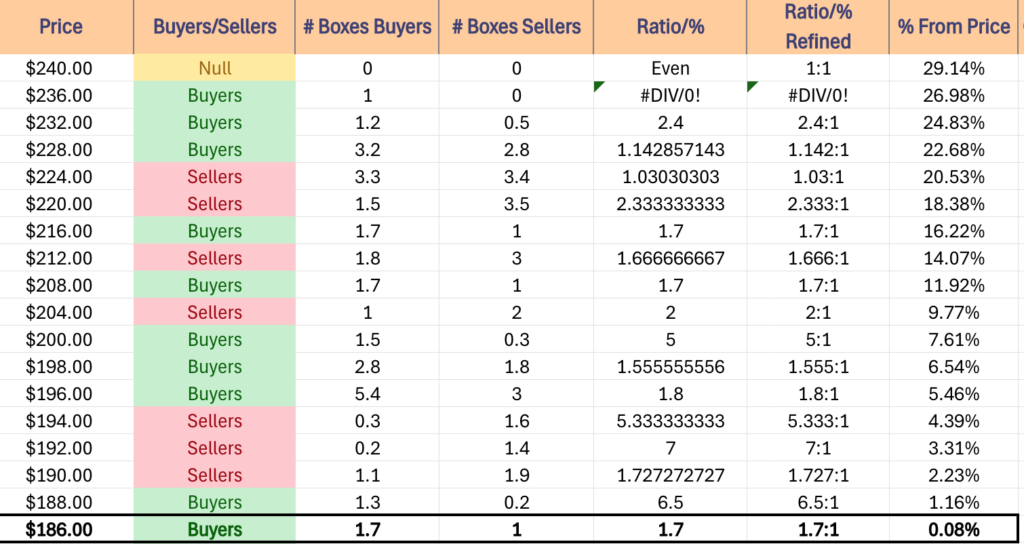
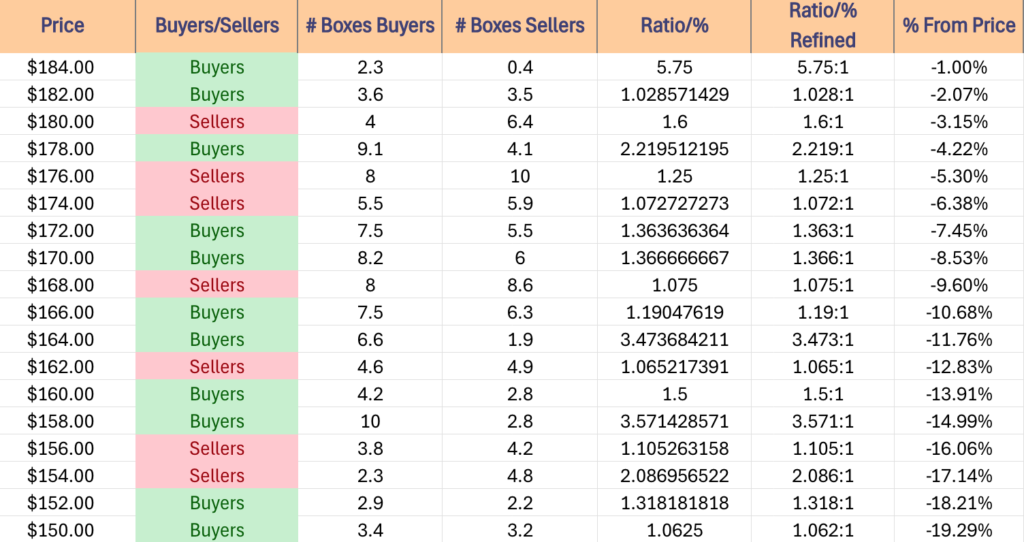
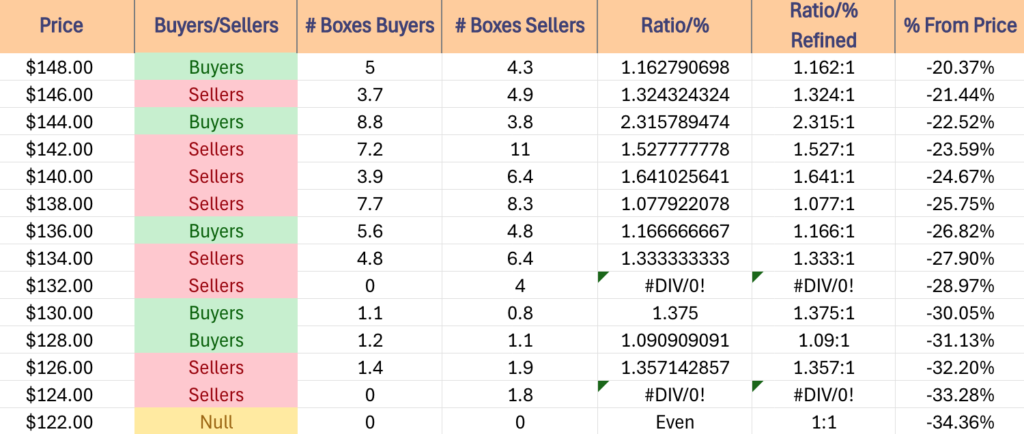
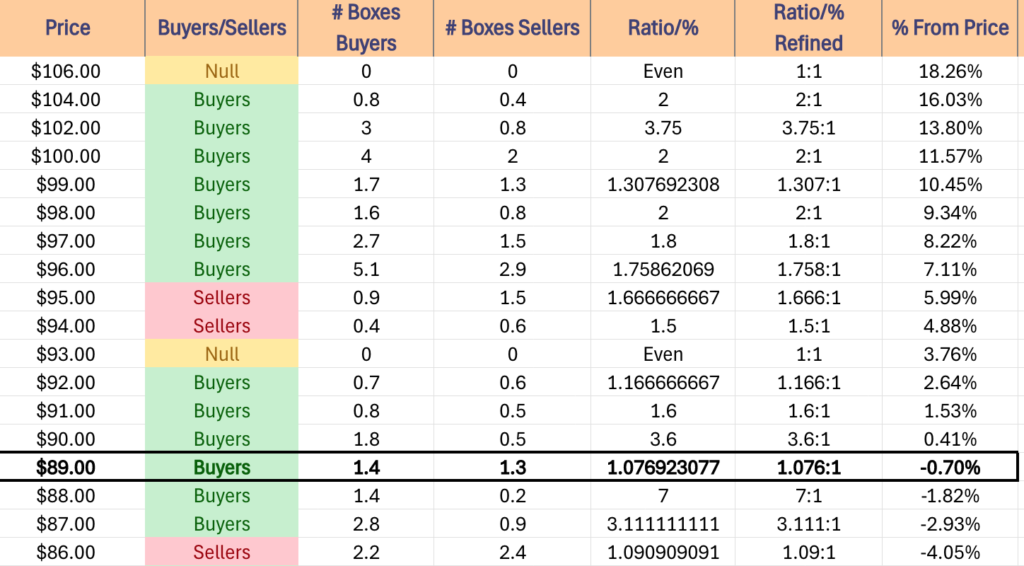
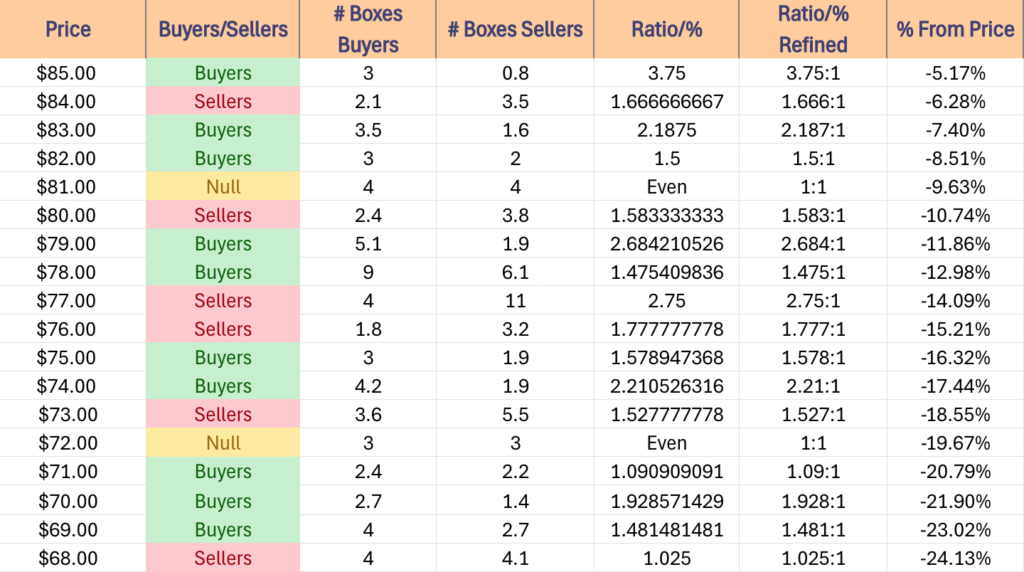
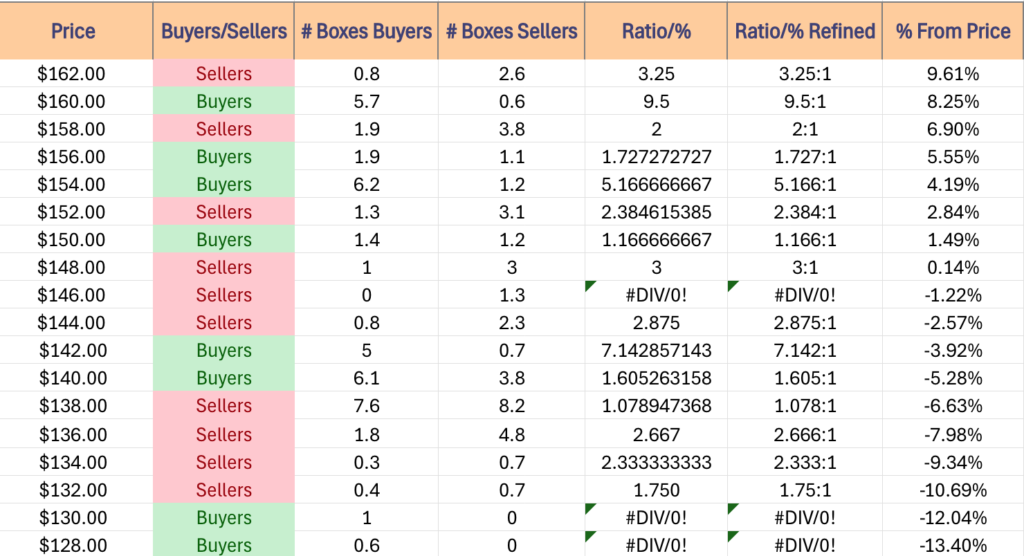
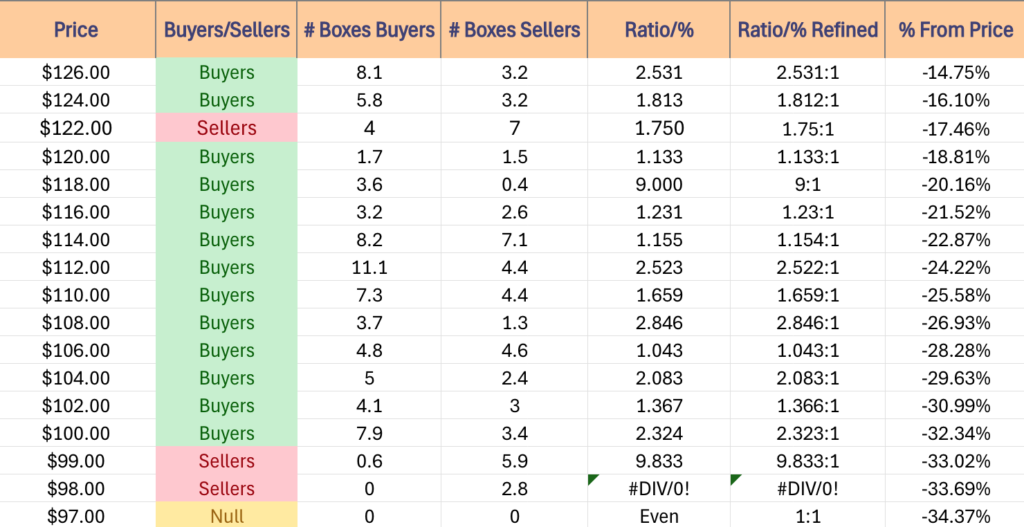
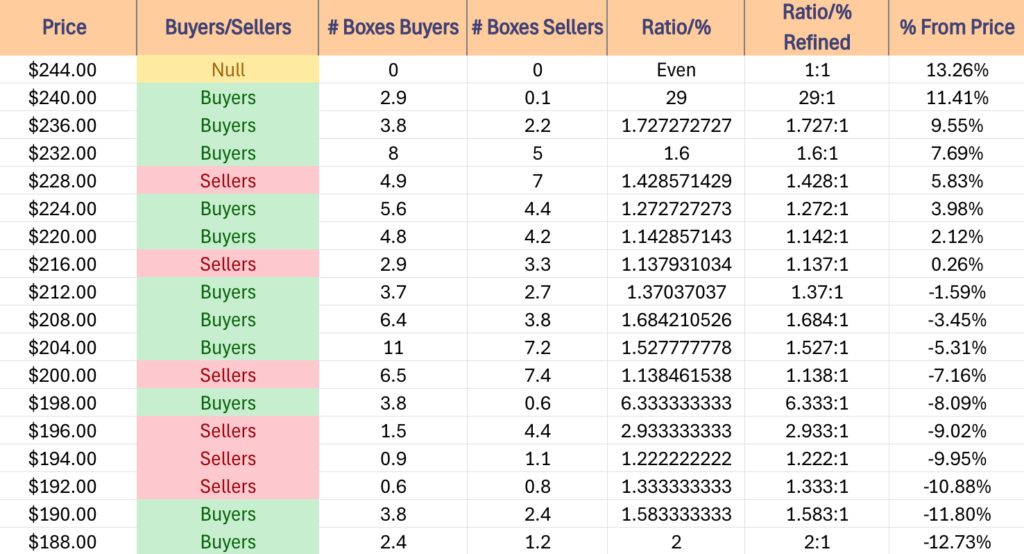
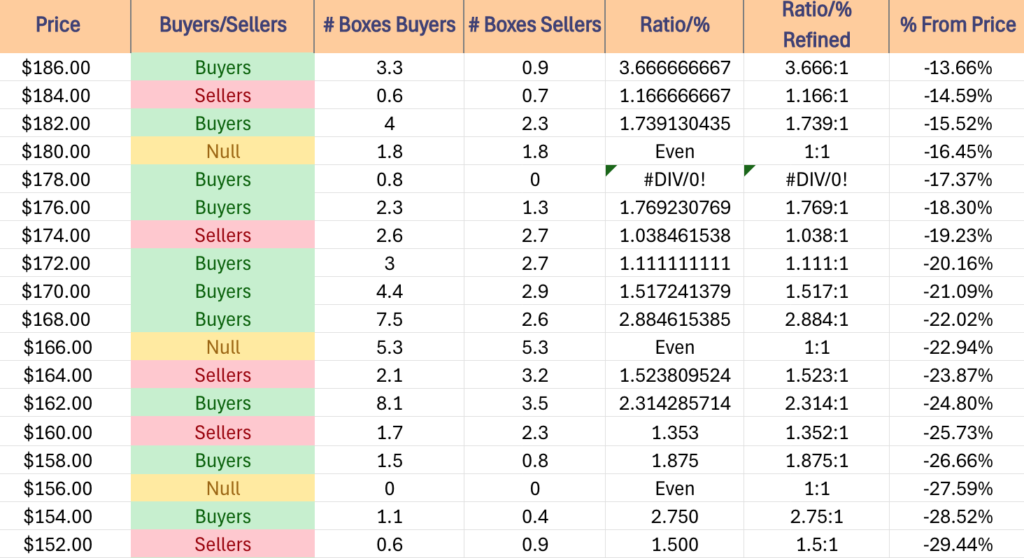
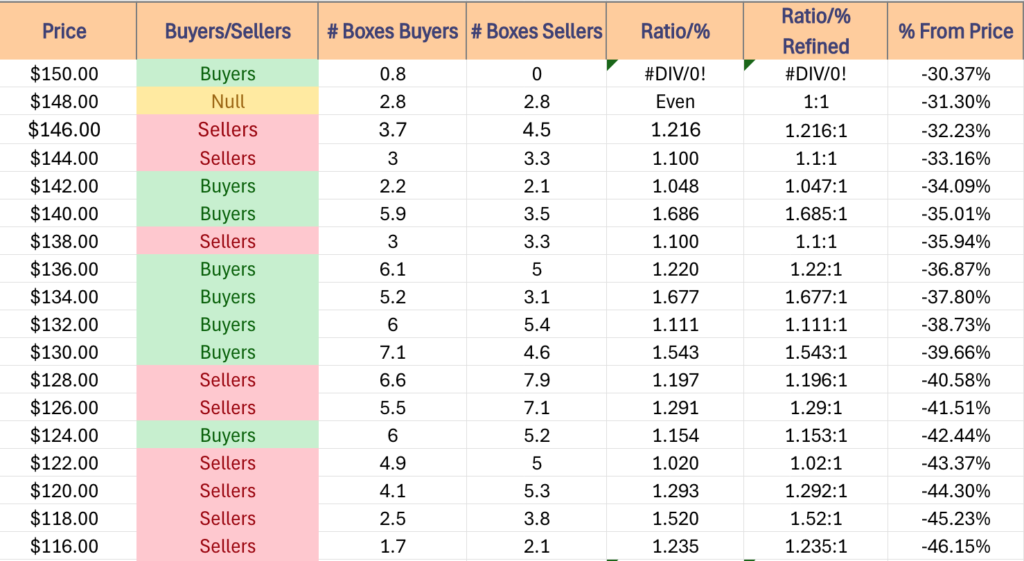
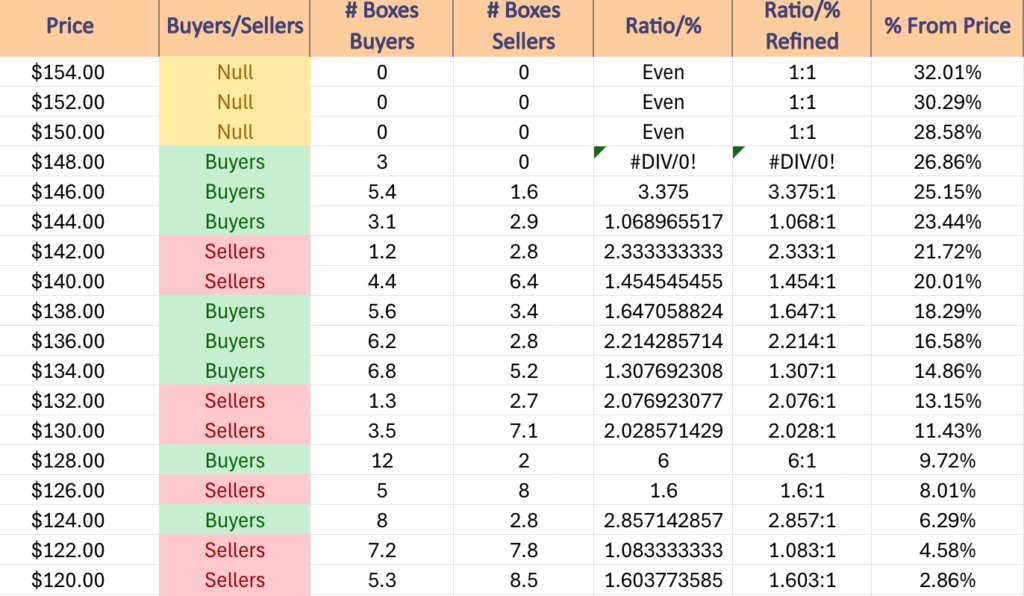
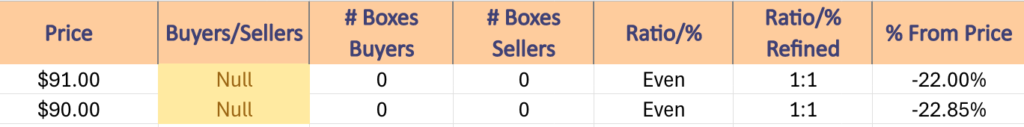
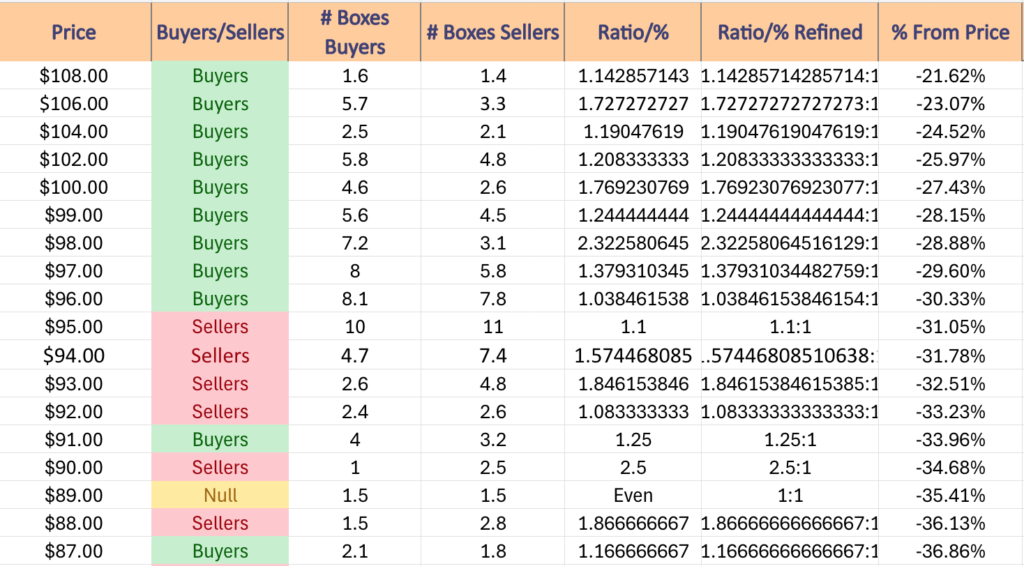
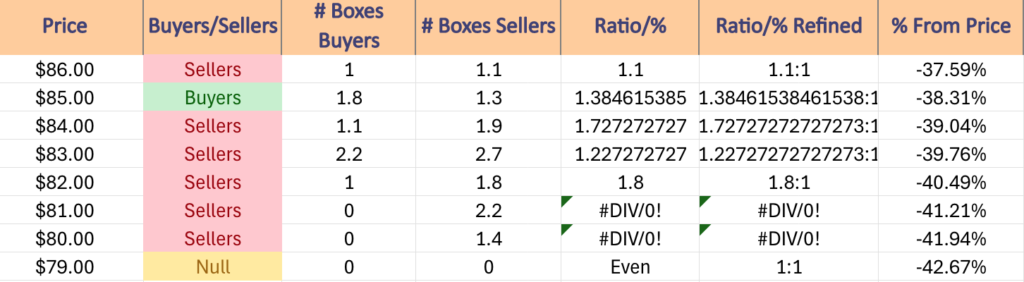
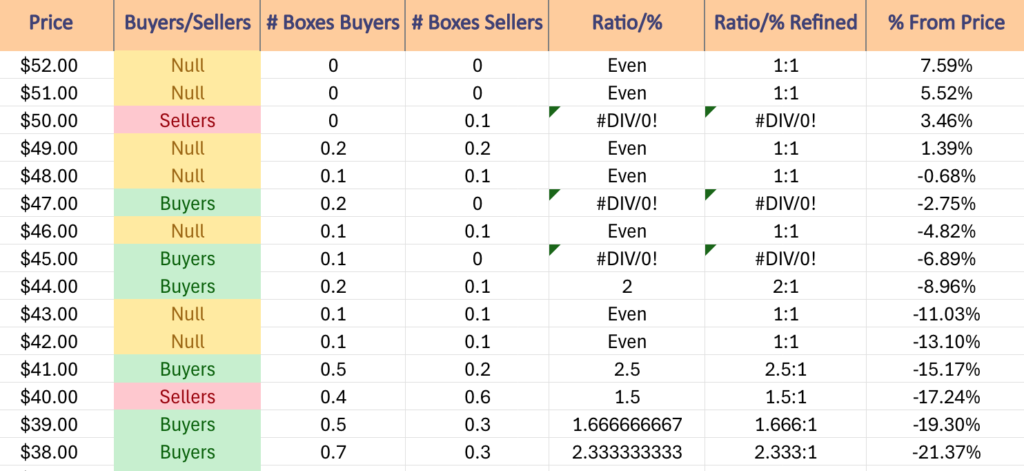
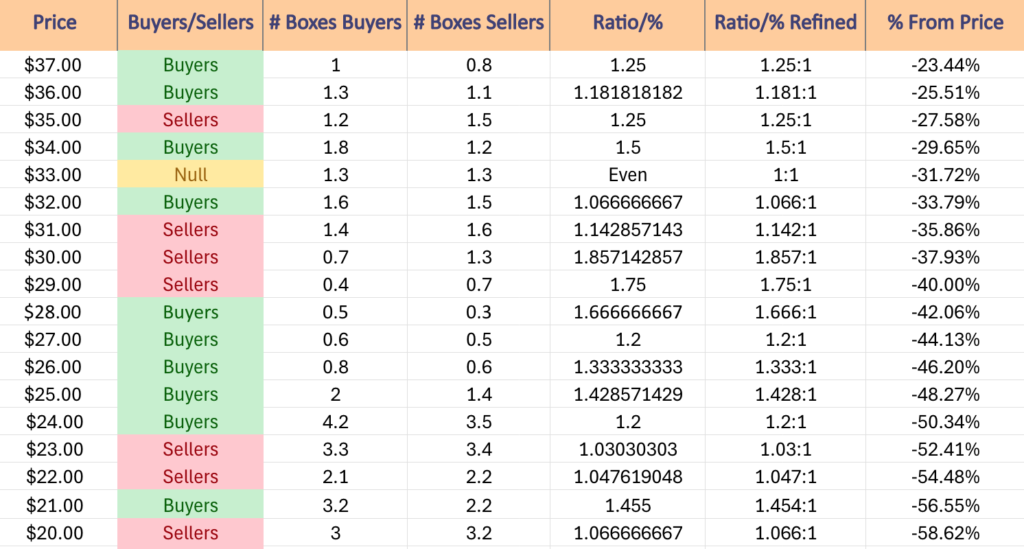
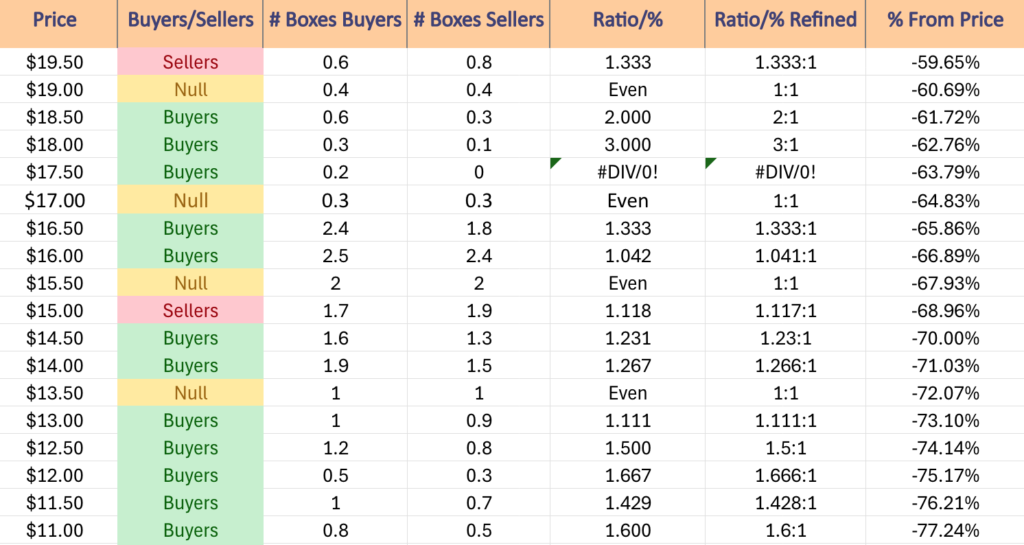
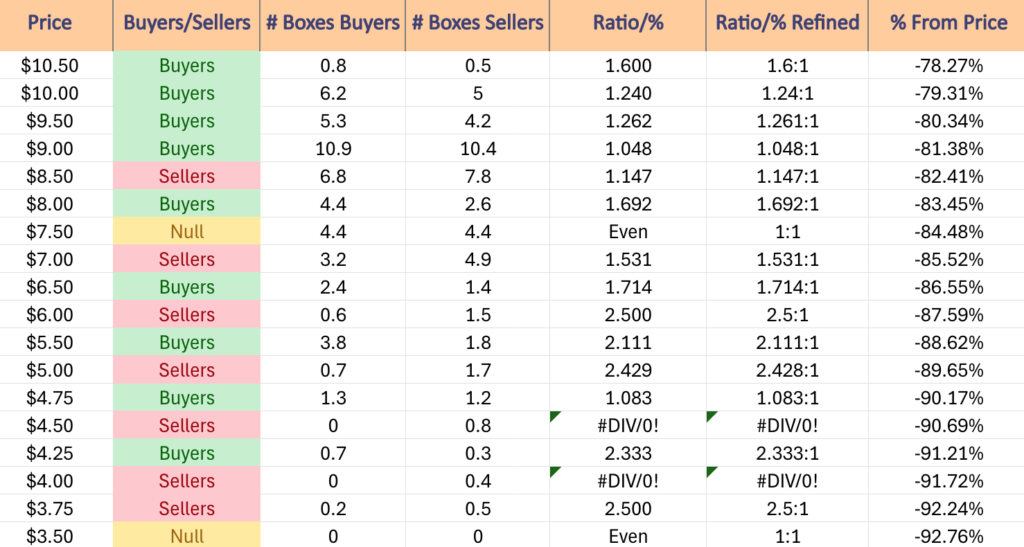
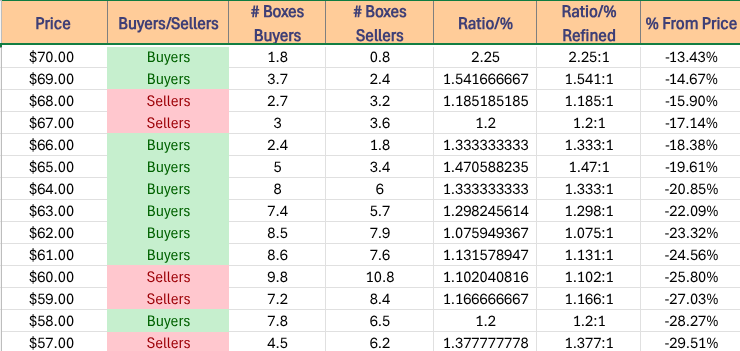
The next tables show the volume sentiment at each individual price level XLU has traded at over the past ~4 years.
Beneath them is a copy & pasteable list of the same data, where the support/resistance levels are denoted in bold.
All ratios with “0” in the denominator are denoted with a “*”.
NULL values are price levels that had limited trading volume, whether it be due to gaps, quick advances or they are at price extremes; in the event that they are retested & there is more data they would have a distinct “Buyers”, “Sellers” or “Even” title.
This is not intended as financial advice, but rather another tool to consider when performing your own research & due diligence on XLU.
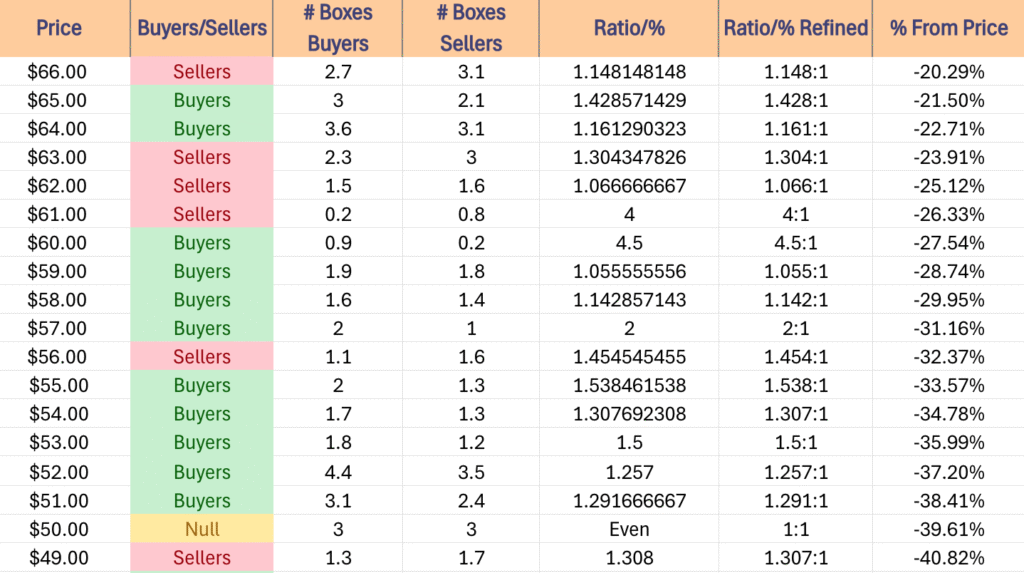
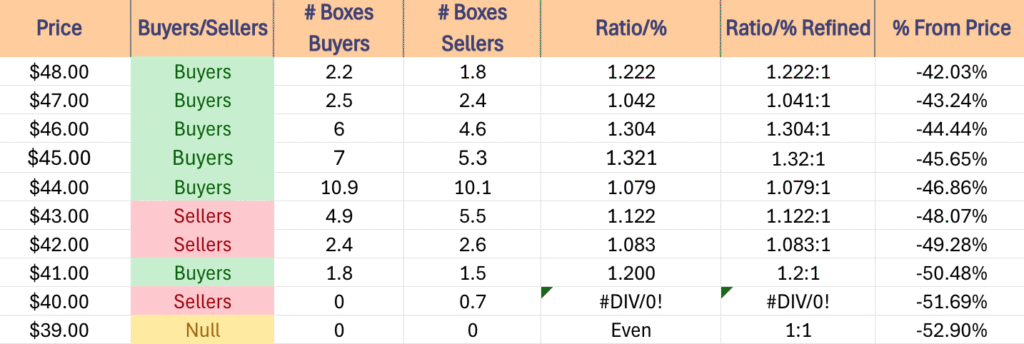
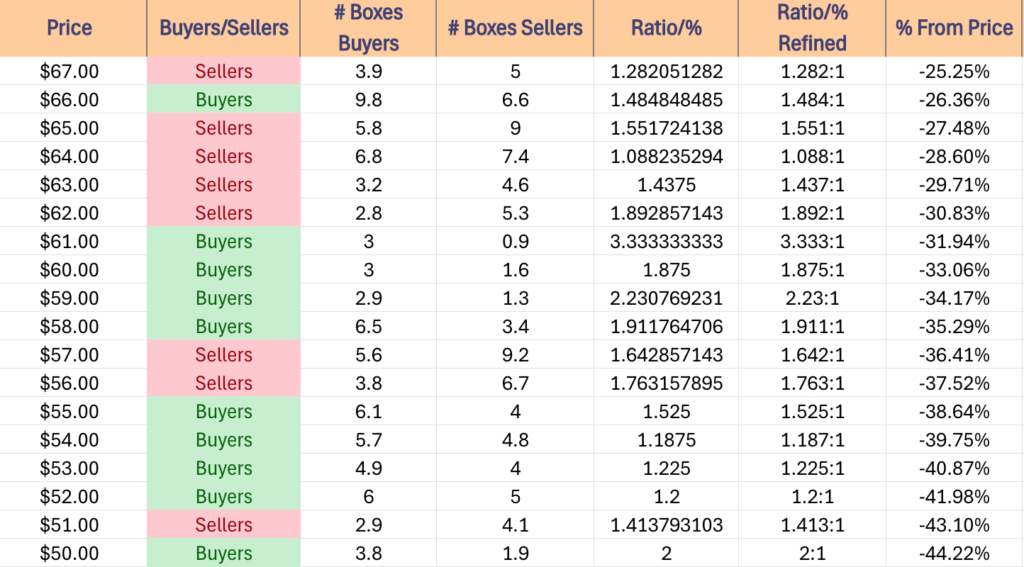
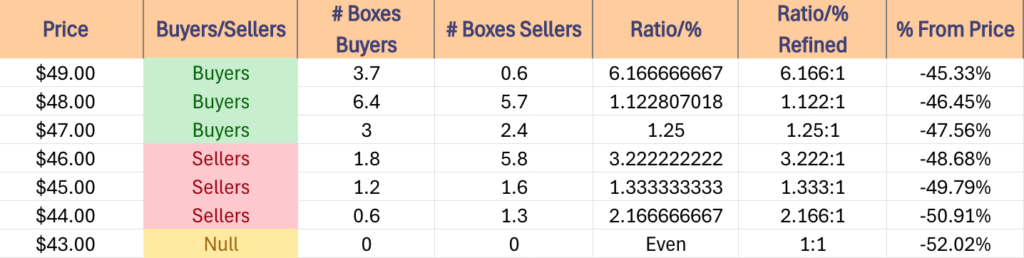
The following section lays out XLU’s one year support/resistance levels, as well as their Buyer:Seller (Seller:Buyer) ratios at each price level that they’ve traded at over the past ~4 years, which can be used as a barometer for estimating the expected strength/weakness of each of the support/resistance levels.
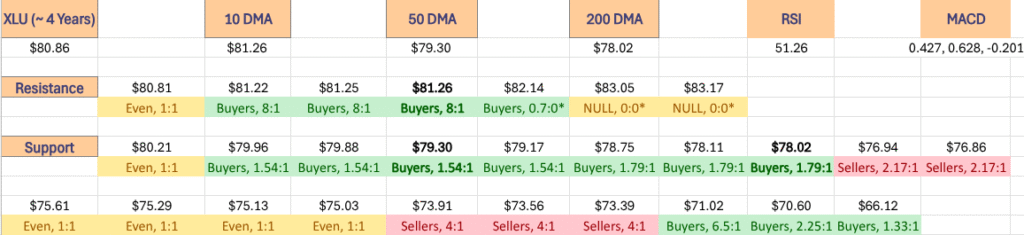

$84 – NULL – 0:0*, +3.88% From Current Price Level
$83 – NULL – 0:0*, +2.65% From Current Price Level
$82 – Buyers – 0.7:0*, +1.41% From Current Price Level
$81 – Buyers – 8:1, +0.17% From Current Price Level – 10 Day Moving Average*
$80 – Even – 1:1, -1.06% From Current Price Level – Current Price Level*
$79 – Buyers – 1.54:1, -2.3% From Current Price Level – 50 Day Moving Average*
$78 – Buyers – 1.79:1, -3.54% From Current Price Level – 200 Day Moving Average*
$77 – Sellers – 1.5:1, -4.77% From Current Price Level
$76 – Sellers – 2.17:1, -6.01% From Current Price Level
$75 – Even – 1:1, -7.25% From Current Price Level
$74 – Sellers – 1.8:1, -8.48% From Current Price Level
$73 – Sellers – 4:1, -9.72% From Current Price Level
$72 – Buyers – 1:0*, -10.96% From Current Price Level
$71 – Buyers – 6.5:1, -12.19% From Current Price Level
$70 – Buyers – 2.25:1, -13.43% From Current Price Level
$69 – Buyers – 1.54:1, -14.67% From Current Price Level
$68 – Sellers – 1.19:1, -15.9% From Current Price Level
$67 – Sellers – 1.2:1, -17.14% From Current Price Level
$66 – Buyers – 1.33:1, -18.38% From Current Price Level
$65 – Buyers – 1.47:1, -19.61% From Current Price Level
$64 – Buyers – 1.33:1, -20.85% From Current Price Level
$63 – Buyers – 1.3:1, -22.09% From Current Price Level
$62 – Buyers – 1.08:1, -23.32% From Current Price Level
$61 – Buyers – 1.13:1, -24.56% From Current Price Level
$60 – Sellers – 1.1:1, -25.8% From Current Price Level
$59 – Sellers – 1.17:1, -27.03% From Current Price Level
$58 – Buyers – 1.2:1, -28.27% From Current Price Level
$57 – Sellers – 1.38:1, -29.51% From Current Price Level
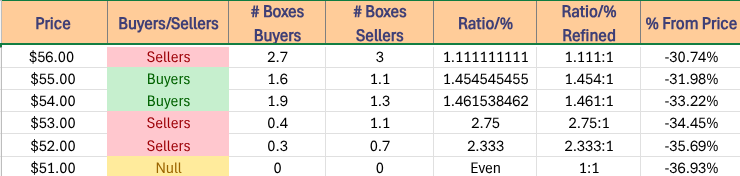
$56 – Sellers – 1.11:1, -30.74% From Current Price Level
$55 – Buyers – 1.45:1, -31.98% From Current Price Level
$54 – Buyers – 1.46:1, -33.22% From Current Price Level
$53 – Sellers – 2.75:1, -34.45% From Current Price Level
$52 – Selelrs – 2.33:1, -35.69% From Current Price Level
$51 – NULL – 0:0*, -36.93% From Current Price Level
*** I DO NOT OWN SHARES OR OPTIONS CONTRACT POSITIONS IN XLU AT THE TIME OF PUBLISHING THIS ARTICLE ***