This weekend I took a look at Cummins Inc.’s stock, which trades under the ticker $CMI. Cummins Inc. closed for trading on 6/12 at $167.08/share.
They offer an attractive 12.3 P/E (ttm), with a 3.49 P/B.
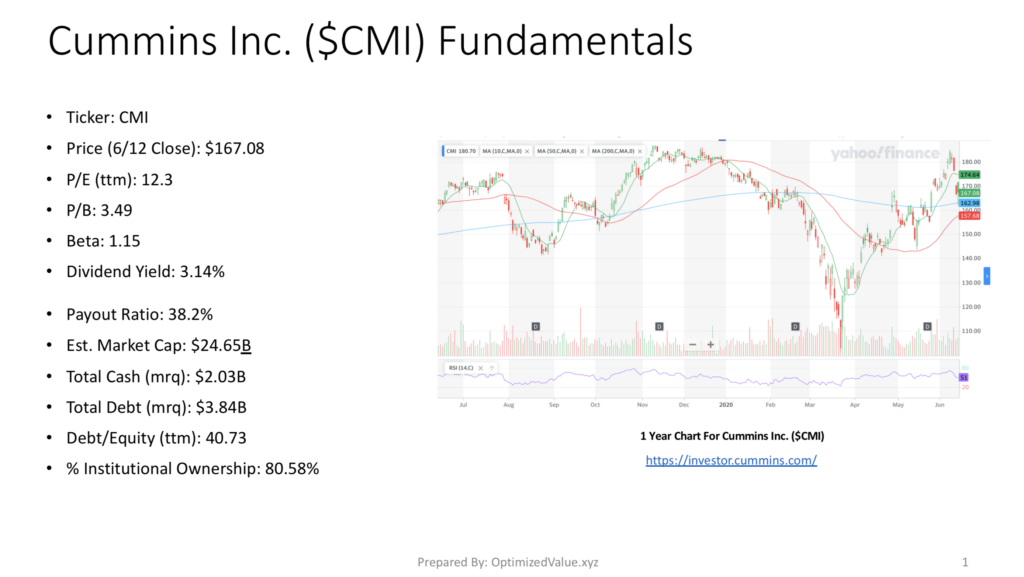
Cummins Inc. has a 3.14% Dividend Yield, with a low 38.2% Payout Ratio. Their Market Cap is $26.65B, with $2.03B Total Cash (mrq) & $3.84B Total Debt (mrq), for a Debt/Equity (ttm) of 40.73.
CMI has a 80.58% Institutional Ownership percentage, which is one of their many advantages over their Industrial Sector Peers
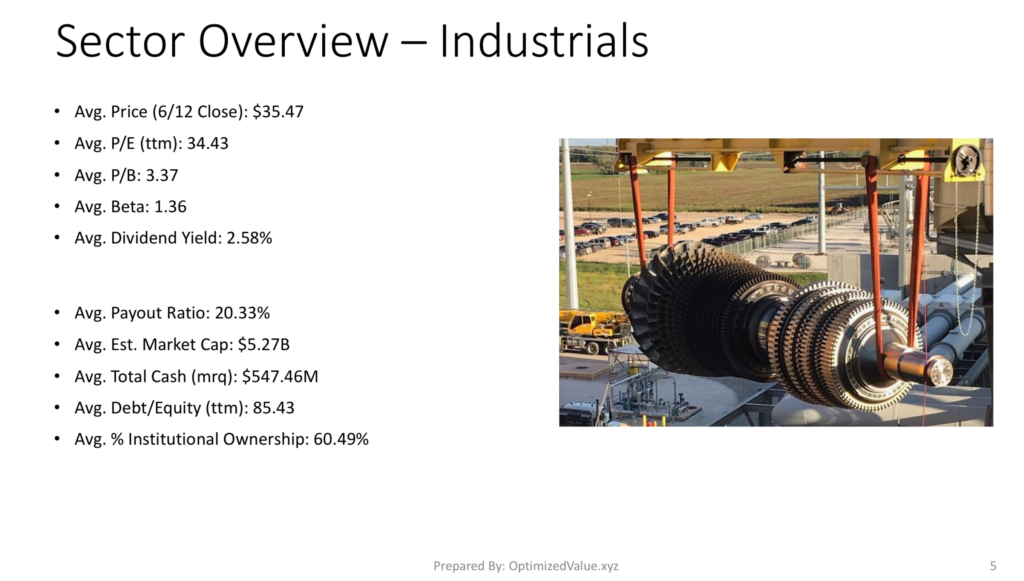
Cummins Inc. $CMI Stock Fundamentals Vs. The Industrials Sector
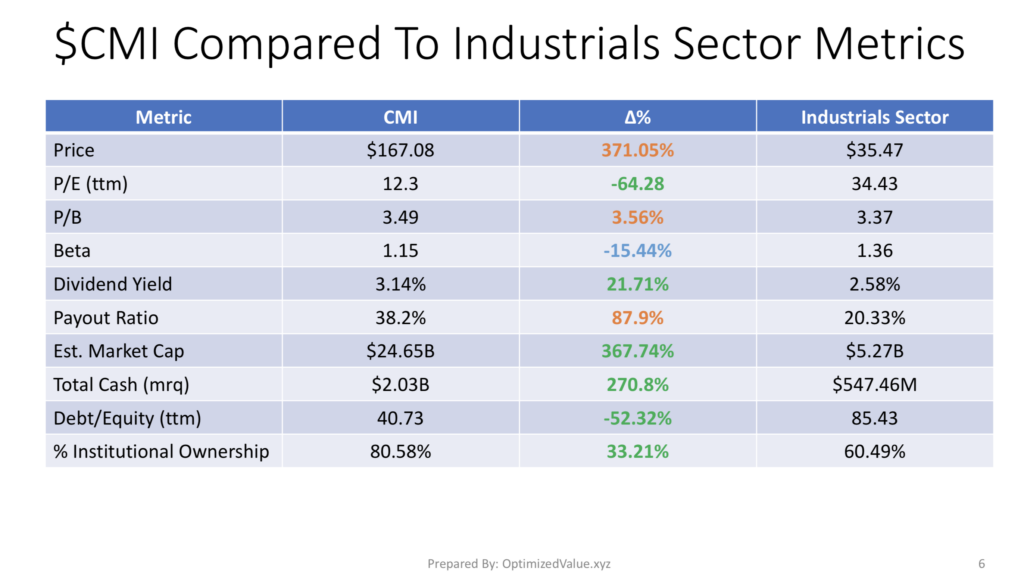
CMI’s P/E (ttm) is 64% less than the average Industrials Sector stock, and their P/B is only 3.6% higher than average.
With their 21.7% higher than average Dividend Yield, they look very attractive from an investment standpoint.
CMI’s Market Cap is 367% higher than the Industrials Sector average, with 270% more Total Cash & a 52% better Debt/Equity (ttm) ratio.
They also have 38% more Institutional Investors than average.
Cummins Inc. $CMI Stock Fundamentals Vs. The Machinery Industry
Cummins Inc.’s stock also has many clear advantages over their peers in the Machinery Industry. CMI’s P/E (ttm) is 77% better than average, and 3.6% better than the average Machinery Industry stock.
CMI’s Dividend Yield is ~36% better than average, with a safe Payout Ratio, which is essential for collecting interest.
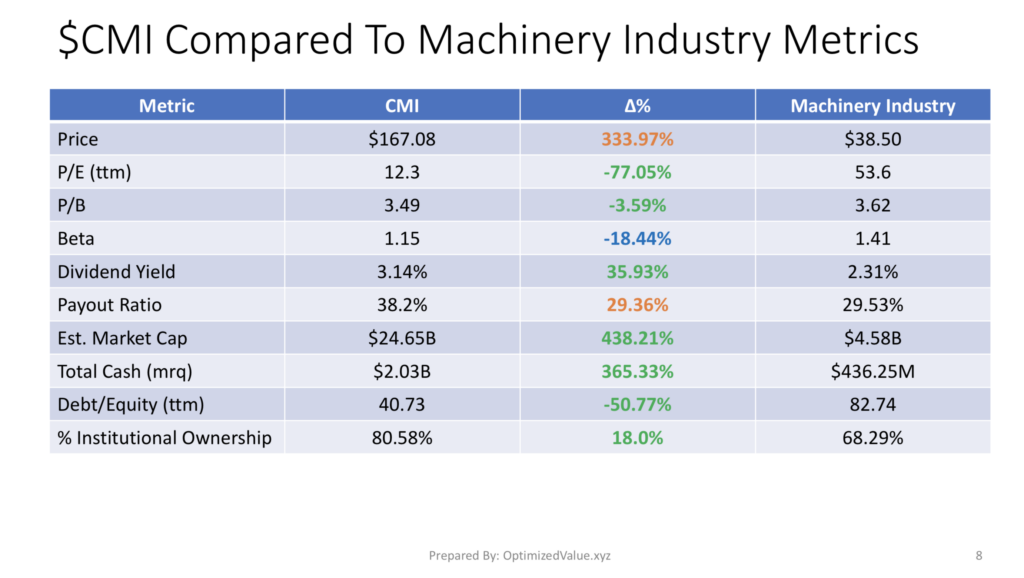
CMI is 438% larger than average based on their Market Cap, with 365% more Total Cash & 51% better Debt/Equity, which is especially important in this investing & trading environment.
CMI also has 18% higher Institutional Investment.
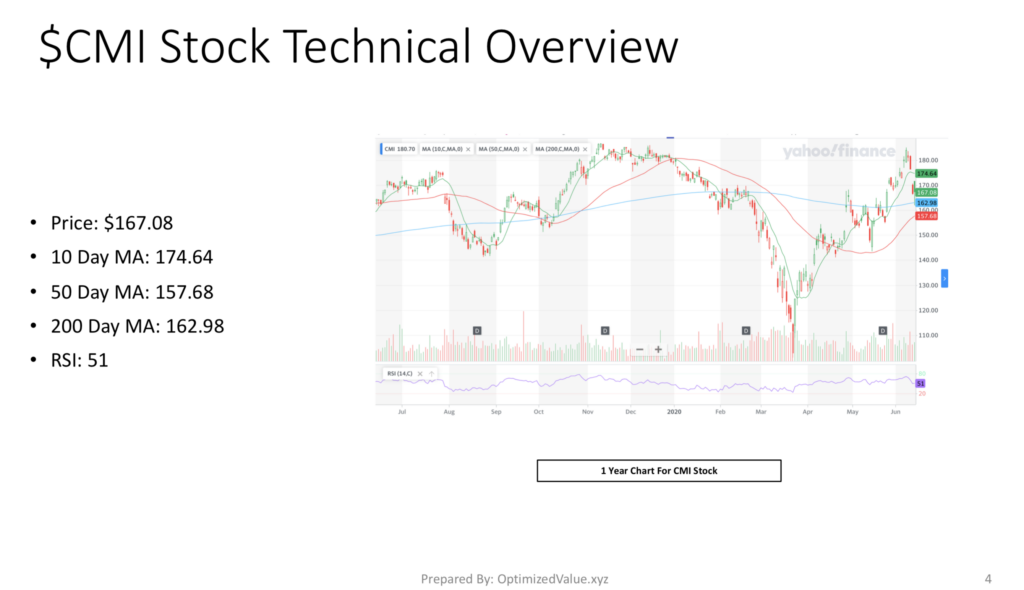
Cummins Inc. CMI’s Stock Technicals
CMI is trading at $167.08, with a 174.64 10 Day Moving-Average.
Their 50 Day M/A is 157.68 & their 200 Day M/A is 162.98, showing strength vs. other stocks in turbulent times.
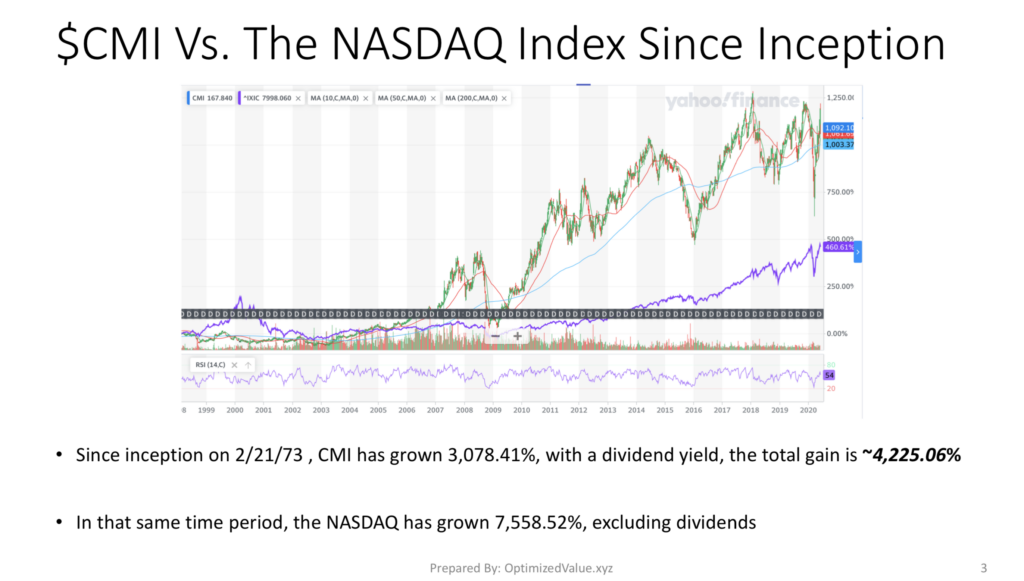
Cummins Inc. $CMI Vs. The S&P 500 & NASDAQ Indexes Since IPO
Cummins Inc. has grown by 3,078.41% since it IPO’d on 2/21/73. It has grown 4,225.06% since then with consideration to historic dividends.
In that time, the S&P 500 Index has only grown by 2,551.77%, excluding dividends.

The NASDAQ Index has grown by 7,558.52% over the same time period, excluding dividends.
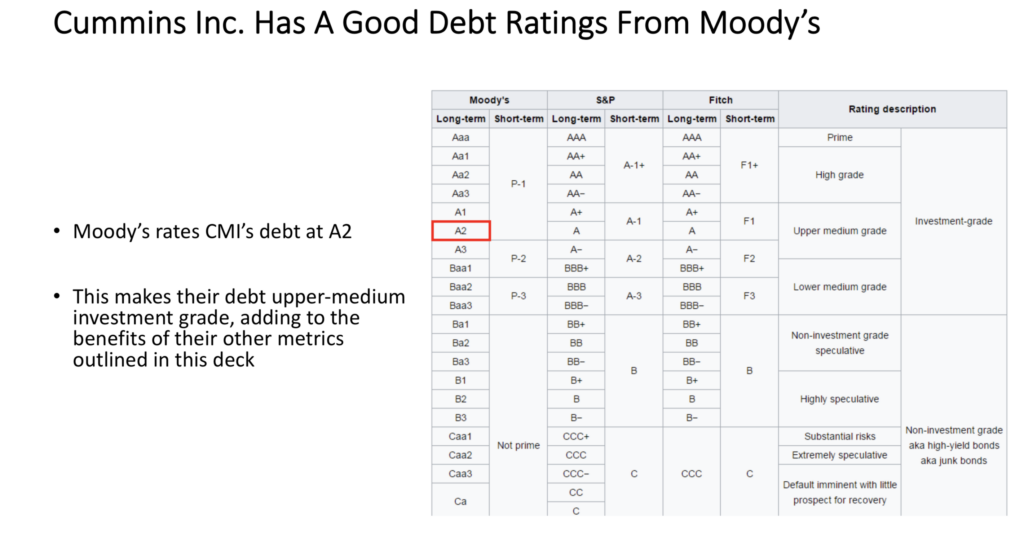
Cummins Inc. $CMI Has A Great Debt Rating
Moody’s rates CMI’s debt A2. which is Upper-Medium Investment Grade debt. As more & more companies begin to get into trouble, having access to credit will become a luxury, and these guys are in good standing.
Tying It All Together
Cummins Inc.’s stock shows many advantages both from a long-term investment & short term trade perspective. They are in solid business shape, offer a strong yield & can weather the current market storms.
I am beginning to look for entries, although I am debating between whether I buy puts & the buy long when I cash in, or by buying longer-term calls in the meantime.
That will be dictate by external market factors that I see this week, but overall it offers many advantages for both long & short term performance.
*** I do not own any shares of CMI stock when this was written ***
For Full PDF Report: