This weekend I reviewed an old favorite stock, Magna International, which trades under the ticker MGA. As of the 6/12 close, MGA traded at $44.16 per share. From an investor’s standpoint, their 14.9 P/E (ttm) & 1.28 P/B look appealing, especially when combined with their 3.62% Dividend Yield.
MGA Stock Fundamentals Show Great Value
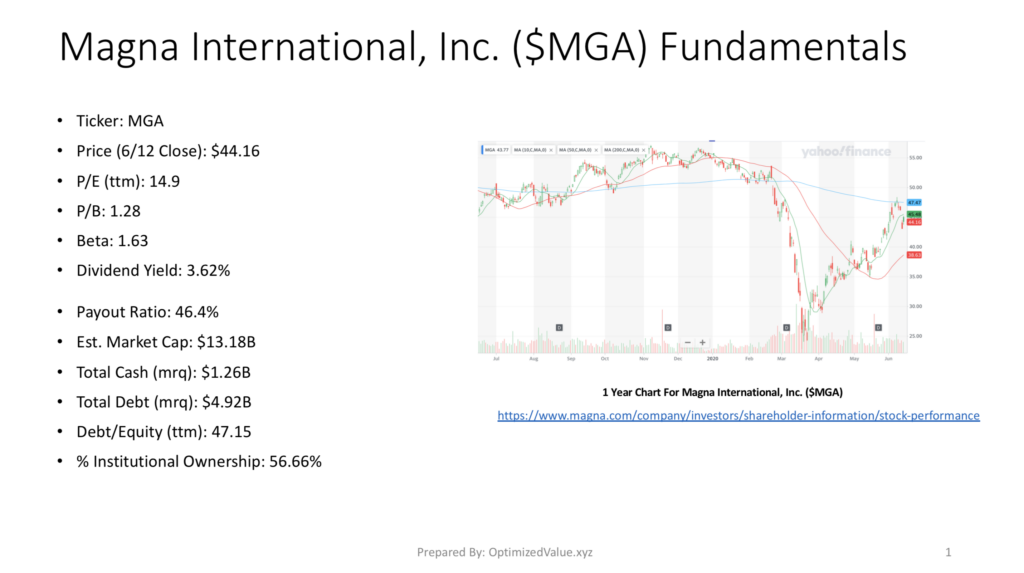
In addition to these great numbers, Magna International has a healthy Payout Ratio of 46.4%, with a Market Cap of $13.18B & $1.26B in Total Cash (mrq). MGA has $4.92B in Total Debt (mrq), with a Debt/Equity ratio of 47.15, and a 56.66% Institutional Ownership.
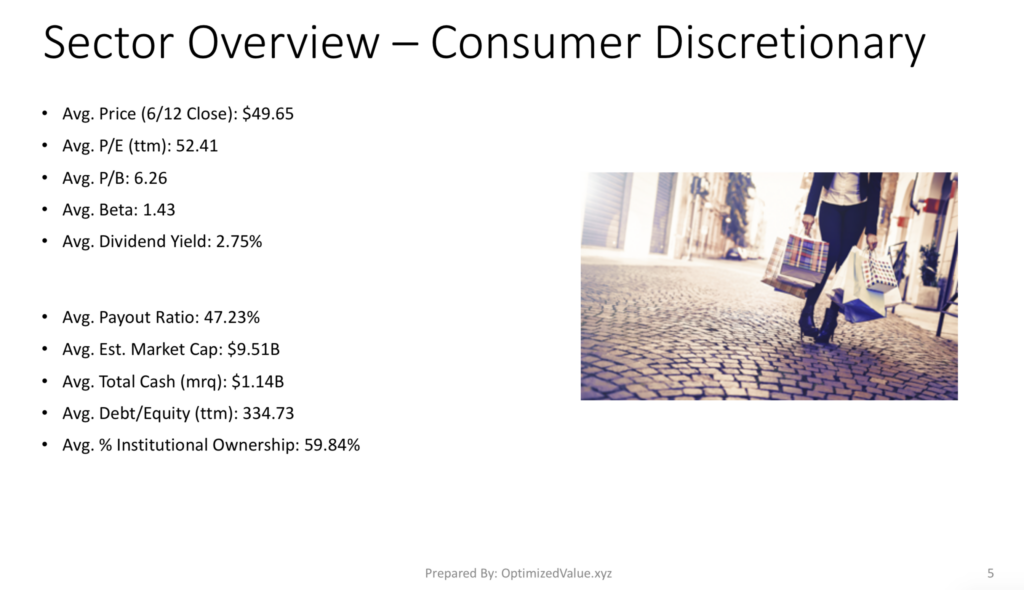
When compared to its peers in the Consumer Discretionary sector, MGA’s appeal becomes even more apparent.
Magna International $MGA Stock Fundamentals Vs. The Consumer Discretionary Sector
Magna International’s P/E(ttm) is 72% lower than their sector peer, and their P/B is 79.55% lower than average.
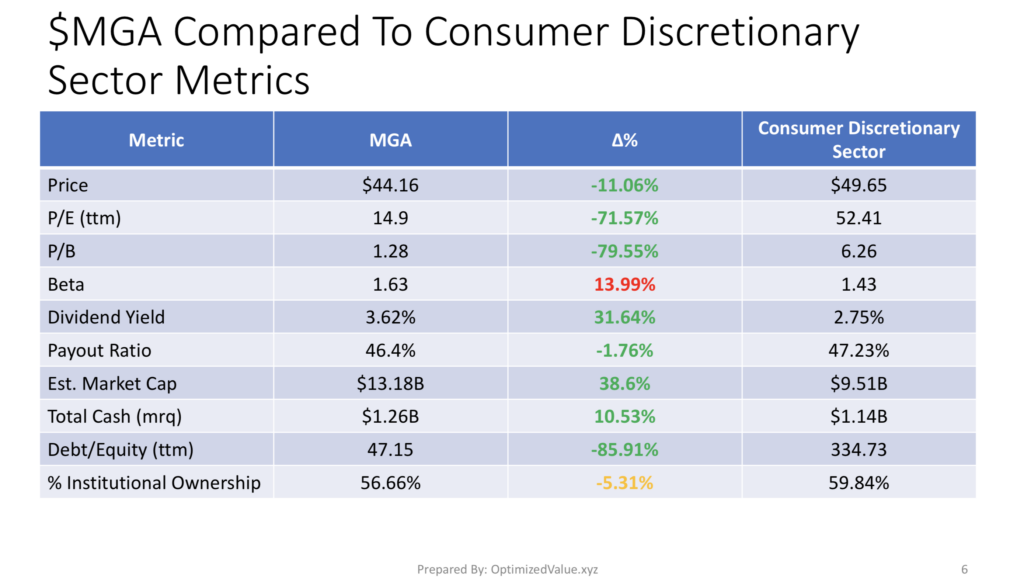
While their Beta is 14% higher than average, the rest of their fundamentals look fantastic. They have a 31.6% advantage over their average peer’s dividend, and have a safe Payout Ratio at 46.4%, which is 1.76% better than average.
MGA’s Market Cap is 38.6% larger than their average Consumer Discretionary peer’s stock, with 10.56% more Total Cash (mrq) & 86% better Debt/Equity (ttm).
They have 5% less Institutional Ownership than the average peer.
Magna International Also Outperforms The Auto Components Industry Averages
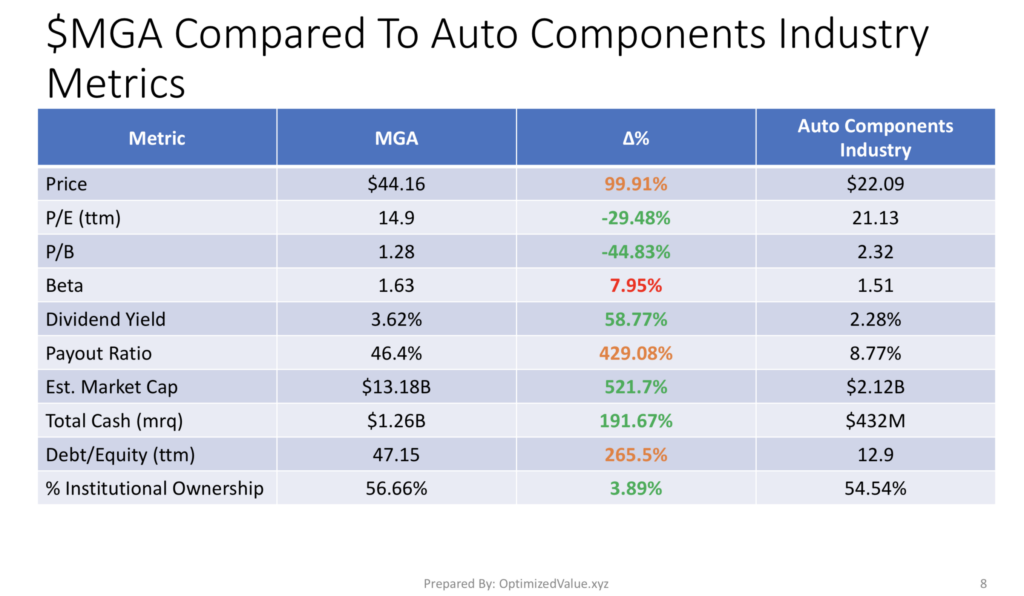
MGA’s P/E (ttm) is 29% lower than the Auto Components Industry Average, with a 45% better P/B than their average peer. Their 58.8% better yield makes them a more attractive buy, which looks to be safe based on their Payout Ratio.
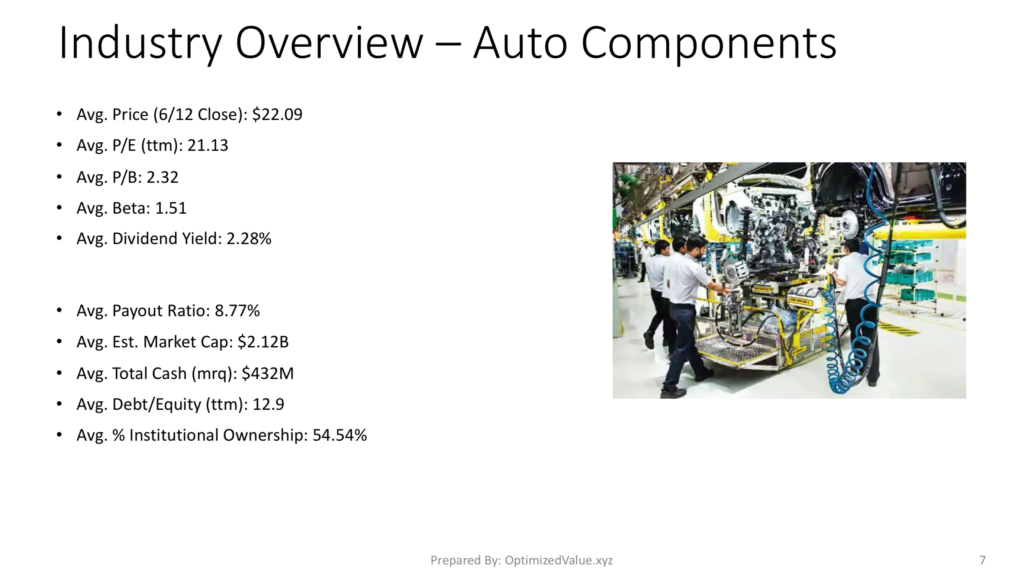
MGA’s Market Cap is 521% larger than their average peer in their industry, with 192% more Total Cash.
Magna International $MGA’s Stock Technicals Overview
MGA has a current price of $44.16, with a 10 Day Moving Average of 45.48. MGA’s 50 Day M/A is 39.63, and their 200 Day M/A is 47.47.
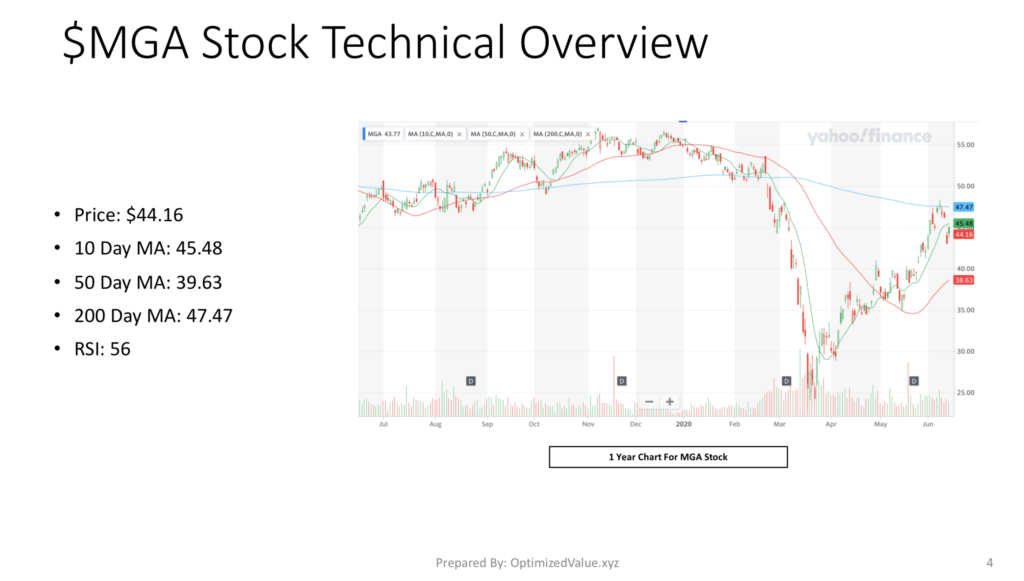
With an RSI of 56, they look prime to perform well, especially during these turbulent times in the market.
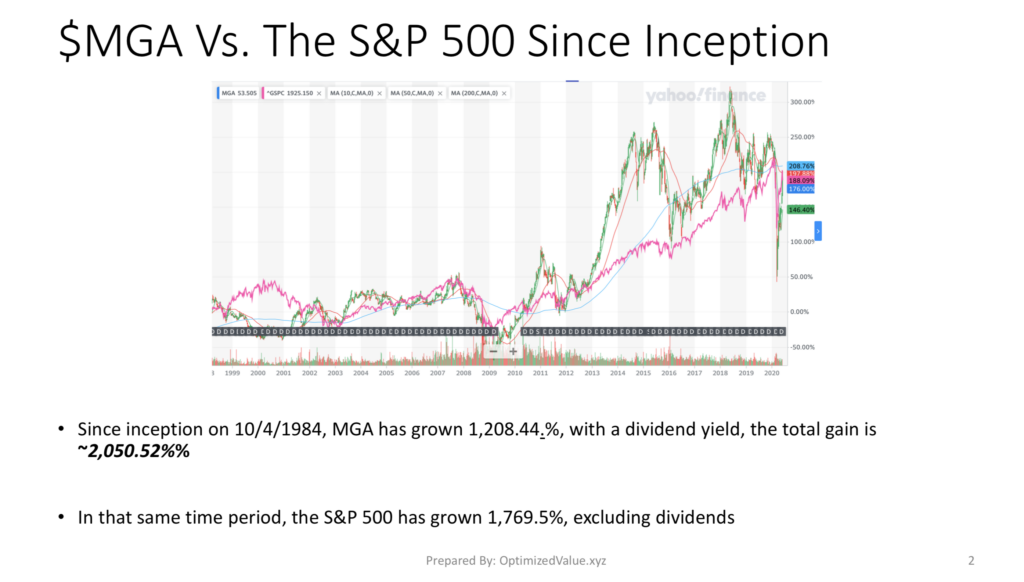
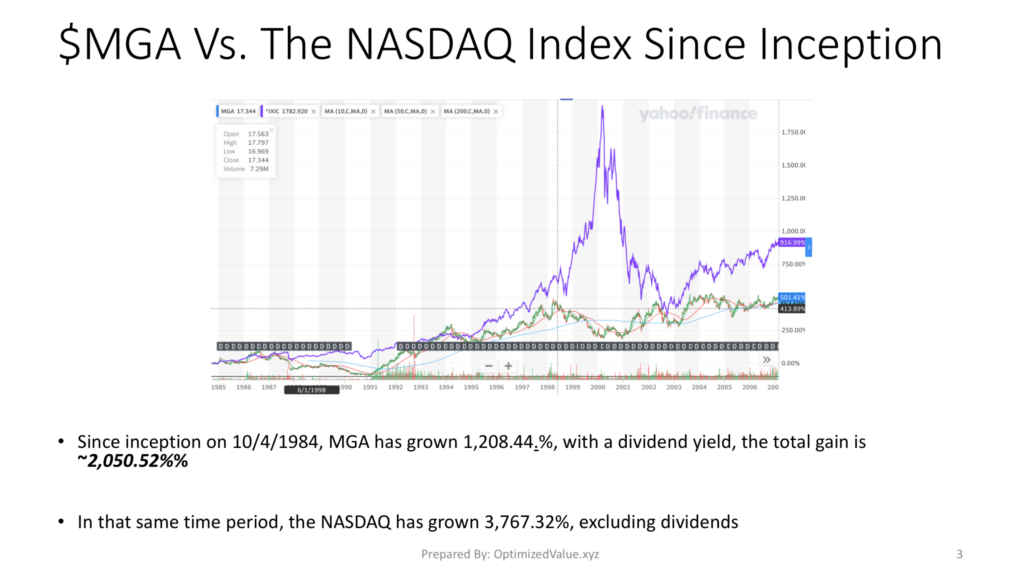
Magna International $MGA Stock Vs. The S&P 500 & NASDAQ Indexes
Since they began being traded on 10/4/1984, MGA stock has increased by 1,208.44%.
When you factor in their historic dividend yields, that figure comes out closer to 2,050.5% in gains.
During that same time period, the S&P 500 has only posted 1,769.5% gains, excluding dividends.
The NASDAQ in that time has grown by 3,767.32%, excluding dividends.
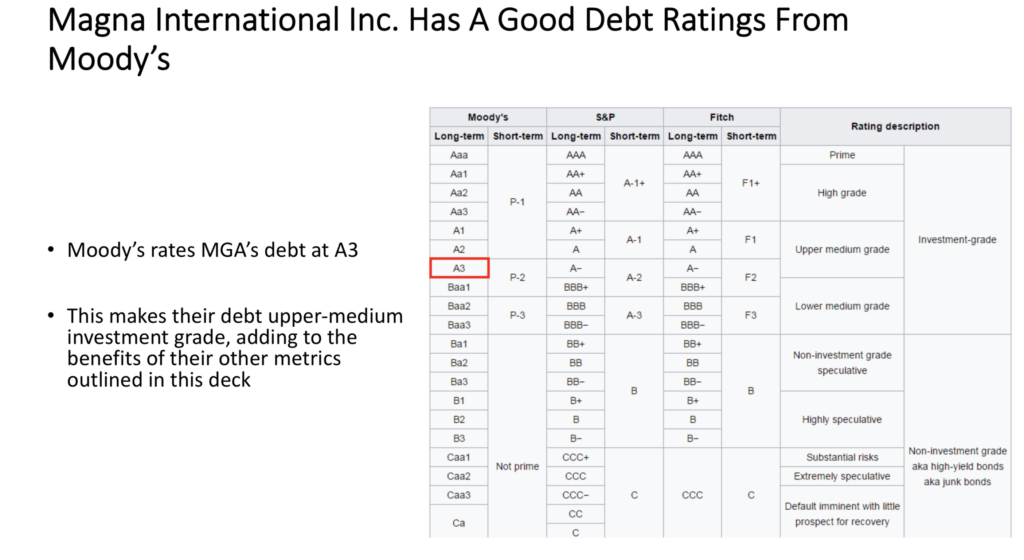
Magna International $MGA Has A Solid Debt Rating
MGA is rated A3 at Moody’s which is Upper-Medium Grade Investment Level Debt. This is becoming more and more important, as many businesses are under increasing distress due to 2020’s market turbulence.
Tying It All Together
I have owned Magna previously, and loved it for its fundamentals. I am beginning to revisit them due to their strength of business, safe dividend yield, and growth potential.
I plan to begin rebuilding a long position in MGA over the coming weeks, but my entry point will be dependent upon external market conditions as the week progresses.
For Full Report:
*** I do not currently own MGA, although I am beginning to look at their stock for an eventual entry ***