Gannet Co. stock trades under the ticker GCI & has recently shown a 25% increase in price.
GCI stock closed at $5.52 on 7/21/21, completing a Bullish MACD crossover on higher than normal volume after a sturdy 3 day climb in price.
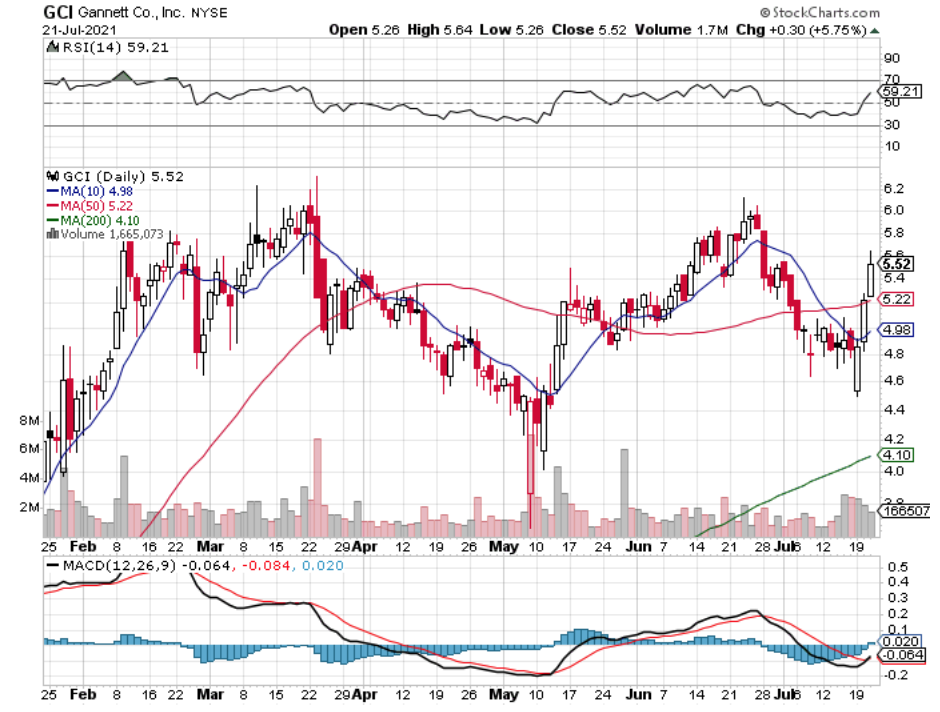
GCI Stock Price: $5.52
10 Day Moving-Average: $4.98
50 Day Moving-Average: $5.22
200 Day Moving-Average: $4.10
RSI: 59.21
MACD: -0.064
GCI’s 10 Day Moving-Average is ~4% shy of their 50 Day Moving-Average, which when combined with their RSI of 59 shows that they still have room to climb higher.
There is resistance around the $5.95-6 range, but all technical indicators are looking strong for continued price growth.
Gannet’s option strike prices are at-the-money at $5 calls & puts, with the other options having $2.50 & $7.50 strike prices.
I am looking at the 10/15/21 expiration call options today, as they have dropped a bit in price in the pre-market so at-the-money calls will be cheaper.
It is unlikely that they will climb the 50% needed in that time to make the $7.50 options in-the-money.
Overall, Gannet Co’s stock looks to have some great short-term trade opportunities.
*** I DO NOT OWN SHARES OF GCI STOCK ***