Haverty Furniture Companies, Inc. stock trades under the ticker HVT.
HVT stock has many interesting opportunities based on their fundamentals from an investing standpoint, as well as their recently technical performance for a trade opportunity.
Haverty Furniture Companies, Inc. HVT Stock Fundamentals Broken Down
HVT stock closed at $24.02 on 10/9/2020, with a PE (ttm) of 16.8 & a P/B of 1.71.
In addition to this, their 3.32% Dividend Yield is very attractive, and their 20.6% Payout Ratio sweetens the deal, as it shows safety & stability in their yield over the long-term.
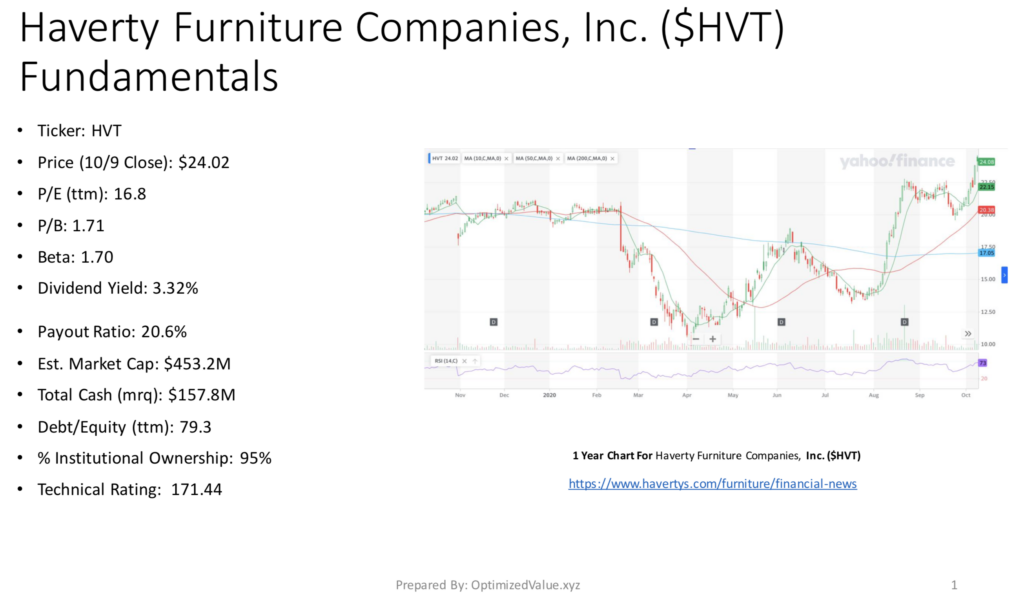
Their Debt/Equity (ttm) is 79.3, which also is appealing in the eyes of a longer-term focused investor.
Haverty Furniture Companies is a small cap stock, with a Market Cap of $453.2M, which is also in part of why their Total Cash (mrq) is $157.8M.
Despite this, they have 95% % Institutional Investors, which is higher than many of the other small cap stocks we have covered on this site.
Haverty Furniture Companies, Inc. HVT Stock Technical Performance
Haverty Furniture Companies, Inc. stock has also performed very well in the past year from a technicals perspective.
Looking at their one year chart:
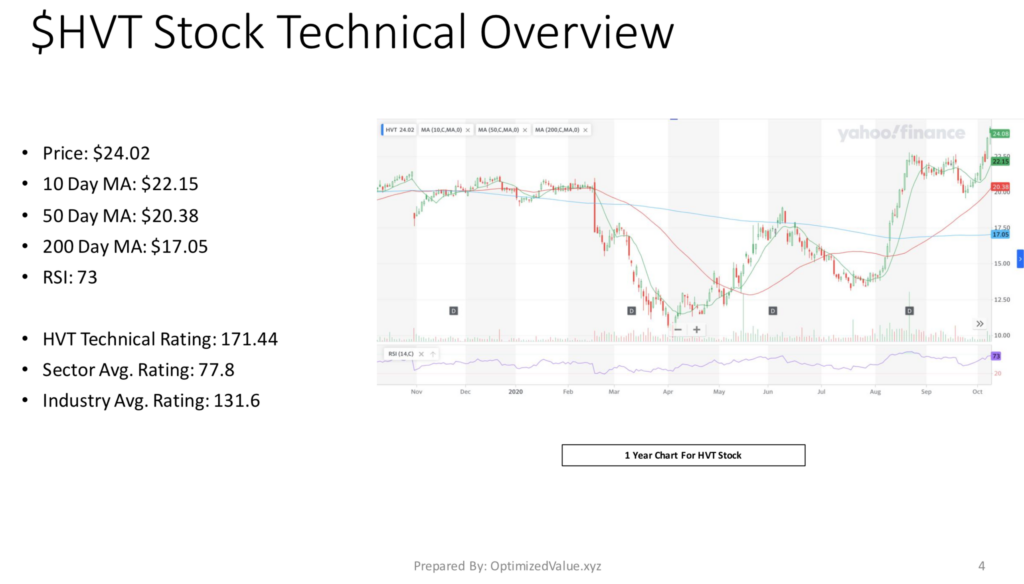
HVT Price: $24.02
10 Day Moving-Average: $22.15
50 Day Moving-Average: $20.38
200 Day Moving-Average: $17.05
RSI: 73
Technical Rating: 171.44
HVT stock’s moving averages all show continued strength, and their Technical Rating is much higher than their sector & industry averages (77.8 & 131.6).
From a trading perspective, there may be many opportunities here as well, as the strength looks to be something that can be capitalized on in the short-term as well as the long-term.
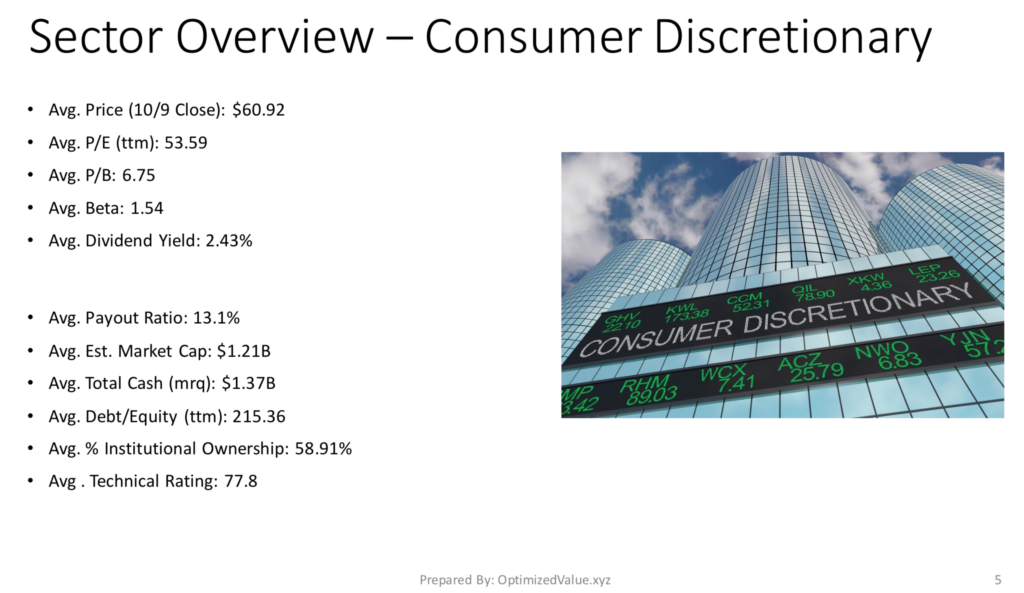
Haverty Furniture Companies, Inc. HVT Stock Fundamentals Compared To The Consumer Discretionary Sector Averages
HVT stock’s P/E (ttm) is 68.7% lower than the average for Consumer Discretionary sector stocks, and their P/B is almost 75% better than average.
HVT’d Dividend Yield is 36.6% higher than average, and despite their Payout Ratio being 57% higher than average, it is still low enough to be considered safe & sustainable.
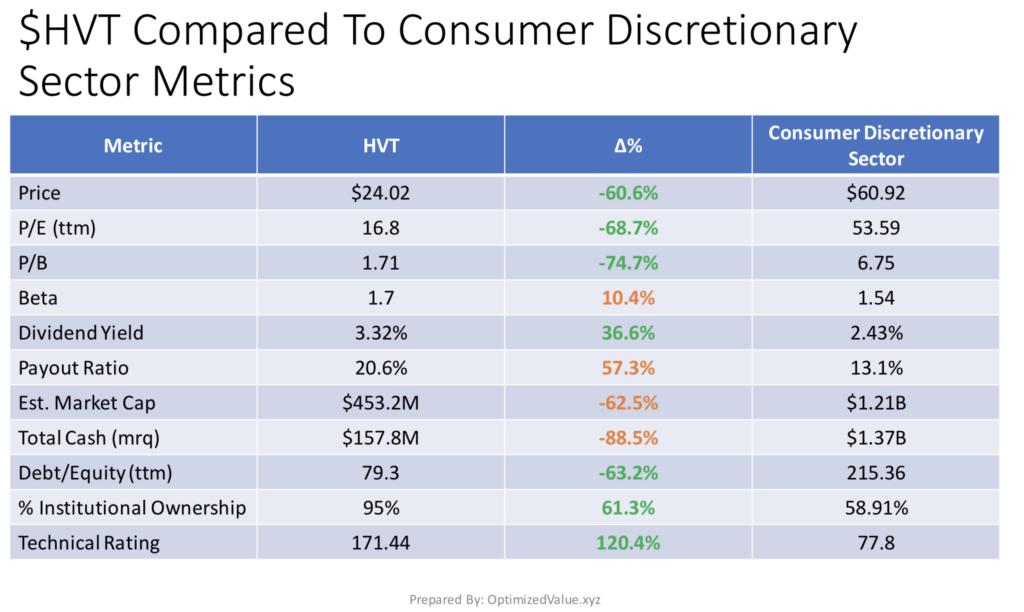
HVT’s Market Cap is 62.5% less than average for the Consumer Discretionary sector, and their Total Cash is 88.5% lower than average.
However, their Debt/Equity (ttm) is 63.2% less than average, which contributes to the 61.3% higher than average % Institutional Ownership.
From a trading perspective, their Technical Rating is 120.4% better than average for the sector.
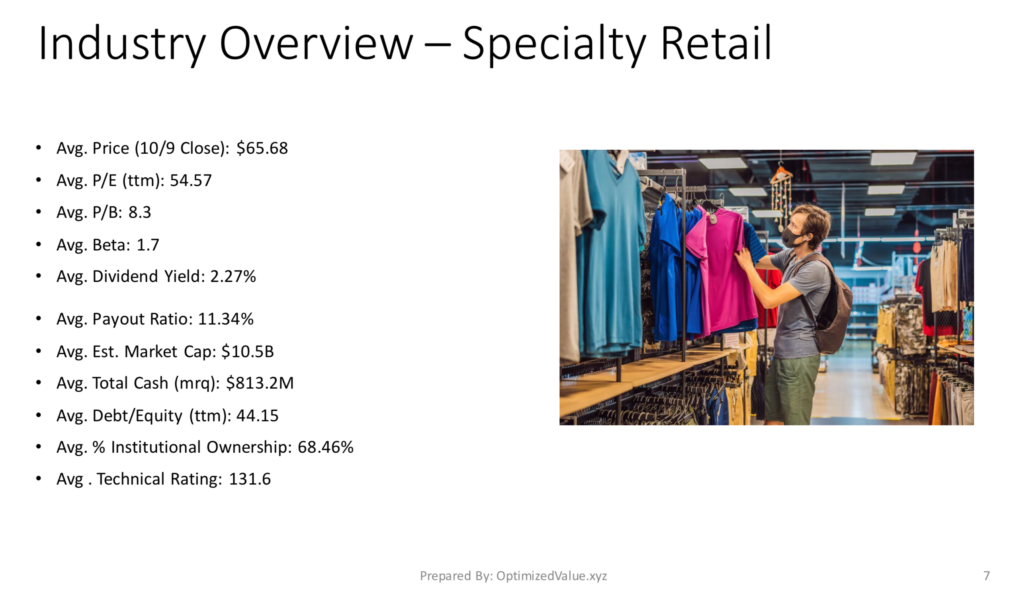
Haverty Furniture Companies, Inc. HVT Stock Fundamentals Vs. The Specialty Retail Industry Averages
HVT stock also has strong fundamental advantages vs. the Specialty Retail sector stock averages.
HVT’s P/E (ttm) is 69.2% lower than average, and their P/B is 79.4% better than average.
HVT’s Dividend Yield is 46.3% better than the industry average, and they have a 38.8% higher than average % Institutional Ownership.
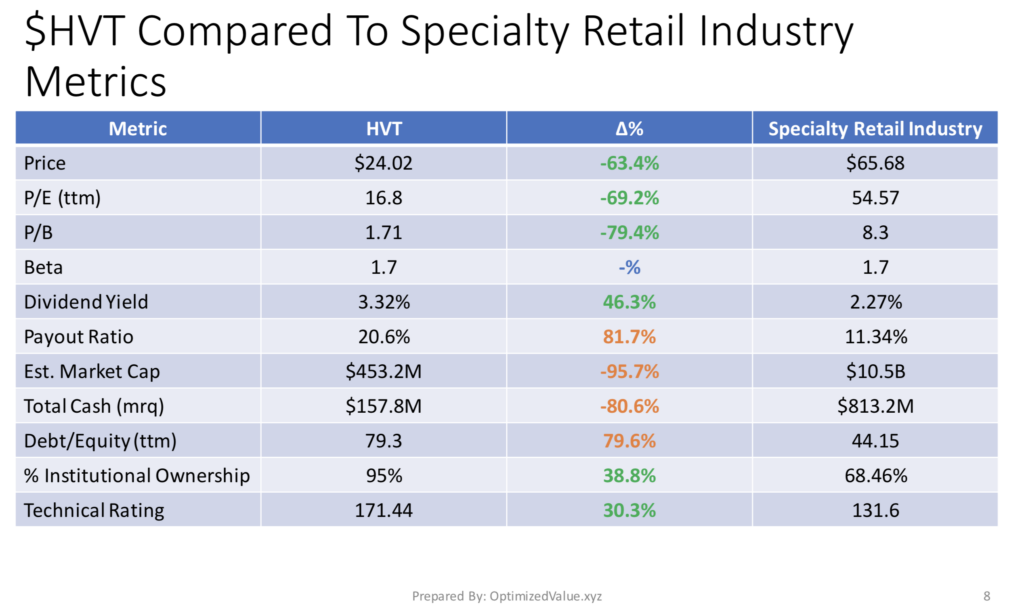
HVT’s Market Cap is 95.7% lower than industry average, and their Total Cash (mrq) is ~81% lower than average.
Their Debt/Equity (ttm) is 79.6% lower than average as well, but they still present a solid case for a long-term investment.
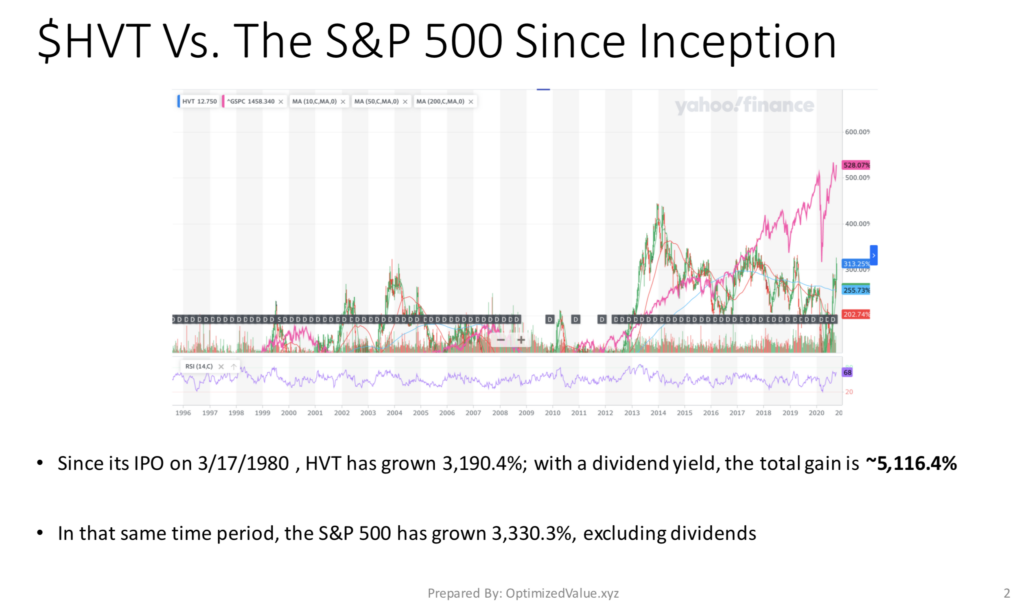
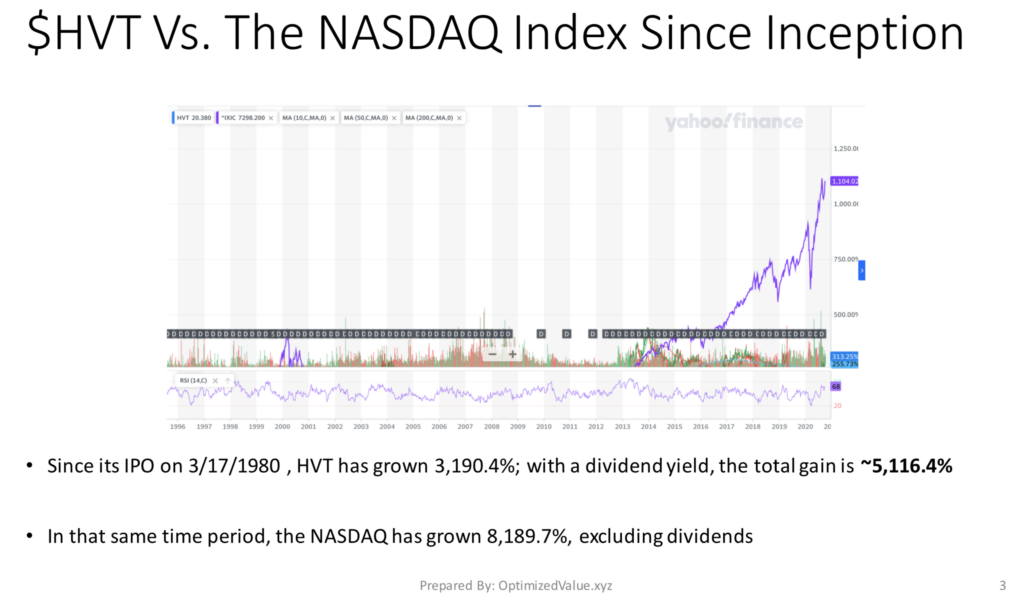
Haverty Furniture Companies, Inc. HVT Stock Performance Vs. The S&P 500 & NASDAQ Indexes
Haverty Furniture Companies, Inc. stock has performed very strongly since their IPO on March 17th, 1980.
Their stock price has increased 3,190.4%, and when you factor in their Dividend Yield they’ve grown 5,116.4% in total.
In that time the S&P 500 has grown 3,330,3%, excluding dividends.
The NASDAQ has grown 8,189.7% in that same time period excluding dividends.
This solid historic performance makes them a prime candidate to be a conservative investment in a portfolio, looking to grow steadily, while also providing a dividend payment.
Tying It All Together
Overall, Haverty Furniture Companies, Inc. HVT Stock presents many interesting opportunities for short-term traders & long-term investors alike.
Their technical strength puts them in prime position to be looked at from a short-term trade perspective, especially when compared to their sector & industry peers.
Their long-term strength & growth, as well as the rest of their fundamentals are also very appealing to a long-term investor who is looking for a 3%+ yield stock as part of their portfolio.
*** I DO NOT OWN SHARES OF HVT STOCK ***