Houlihan Lokey, Inc. stock trades under the ticker HLI & has shown recent bullish signals that traders & investors should research further into, in anticipation of when market conditions become less rangebound.
HLI stock closed at $89.00/share on 5/30/2023.
Houlihan Lokey, Inc. HLI Stock’s Technical Performance Broken Down
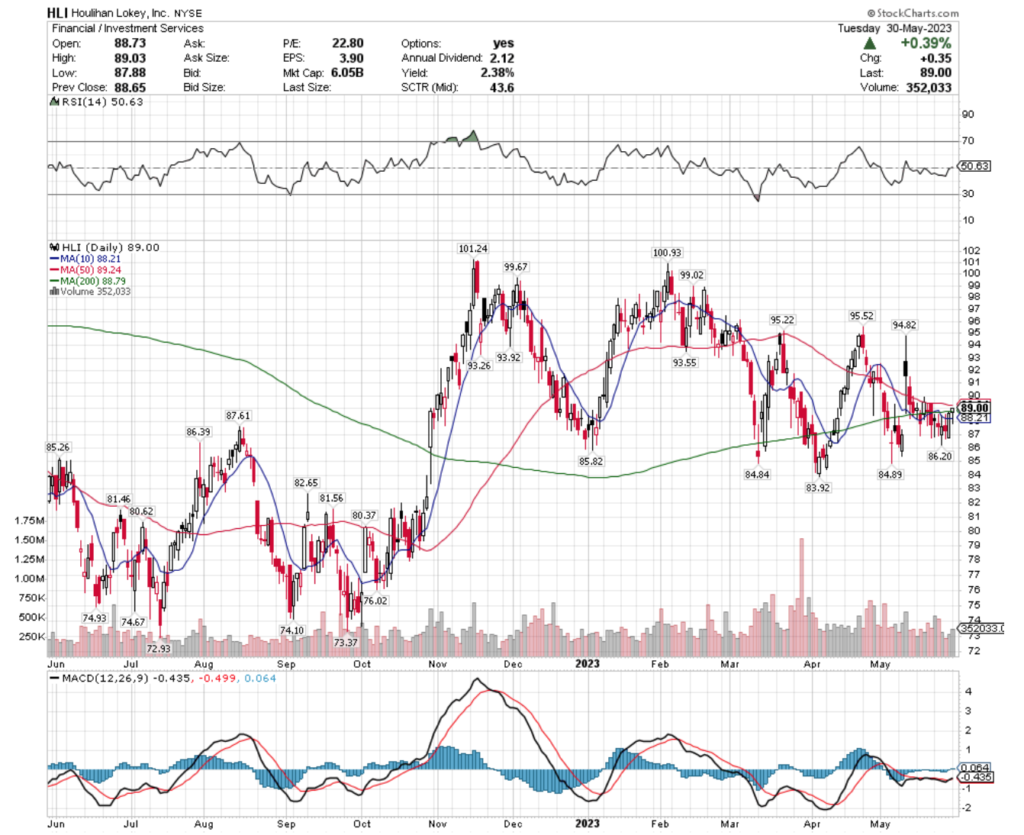
HLI Stock Price: $89.00
10 Day Moving Average: $88.21
50 Day Moving Average: $89.24
200 Day Moving Average: $88.79
RSI: 50.63
MACD: -0.435, -0.499, 0.064
Yesterday, HLI stock completed a bullish MACD crossover, gaining +0.39% on the day’s session.
Their RSI is neutral at 50.63 & recent trading volumes have been about average compared to the year prior.
Given how markets have been stuck in a range for the past month, investors would be best suited to watch how they behave around support levels & wait to make a move on HLI until they are in a non-sideways trend again.
HLI stock has support at the $88.21 (10 day moving average; Volume Sentiment: Sellers, 1.33:1), $87.61 (Volume Sentiment: Buyers, 1.14:1), $86.39 (Volume Sentiment: Sellers, 1.68:1) & $86.20/share (Volume Sentiment: 1.68:1) price levels, with resistance at the $89.24 (50 day moving average; Volume Sentiment: Sellers, 10.75:1), $93.26 (Volume Sentiment: Sellers, 2.07:1), $93.55 (Volume Sentiment: Sellers, 2.07:1) & $93.92/share (Volume Sentiment: Sellers, 2.07:1) price level.
Houlihan Lokey, Inc. HLI Stock As A Long-Term Investment
Long-term oriented investors will like HLI stock’s 23.53 P/E (ttm), but may find their 3.95 P/B (mrq) to be a bit too rich.
Before investing, investors may want to look deeper into their recently reported -5.6% Quarterly Revenue Growth Y-o-Y, with -8.5% Quarterly Earnings Growth Y-o-Y.
Their balance sheet looks strong, with $714.44M of Total Cash (mrq) & $374.87M of Total Debt (mrq).
HLI stock pays a 2.39% dividend, but investors should make sure that they are able to cover it in the long-term sustainably, as their payout ratio is 53.27%.
98.47% of HLI stock’s outstanding share float is owned by institutional investors.
Houlihan Lokey, Inc. HLI Stock As A Short-Term Trade Using Options9
Traders with shorter time horizons can trade options to profit from HLI stock’s price movements, while protecting their portfolios from volatility.
I am looking at the contracts with the 6/16 expiration date.
There are currently no in-the-money call options for this expiration date.
The $90, $95 & $100 puts are all in-the-money, listed from highest to lowest level of open interest.
Tying It All Together
HLI stock has many interesting attributes that traders & investors will find appealing.
Investors will like their balance sheet & dividend yield, but may want to look into their recent growth metrics, before investing once markets have broken out of the recent sideways trend.
Traders will like their recent technical performance, but will dislike how illiquid their options are.
All-in-all, it is worth taking a closer look into HLI stock to see how it fits into your portfolio strategy.
*** I DO NOT OWN SHARES OR OPTIONS CONTRACT POSITIONS IN HLI STOCK AT THE TIME OF PUBLISHING THIS ARTICLE ***