Janus Henderson Group PLC trades under the ticker of JHG, and offers opportunities for both short-term traders & long-term investors.
JHG stock closed for trading at $28.13 on 10/16/2020, after showing lots of technical strength in the month of October.
Let’s break down Janus Henderson Group PLC’s stock further.
Janus Henderson Group PLC JHG Stock Fundamentals Broken Down
JHG stock is a bit unlike most of the stocks I review on this section of the site, with a P/E (ttm) of 74, but it does sport a P/B of 1.16 & a Dividend Yield of 5.11%.
This Dividend looks relatively safe, as their Payout Ratio is 66.2%.
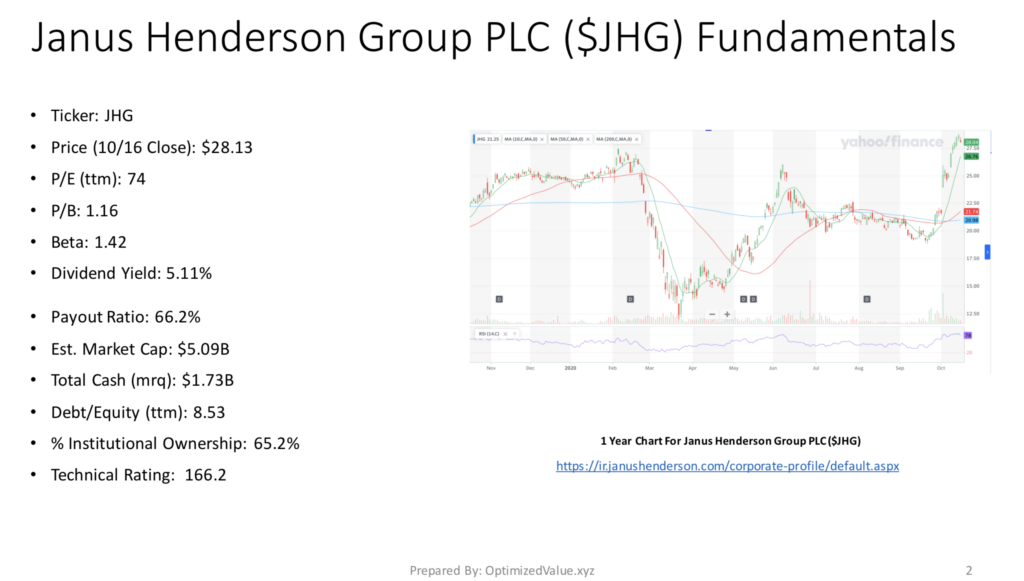
JHG’s Market Cap is $5.09B, and their Total Cash (mrq) is $1.73B.
While their Beta is 1.42, the stock itself has only been trading for a few years.
One of the most interesting things about JHG’s stock, is that their Debt/Equity (ttm) is only 8.53, which likely is why they have a 65.2% % Institutional Ownership.
Their Technical Rating is 166.2, which is also a great sign.
Janus Henderson Group PLC JHG’s Stock Technical Performance
Janus Henderson Group’s stock has had an impressive October performance.
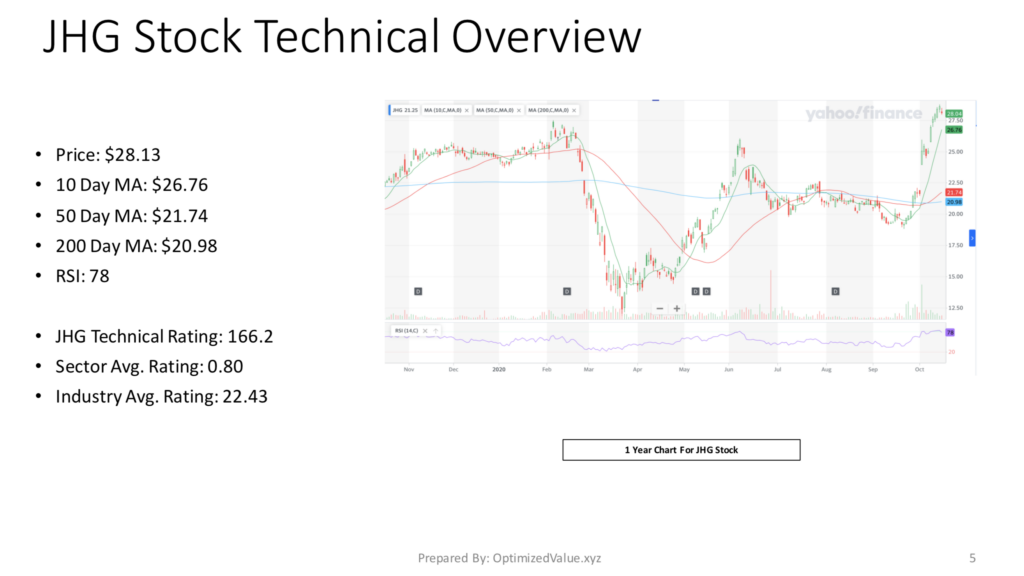
JHG Stock Price: $28.13
10 Day Moving-Average: $26.76
50 Day Moving-Average: $21.74
200 Day Moving-Average: $20.98
RSI: 78
This strength is surely attractive to short & medium term traders, although it may be reason for longer-term investors to wait for a more attractive entry point.
JHG stock also has options, making it easier for traders to benefit from price movement in either direction.
Janus Henderson Group’s stock also outperforms most of its peers:
JHG Technical Rating: 166.2
Financials Sector Avg. Rating: 0.80
Capital Markets Industry Avg. Rating: 22.43
Janus Henderson Group PLC JHG’s Stock Fundamentals Vs. The Financials Sector
JHG’s stock offers many advantages over their Financials Sector peers.
JHG’s P/B is almost 73% lower than the financials sector average, with a 13% above average Dividend Yield, supported by a Payout Ratio that is .93% less than the sector average.
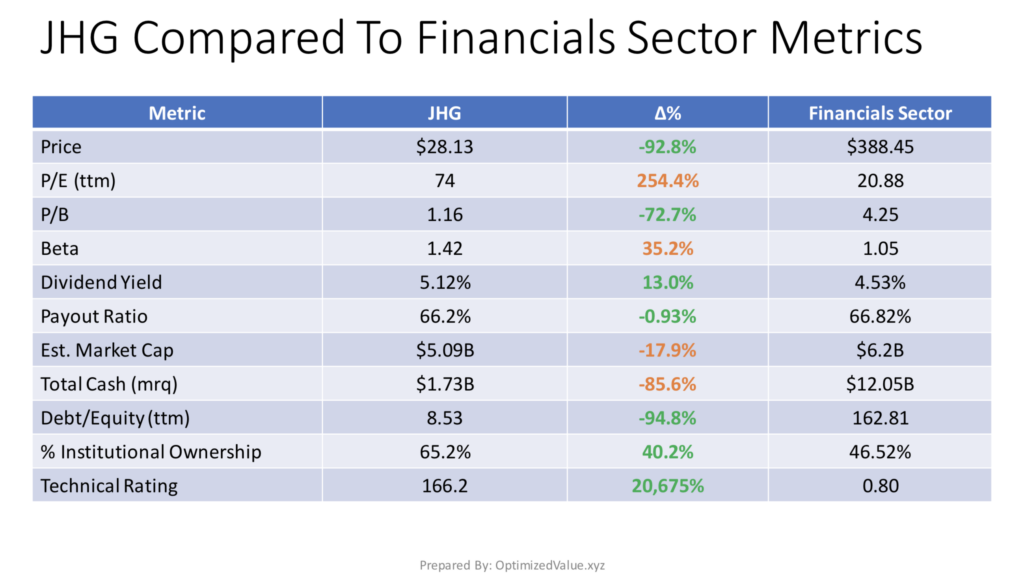
JHG’s Debt/Equity (ttm) looks even more attractive when compared with the fianncials sector average.
JHG’s is ~95% less than the sector average, with a 40.2% higher than average % Institutional Ownership and an astounding 20,675% better than average Technical Rating.
There are a few things to be concerned about though for investors, including their P/E (ttm) that is 254.4% higher than the sector average for financials stocks & their 35% higher than average Beta.
Their Market Cap is almost 18% lower than average, which justifies their Total Cash (mrq) being ~86% below average.
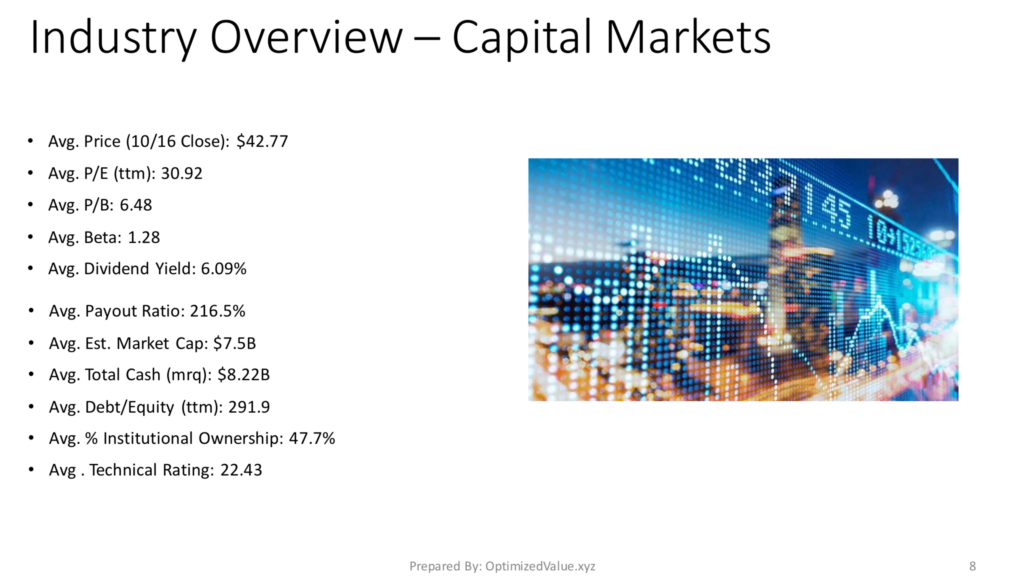
Janus Henderson Group PLC JHG’s Stock Fundamentals Vs. The Capital Markets Industry Averages
Janus Henderson Group’s stock also looks very attractive when compared with the Capital Markets Industry average fundamentals.
JHG’s P/B is 82% lower than average, and their Payout Ratio is ~69% less than average.
JHG’s Debt/Equity (ttm) is 97% lower than their average Capital Markets Industry peer, contributing to their ~37% higher than average % Institutional Investors.
JHG’s Technical Rating is 641% better than average for their industry as well.
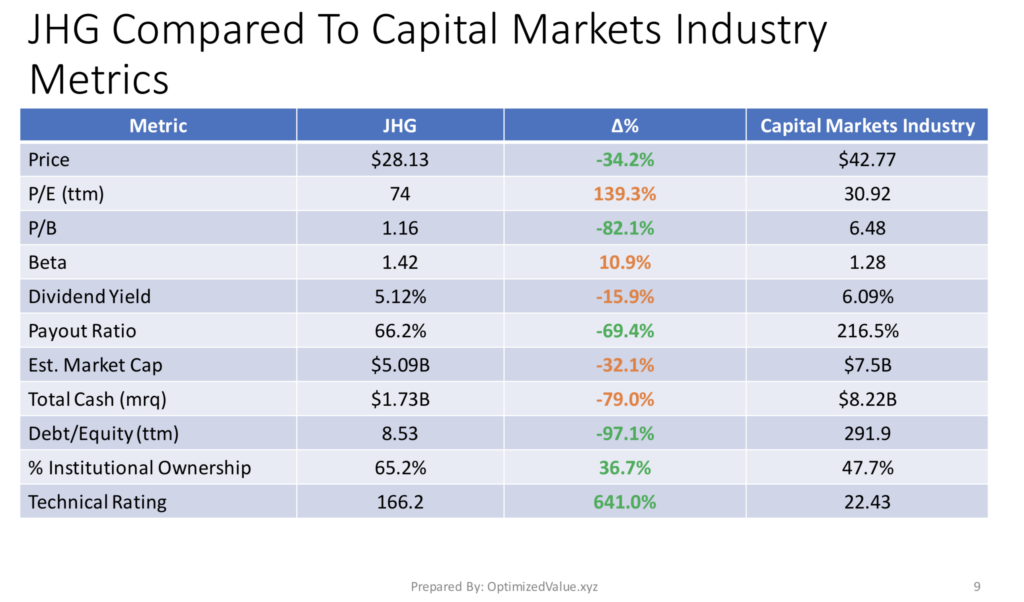
Many of the same troubles that they had vs. their sector peers are the same for their industry.
JHG’s P/E (ttm) is 139% higher than average for the Capital Markets Industry, and their Dividend Yield is ~16% lower than average.
JHG stock’s Market Cap is 32% less than average, and their Total Cash (mrq) is 79% less than average for the Capital Markets Industry.
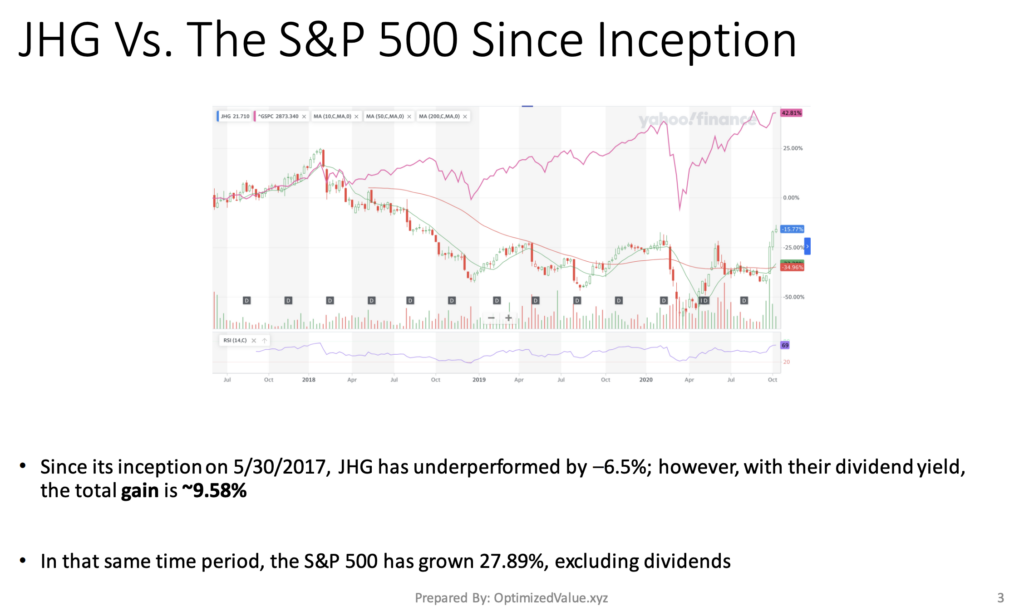
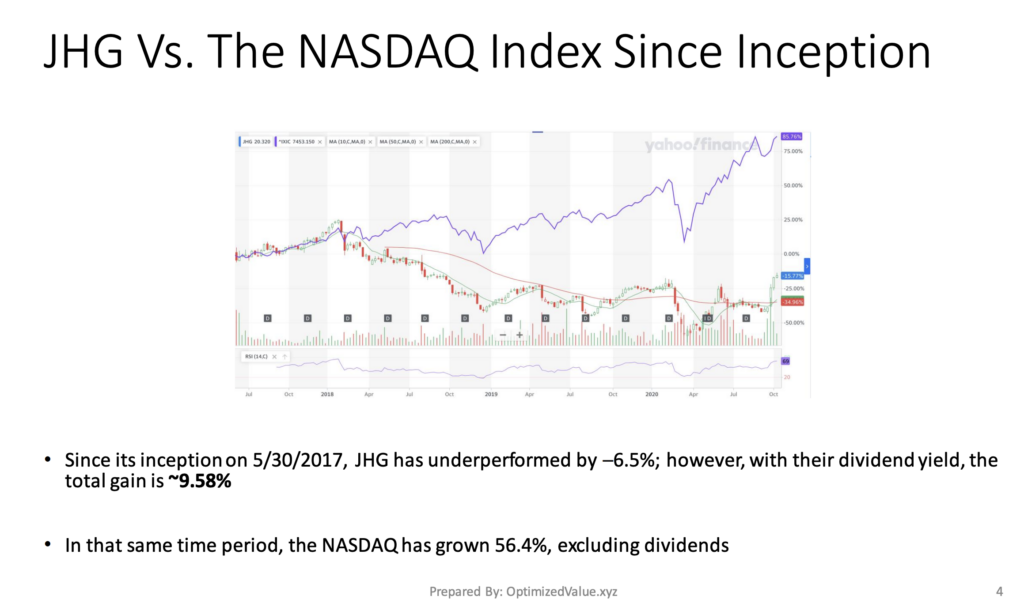
Janus Henderson Group PLC JHG’s Stock Performance Vs. The S&P 500 & NASDAQ Indices
The historic data I referenced began tracking JHG’s performance on 5/30/2017.
One issue that investors may have is that since their inception, the stock itself has declined 6.5%.
However, when you factor in the dividends that investors would’ve collected, they have actually grown by 9.58%.
The S&P 500 has grown by 27.89% in that time period, excluding dividends collected.
JHG’s stock has also underperformed the NASDAQ in that time period, as the NASDAQ Index has grown 56.4%, excluding dividends.
To some investors this may be troubling, but the 5%+ yield should be able to win them over, using JHG as part of a balanced portfolio.
Janus Henderson Group PLC JHG’s Stock Credit Rating From Moody’s
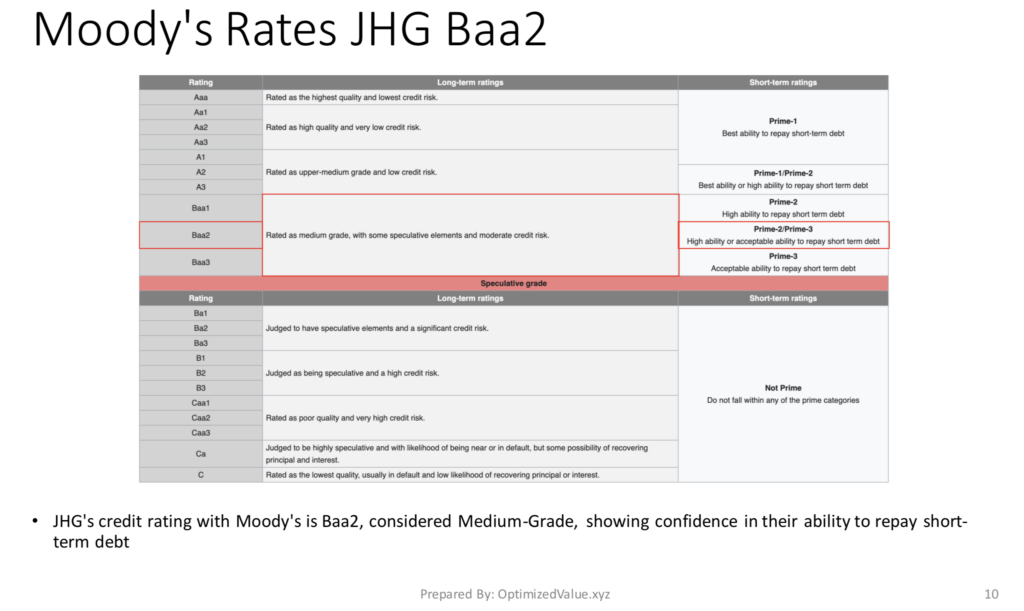
Moody’s rates JHG’s credit as Baa2, a medium grade rating, meaning that JHG should be able to repay any and all short term debt relatively easily.
This is important, particularly in times like early 2020 where the market has been less forgiving to stocks with higher amounts of debt.
Combined with their Debt/Equity (mrq) this is a sign that investors like to see.
Tying It All Together
Janus Henderson Group’s stock has shown signals that appeal to both short & mid-term traders, as well as for longer term investors.
Their 5%+ Dividend Yield is especially attractive in times of economic uncertainty caused by the pandemic, and their Debt/Equity (mrq) is also highly appealing.
JHG stock’s technical performance should appeal to traders as well.
Whether or not you’re looking for a short-term trade, or a long-term investment, Janus Henderson Group is certainly worth taking a deeper look.
*** I DO NOT OWN SHARES OF JHG Stock ***
For Full PDF Report: