This weekend I had a look at PetMed Express Inc. stock, which trades under the ticker $PETS. PETS closed at $37.99/share on Friday 7/10, with the P/E (ttm) of 29.4 and a P/B of 6.01. They offer an attractive Dividend Yield of 4.47%.
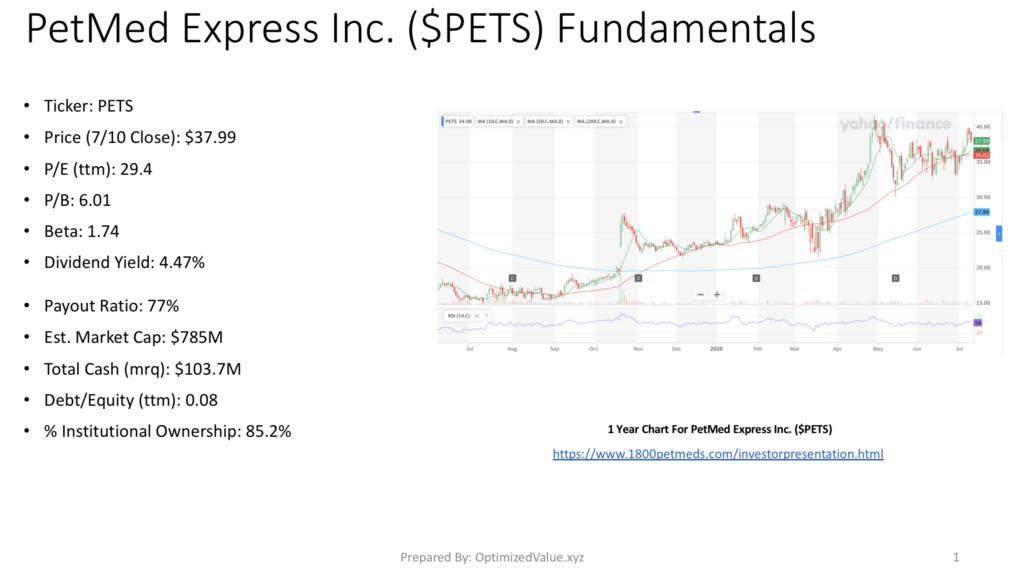
PETS is a small cap stock, with a Market Cap of $785M, with $103.7M in Total Cash, and a low Debt/Equity (ttm) of 0.08. These fundamentals & their growth have led them to an 85.2% % Institutional Ownership, despite their small cap size.
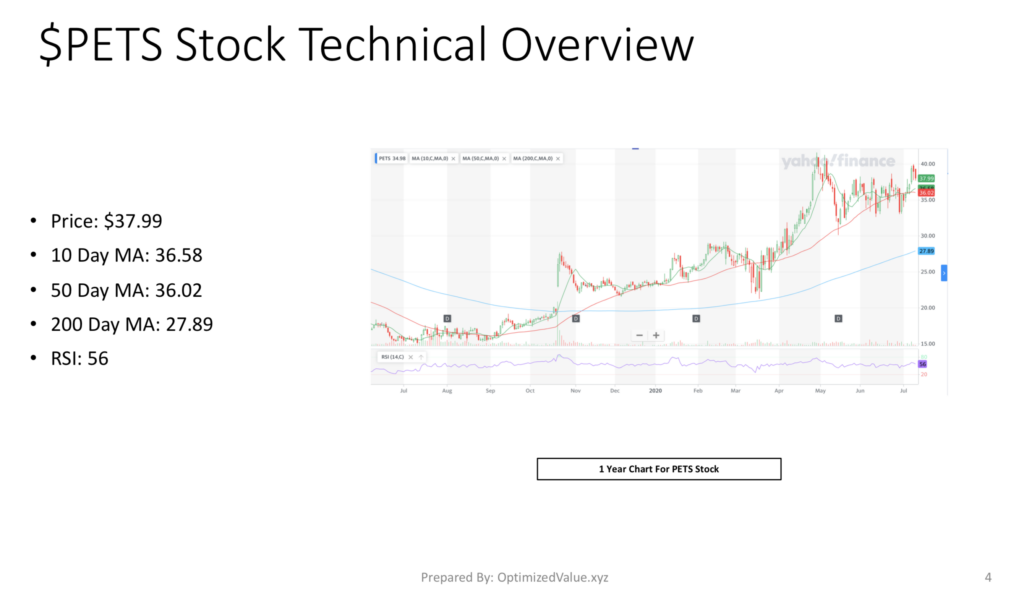
PetMed Express Inc. PETS Stock Technical Analysis
PetMed Express Inc. Stock has a 10-Day Moving Average of 36.58, with a 50-Day MA of 36.02 & a 200-Day MA of 27.89.
This signals technical strength, and their RSI of 56 shows that they are not overbought yet, and implies future growth.
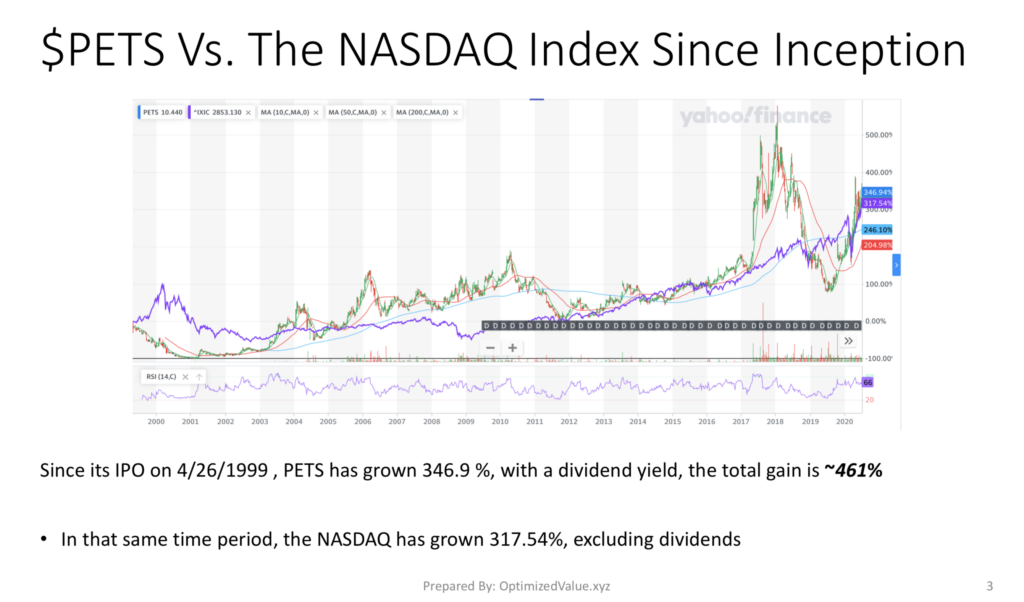
PetMed Express Inc. PETS Stock Vs. The S&P 500 & NASDAQ Indexes
Since their IPO on 4/26/1999, PetMed Express Inc. PETS Stock has grown by 346.9%, and when we combine their historic dividend yield they have grown by 461% since their IPO.
The S&P 500 has only grown 138.55% & the NASDAQ Index has grown by 317.54% in that same time, excluding their dividends.
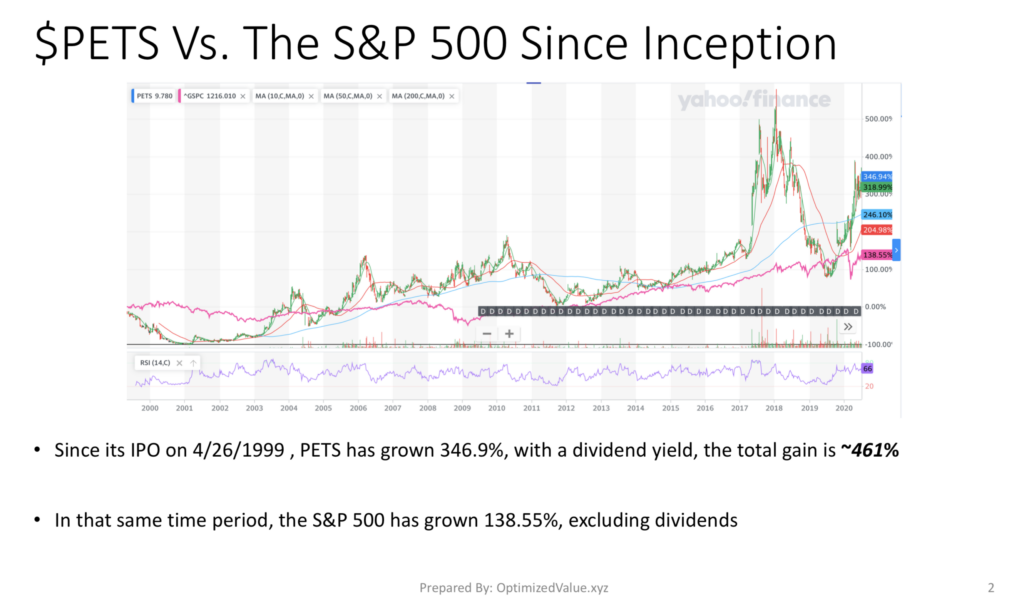
This shows that their growth outpaces the indexes, despite their small cap status.
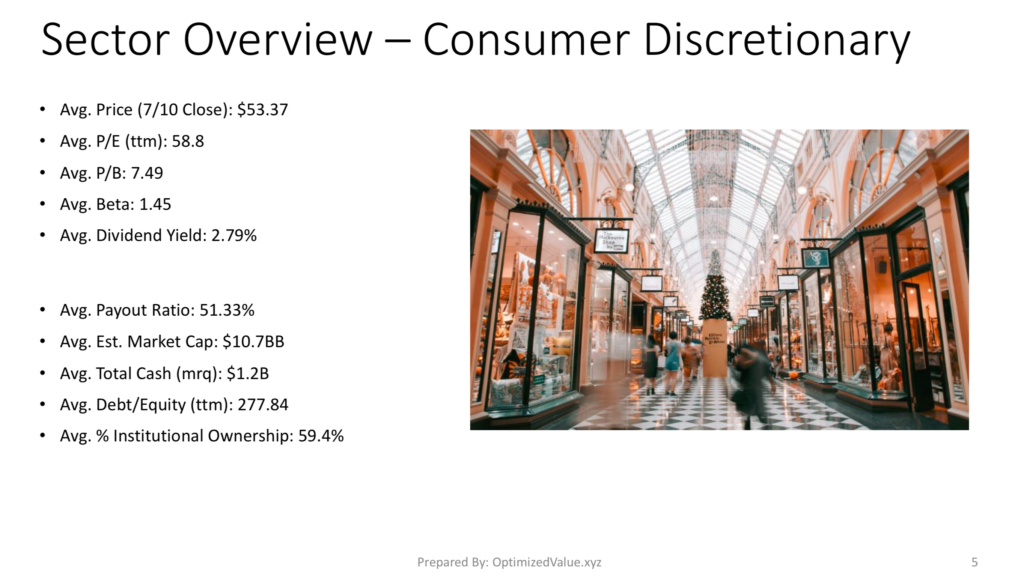
PetMed Express Inc. PETS Stock Fundamentals Vs. The Consumer Discretionary Sector
PetMed Express Inc. PETS is a member of the Consumer Discretionary Sector. Their shareprice is 29% lower than the average Consumer Discretionary stock share price, and their P/E (ttm) is 50% less than average, with a 20% less than average Price/Book, signaling fundamental strength.
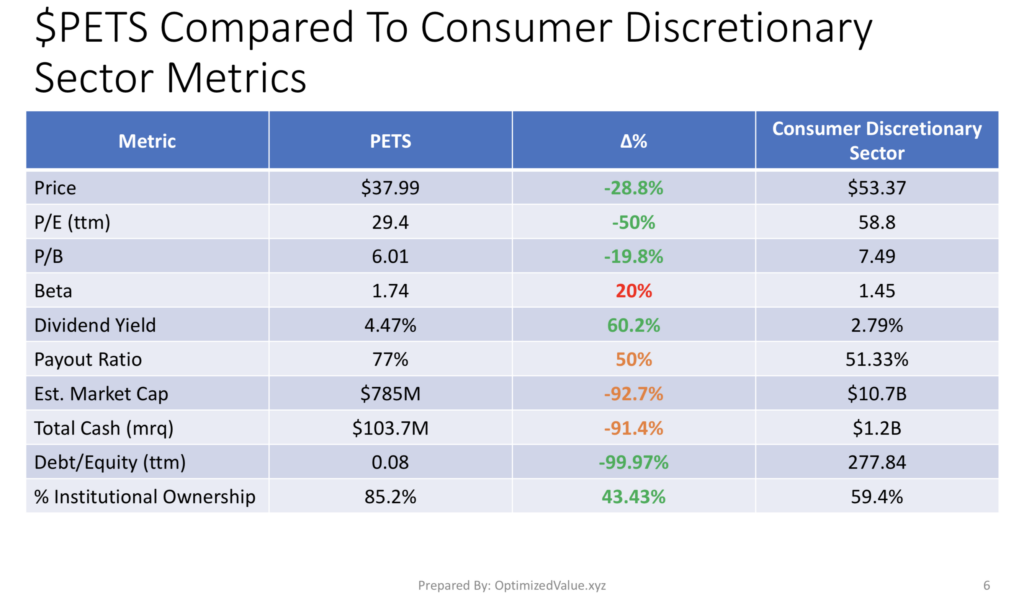
PETS Stock offers a 60% higher Dividend Yield than the average Consumer Discretionary stock, despite being 93% smaller than their average peer within this sector.
Much of this is attributed to their 99.97% lower than average Debt/Equity (ttm), which helps attract their 43% higher than average % Institutional Ownership.
While their Payout Ratio is 77% and is 51% higher than average, they still offer many strengths compared to their Consumer Discretionary Sector peers.
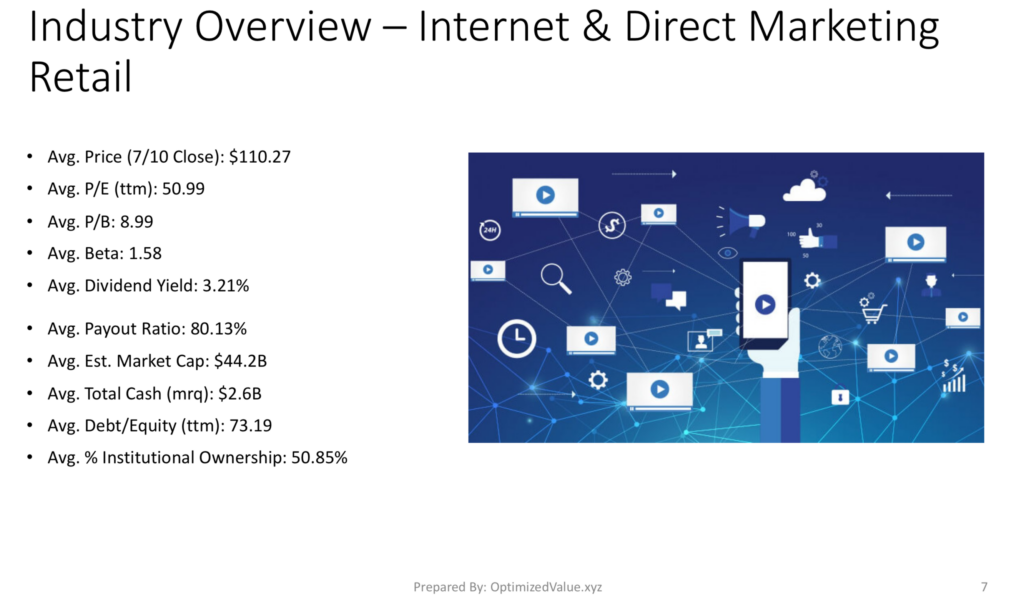
PetMed Express Inc. PETS Stock Fundamentals Vs. The Internet & Direct Marketing Industry
PETS Stock costs 66% less per share than the average Internet & Direct Marketing Industry average, with a 42% lower P/E (ttm) & a 33% lower P/B. When compared with their 39% above average Dividend Yield, their fundamentals look very attractive compared to their peers.
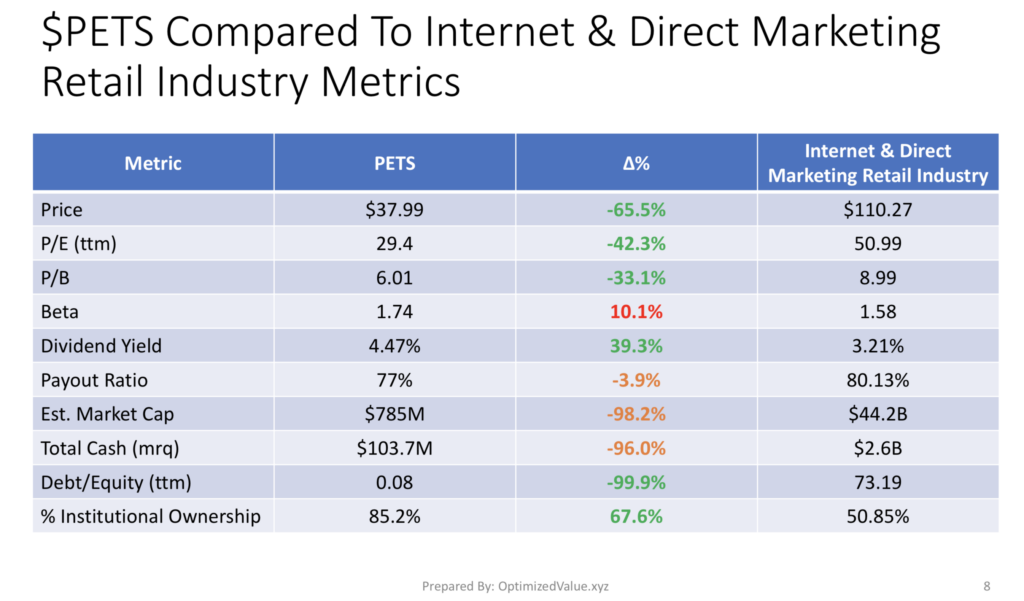
Their Payout Ratio is only 4% higher than their industry peers, despite being 98% smaller than average by Market Cap.
Despite this, their Debt/Equity (ttm) is 99.9% less than average & as a result of this and their strong fundamentals & growth performance PETS has a 68% higher than average % Institutional Investors than their average Internet & Direct Marketing Industry peer.
Tying It All Together
PETS stock has many attractive fundamental & technical advantages to other stocks, including their Sector & Industry peers. Despite their higher than preferred Pay Out Ratio, they offer a healthy Dividend Yield, and due to their very low Debt/Equity (ttm) this does not look to be threatened.
Their technical strength of their charts also has me interested in looking for an entry point somewhere in the coming days-to-weeks, especially in the current market conditions where stocks with good cash:debt ratings & NASDAQ stocks tend to be performing best.
*** I do not own any shares of PETS ***
For Full PDF Report: