Since our last check in on SPY, QQQ, IWM & DIA’s Price Level:Volume Sentiment markets have seen an uptick in volatility & descended ~4-5% from their recent 52-week highs (all-time highs for 3 of the 4, IWM being the exception).
While there have been a few bullish days this week, the trend of increased volatility looks to continue, particularly as we are in earnings season & experiencing geo-political tensions that are higher than they’ve been in the past year.
With this in mind, the article below outlines the Buyer:Seller (or Seller:Buyer) sentiment at the various price levels that SPY (S&P 500), QQQ (NASDAQ 100), IWM (Russell 2000) & DIA (Dow Jones Industrial Average) ETFs have traded at over the past few years to gain insight into how market participants may feel at different support & resistance levels.
Each section below contains a view of each index ETF’s chart (for a technical breakdown of each ETF’s chart please see this past weekend’s market review note), as well as a list of their current one year support & resistance levels with the volume sentiment noted beneath it on the table.
There is an additional table beneath this table with each price level’s sentiment, as well as a typed text version below that is able to be copied & pasted.
Note that “NULL, 0:0*” values denote areas that each name has traded at but with limited volume data to work with from a comparison standpoint in terms of creating a ratio of buyers:sellers (or vice versa).
Also, prices that do have a ratio of buyers:sellers (or vice versa) where the denominator is 0 are denoted with an asterisk “*” as well.
In the written lists of the price levels & volume sentiments the price levels that contain support & resistance levels are marked in BOLD.
Recall that at price extremes such as the highs that we have recently hit there will tend to be skewed data due to the small sample size & factor that into how you interpret each price level’s sentiment.
This is intended to serve as an additional tool to use during your due diligence process & is not meant to replace doing your own research & is not financial advice.
Also, captions & images are not aligned due to a JavaScript issue, apologies for the inconvenience & working on a solution to fix it.
Price Level:Volume Sentiment Analysis For SPY (S&P 500) ETF
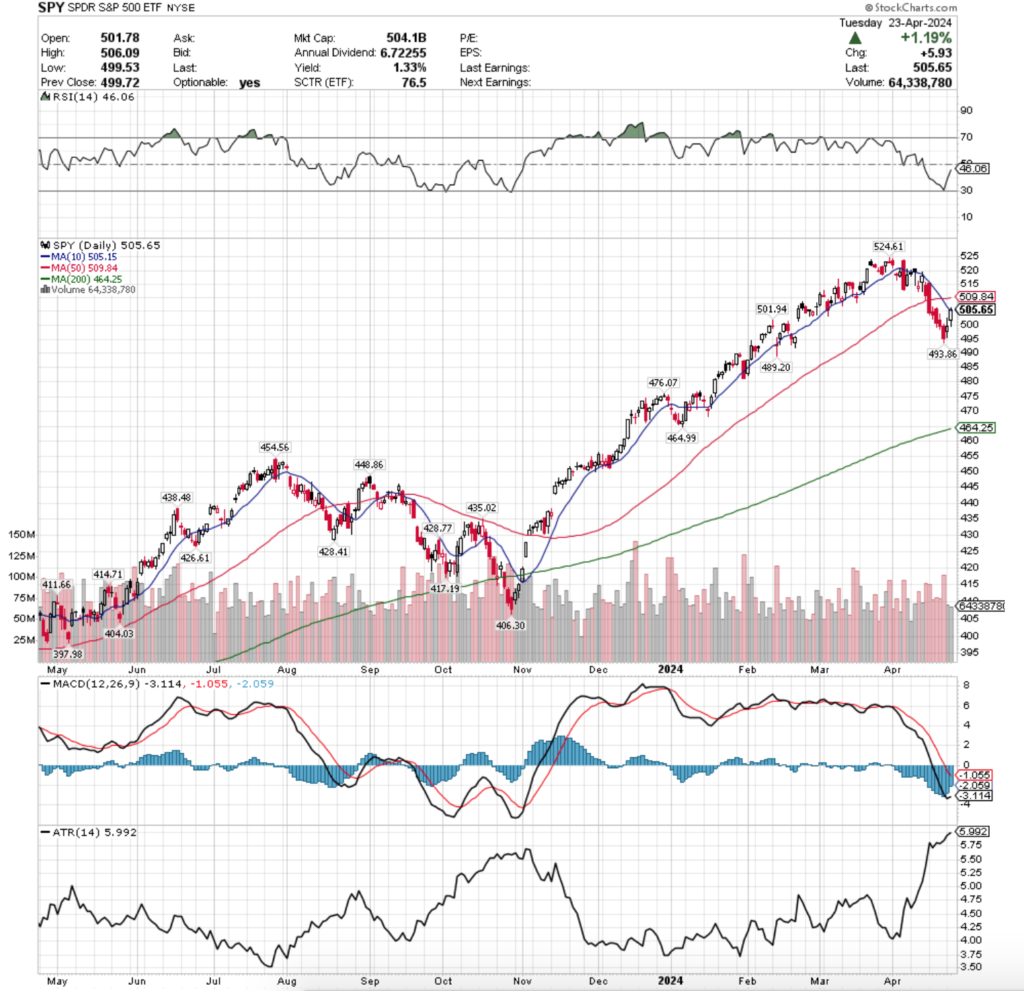
SPY, the SPDR S&P 500 ETF has recently fallen from a new all-time high in the wake of increased volatility & looks set to continue cooling down in the coming week(s).
With limited support levels due to the rapid ascent of its price between late October 2023 & March of 2024 it is important to have an understanding of how market participants have behaved at the price levels that will be serving as support.
Below is a list of the price levels with the volume sentiment each has traded at over the past 2-3 years.

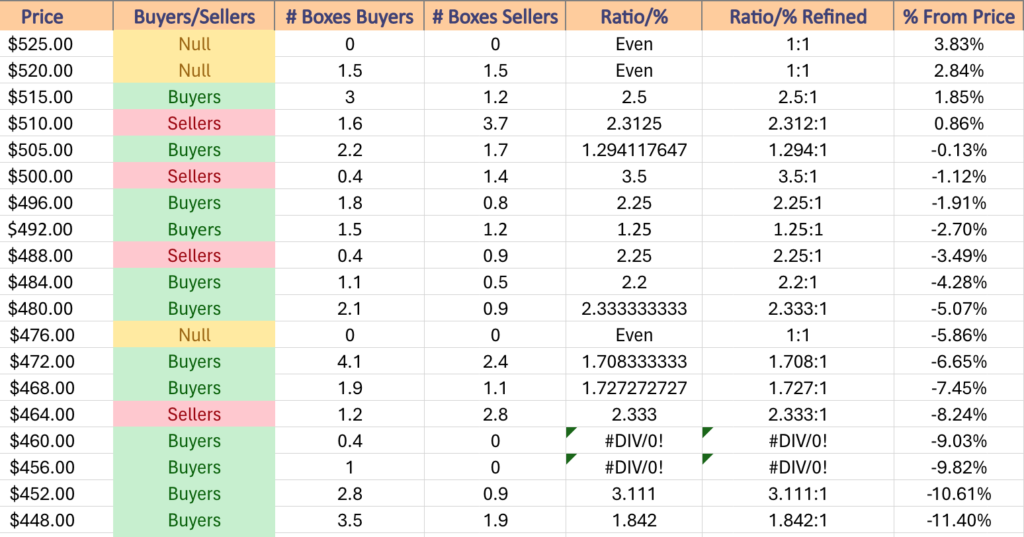

$525 – NULL – 0:0*; +3.83% From Current Price Level
$520 – Even – 1:1; +2.84% From Current Price Level
$515 – Buyers – 2.5:1; +1.85% From Current Price Level
$510 – Sellers – 2.31:1; +0.86% From Current Price Level
$505 – Buyers – 1.29:1; -0.13% From Current Price Level – 10 & 50 Day Moving Averages – Current Price Box***
$500 – Sellers – 3.5:1; -1.12% From Current Price Level
$496 – Buyers – 2.25:1; -1.91% From Current Price Level
$492 – Buyers – 1.25:1; -2.7% From Current Price Level
$488 – Sellers – 2.25:1; -3.49% From Current Price Level
$484 – Buyers – 2.2:1; -4.28% From Current Price Level
$480 – Buyers – 2.33:1; -5.07% From Current Price Level
$476 – NULL – 0:0*; -5.86% From Current Price Level
$472 – Buyers – 1.71:1; -6.65% From Current Price Level
$468 – Buyers – 1.73:1; -7.45% From Current Price Level
$464 – Sellers – 2.33:1; -8.24% From Current Price Level – 200 Day Moving Average*
$460 – Buyers – 0.4:0*; -9.03% From Current Price Level
$456 – Buyers – 1:0*; -9.82% From Current Price Level
$452 – Buyers – 3.11:1; -10.61% From Current Price Level
$448 – Buyers – 1.84:1; -11.4% From Current Price Level
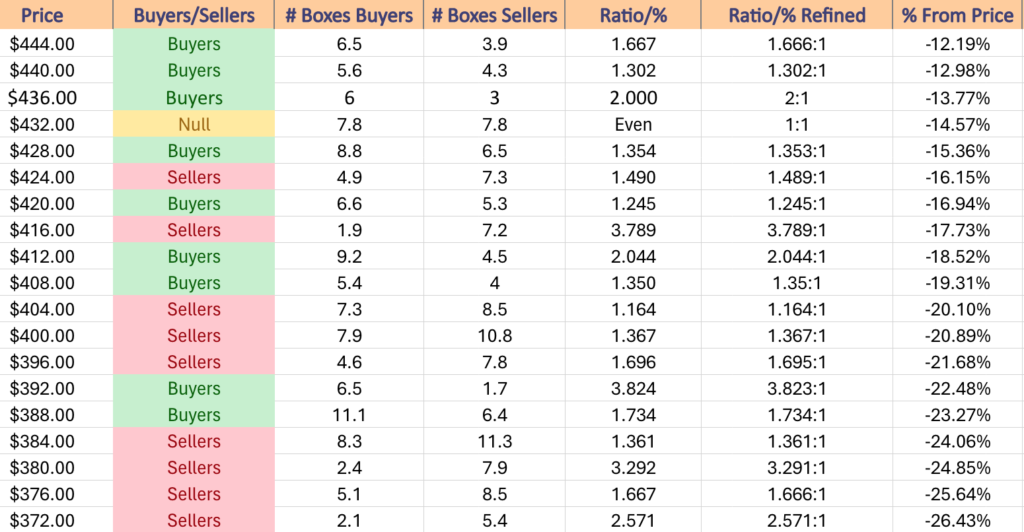
$444 – Buyers – 1.67:1; -12.19% From Current Price Level
$440 – Buyers – 1.3:1; -12.98% From Current Price Level
$436 – Buyers – 2:1; -13.77% From Current Price Level
$432 – Even – 1:1; -14.57% From Current Price Level
$428 – Buyers – 1.35:1; -15.36% From Current Price Level
$424 – Sellers – 1.49:1; -16.15% From Current Price Level
$420 – Buyers – 1.25:1; -16.94% From Current Price Level
$416 – Sellers – 3.79:1; -17.73% From Current Price Level
$412 – Buyers – 2.04:1; -18.52% From Current Price Level
$408 – Buyers – 1.35:1; -19.31% From Current Price Level
$404 – Sellers – 1.16:1; -20.1% From Current Price Level
$400 – Sellers – 1.37:1; -20.89% From Current Price Level
$396 – Sellers – 1.7:1; -21.68% From Current Price Level
$392 – Buyers – 3.82:1; -22.48% From Current Price Level
$388 – Buyers – 1.73:1; -23.27% From Current Price Level
$384 – Sellers – 1.36:1; -24.06% From Current Price Level
$380 – Sellers – 3.29:1; -24.85% From Current Price Level
$376 – Sellers – 1.67:1; -25.64% From Current Price Level
$372 – Sellers – 2.57:1; -26.43% From Current Price Level
$368 – Sellers – 1.49:1; -27.22% From Current Price Level
$364 – Sellers – 1.53:1; -28.01% From Current Price Level
$360 – Sellers – 1.93:1; -28.8% From Current Price Level
$356 – Buyers – 1.43:1; -29.6% From Current Price Level
$352 – Sellers – 3.2:0*; -30.39% From Current Price Level
$348 – Sellers – 3.6:0*; -31.18% From Current Price Level
$344 – NULL – 0:0*; -31.97% From Current Price Level
$340 – NULL – 0:0*; -32.76% From Current Price Level
Price Level:Volume Sentiment Analysis For QQQ (NASDAQ 100) ETF
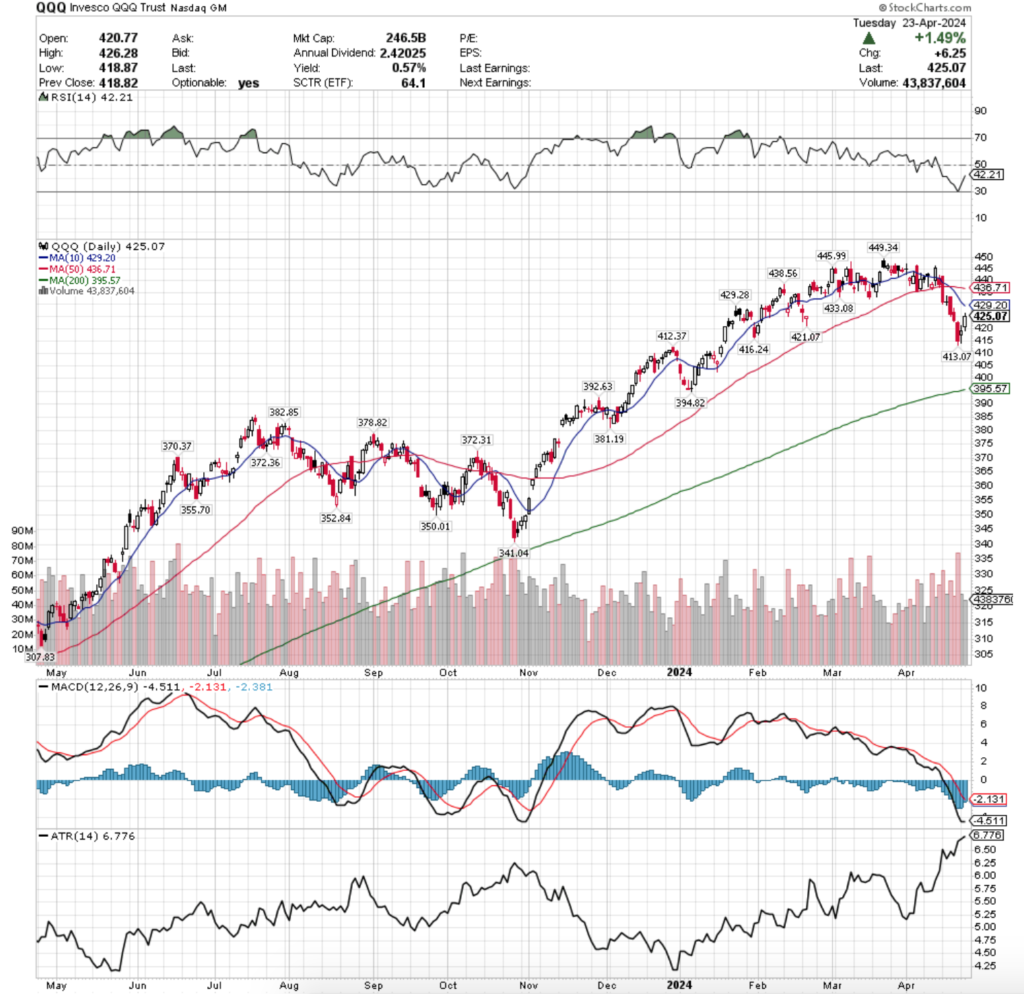
QQQ, the Invesco QQQ Trust ETF tracks the performance of the NASDAQ 100 & has also recenly descended from its all-time high.
It has more consolidated support levels than SPY does as it did not rise as rapidly as SPY, but given the tech-heavy nature of the index it is still susceptible to increased volatility in the coming week(s), making it worth reviewing the strength of the support levels beneath it.
Below is a list of the price levels with the volume sentiment each has traded at over the past 2-3 years.


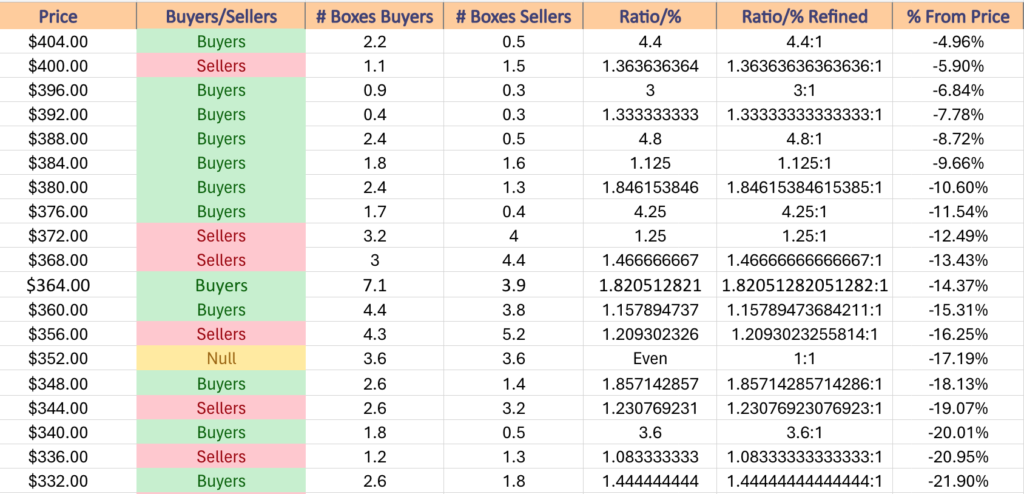
$452 – NULL – 0:0*; +6.34% From Current Price Level
$448 – NULL – 0:0*; +5.39% From Current Price Level
$444 – Buyers – 3.67:1; +4.45% From Current Price Level
$440 – Buyers -1.3:1; +3.51% From Current Price Level
$436 – Buyers – 1.32:1; +2.57% From Current Price Level – 50 Day Moving Average*
$432 – Sellers – 2.36:1; +1.63% From Current Price Level
$428 – Buyers – 2.5:1; +0.69% From Current Price Level – 10 Day Moving Average*
$424 – Sellers – 2.08:1; -0.25% From Current Price Level – Current Price Box*
$420 – Buyers – 9.5:1; -1.19% From Current Price Level
$416 – Sellers – 0.7:0*; -2.13% From Current Price Level
$412 – Buyers – 0.6:0*; -3.07% From Current Price Level
$408 – Buyers – 1.8:1; -4.02% From Current Price Level
$404 – Buyers – 4.4:1; -4.96% From Current Price Level
$400 – Sellers – 1.36:1; -5.9% From Current Price Level
$396 – Buyers – 3:1; -6.84% From Current Price Level
$392 – Buyers – 1.33:1; -7.78% From Current Price Level – 200 Day Moving Average*
$388 – Buyers – 4.8:1; -8.72% From Current Price Level
$384 – Buyers – 1.13:1; -9.66% From Current Price Level
$380 – Buyers – 1.85:1; -10.6% From Current Price Level
$376 – Buyers – 4.25:1; -11.54% From Current Price Level
$372 – Sellers – 1.25:1; -12.49% From Current Price Level
$368 – Sellers – 1.47:1; -13.43% From Current Price Level
$364 – Buyers – 1.82:1; -14.37% From Current Price Level
$360 – Buyers – 1.16:1; -15.31% From Current Price Level
$356 – Sellers – 1.21:1; -16.25% From Current Price Level
$352 – Even – 1:1; -17.19% From Current Price Level
$348 – Buyers – 1.86:1; -18.13% From Current Price Level
$344 – Sellers – 1.23:1; -19.07% From Current Price Level
$340 – Buyers – 3.6:1; -20.01% From Current Price Level
$336 – Sellers – 1.08:1; -20.95% From Current Price Level
$332 – Buyers – 1.44:1; -21.9% From Current Price Level
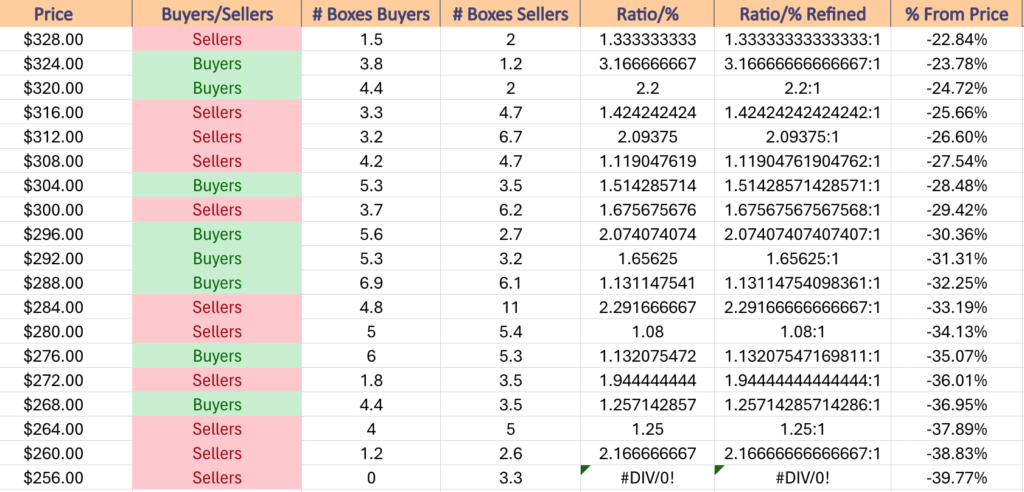
$328 – Sellers – 1.33:1; -22.84% From Current Price Level
$324 – Buyers – 3.17:1; -23.78% From Current Price Level
$320 – Buyers – 2.2:1; -24.72% From Current Price Level
$316 – Sellers – 1.42:1; -25.66% From Current Price Level
$312 – Sellers – 2.09:1; -26.6% From Current Price Level
$308 – Sellers – 1.12:1; -27.54% From Current Price Level
$304 – Buyers – 1.51:1; -28.48% From Current Price Level
$300 – Sellers – 1.68:1; -29.42% From Current Price Level
$296 – Buyers – 2.07:1; -30.36% From Current Price Level
$292 – Buyers – 1.66:1; -31.31% From Current Price Level
$288 – Buyers – 1.31:1; -32.25% From Current Price Level
$284 – Sellers – 2.29:1; -33.19% From Current Price Level
$280 – Sellers – 1.08:1; -34.13% From Current Price Level
$276 – Buyers – 1.13:1; -35.07% From Current Price Level
$272 – Sellers – 1.94:1; -36.01% From Current Price Level
$268 – Buyers – 1.26:1; -36.95% From Current Price Level
$264 – Sellers – 1.25:1; -37.89% From Current Price Level
$260 – Sellers – 2.17:1; -38.83% From Current Price Level
$256 – Sellers – 3.3:0*; -39.77% From Current Price Level
Price Level:Volume Sentiment Analysis For IWM (Russell 2000) ETF
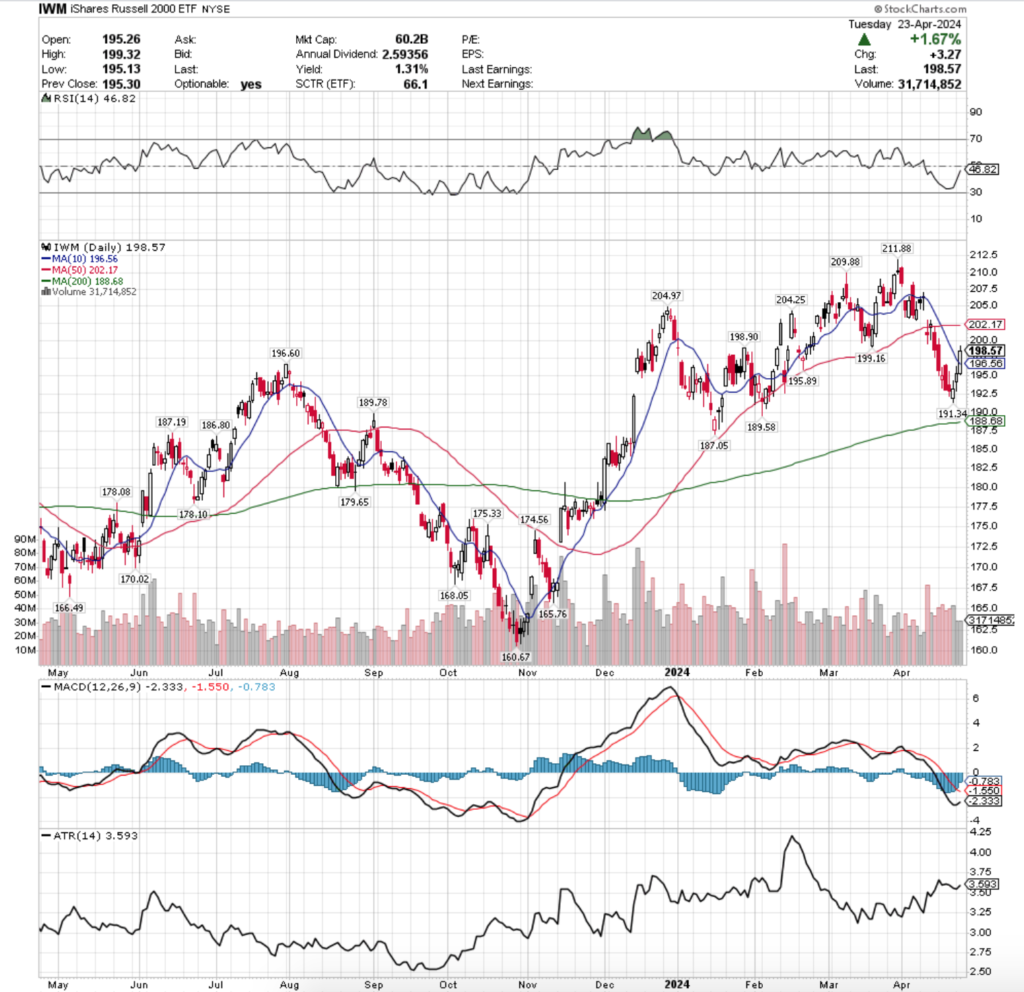
IWM, the iShares Russell 2000 ETF is coming off of a 52-week high, but it did not set an all-time high this past year like its three larger peers in this article.
They tend to trade more in an oscillating range, rather than the steeper ascent taken by SPY, QQQ & DIA, so they have more support levels around their current price than their peers.
However, the small cap index is not immune from the same volatility that the other indexes are experiencing.
Below is a list of the price levels with the volume sentiment each has traded at over the past 2-3 years.

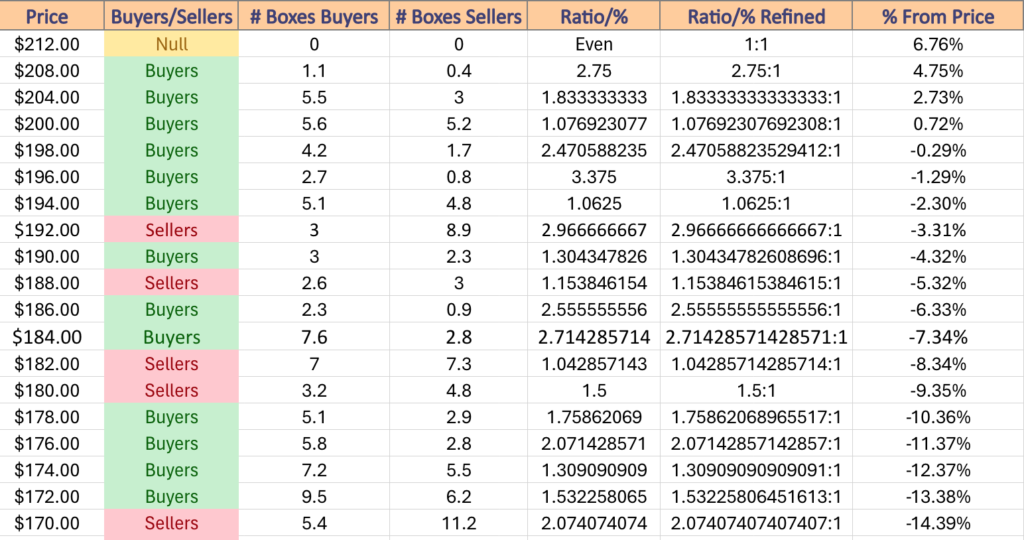

$212 – NULL – 0:0*; +6.76% From Current Price Level
$208 – Buyers – 2.75:1; +4.75% From Current Price Level
$204 – Buyers – 1.83:1; +2.73% From Current Price Level
$200 – Buyers – 1.08:1; +0.72% From Current Price Level – 50 Day Moving Average*
$198 – Buyers – 2.47:1; -0.29% From Current Price Level – Current Price Box*
$196 – Buyers – 3.38:1; -1.29% From Current Price Level – 10 Day Moving Average*
$194 – Buyers – 1.06:1; -2.3% From Current Price Level
$192 – Sellers – 2.97:1; -3.31% From Current Price Level
$190 – Buyers – 1.3:1; -4.32% From Current Price Level
$188 – Sellers – 1.15:1; -5.32% From Current Price Level – 200 Day Moving Average*
$186 – Buyers – 2.56:1; -6.33% From Current Price Level
$184 – Buyers – 2.71:1; -7.34% From Current Price Level
$182 – Sellers – 1.04:1; -8.34% From Current Price Level
$180 – Sellers – 1.5:1; -9.35% From Current Price Level
$178 – Buyers – 1.76:1; -10.36% From Current Price Level
$176 – Buyers – 2.07:1; -11.37% From Current Price Level
$174 – Buyers – 1.31:1; -12.37% From Current Price Level
$172 – Buyers – 1.53:1; -13.38% From Current Price Level
$170 – Sellers – 2.07:1; -14.39% From Current Price Level
$168 – Sellers – 1.14:1; -15.4% From Current Price Level
$166 – Sellers – 3.13:1; -16.4% From Current Price Level
$164 – Sellers – 1.29:1; -17.41% From Current Price Level
$162 – Buyers – 1.5:1; -18.42% From Current Price Level
$160 – Sellers – 0.8:0*; -19.42% From Current Price Level
Price Level:Volume Sentiment Analysis For DIA (Dow Jones Industrial Average) ETF
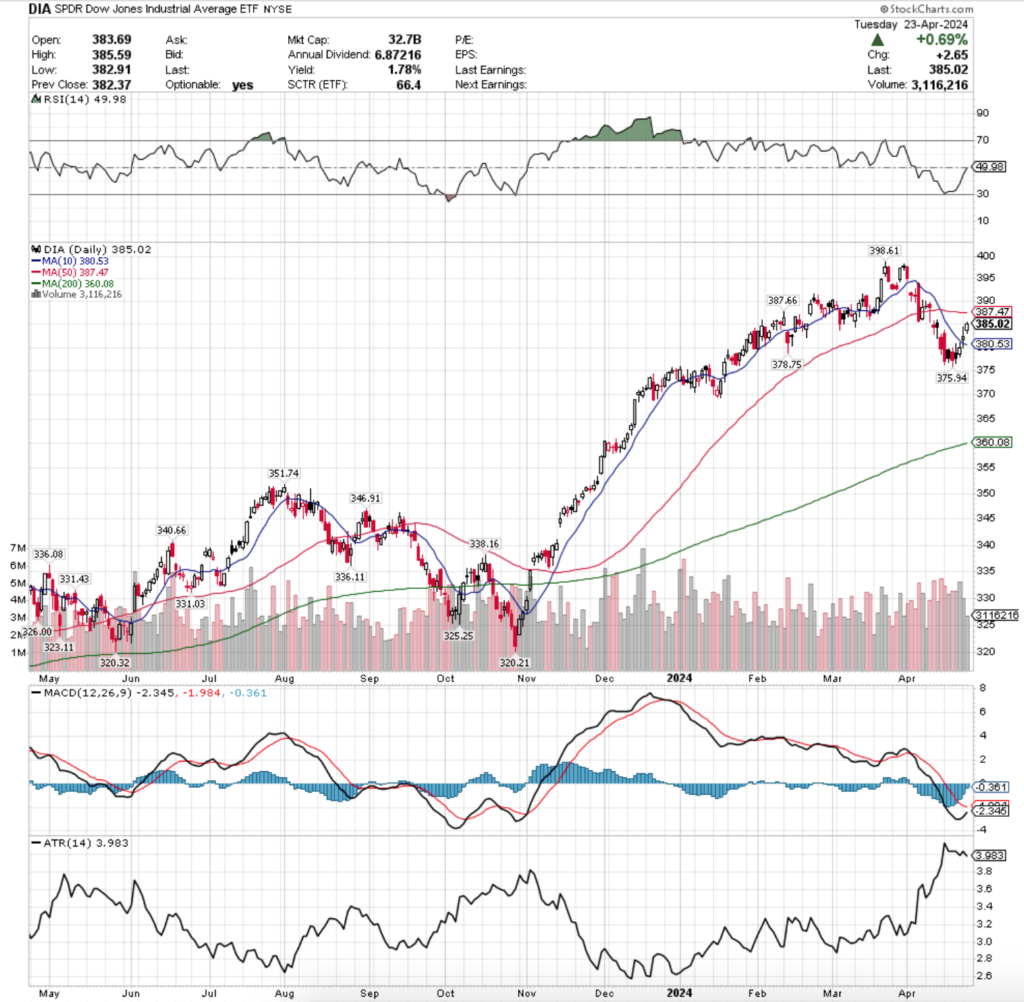
DIA, the SPDR Dow Jones Industrial Average ETF is also coming off of all-time highs set in March of 2024.
Below is a list of the price levels with the volume sentiment each has traded at over the past 3-4 years.

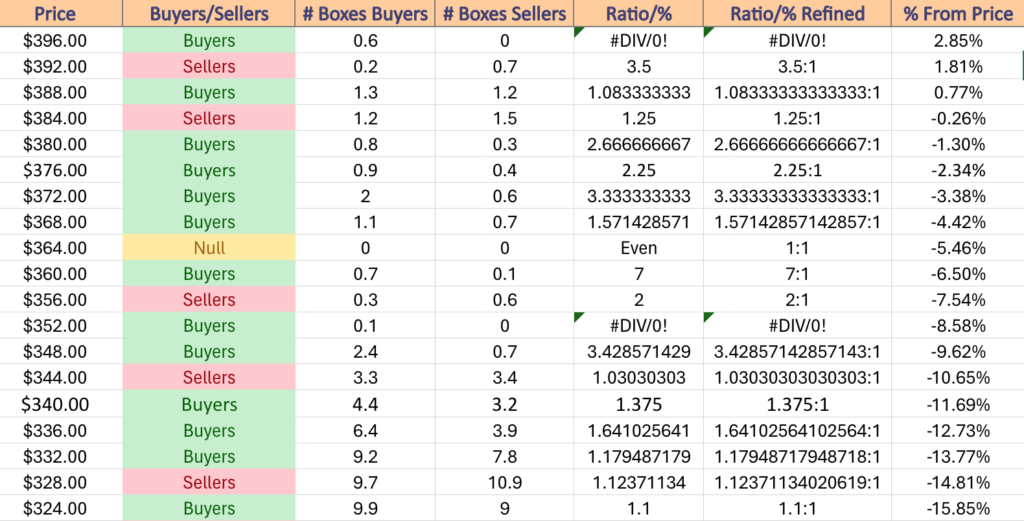

$396 – Buyers – 0.6:0*; +2.85% From Current Price Level
$392 – Sellers – 3.5:1; +1.81% From Current Price Level
$388 – Buyers – 1.08:1; +0.77% From Current Price Level
$384 – Sellers – 1.25:1; -0.26% From Current Price Level – Curren Price Box & 50 Day Moving Average**
$380 – Buyers – 2.67:1; -1.3% From Current Price Level – 10 Day Moving Average*
$376 – Buyers – 2.25:1; -2.34% From Current Price Level
$372 – Buyers – 3.33:1; -3.38% From Current Price Level
$368 – Buyers – 1.57:1; -4.42% From Current Price Level
$364 – NULL – 0:0*; -5.46% From Current Price Level
$360 – Buyers – 7:1; -6.5% From Current Price Level – 200 Day Moving Average*
$356 – Sellers – 2:1; -7.54% From Current Price Level
$352 – Buyers – 0.1:0*; -8.58% From Current Price Level
$348 – Buyers – 3.43:1; -9.62% From Current Price Level
$344 – Sellers – 1.03:1; -10.65% From Current Price Level
$340 – Buyers – 1.38:1; -11.69% From Current Price Level
$336 – Buyers – 1.64:1; -12.73% From Current Price Level
$332 – Buyers – 1.18:1; -13.77% From Current Price Level
$328 – Sellers – 1.12:1; -14.81% From Current Price Level
$324 – Buyers – 1.1:1; -15.85% From Current Price Level
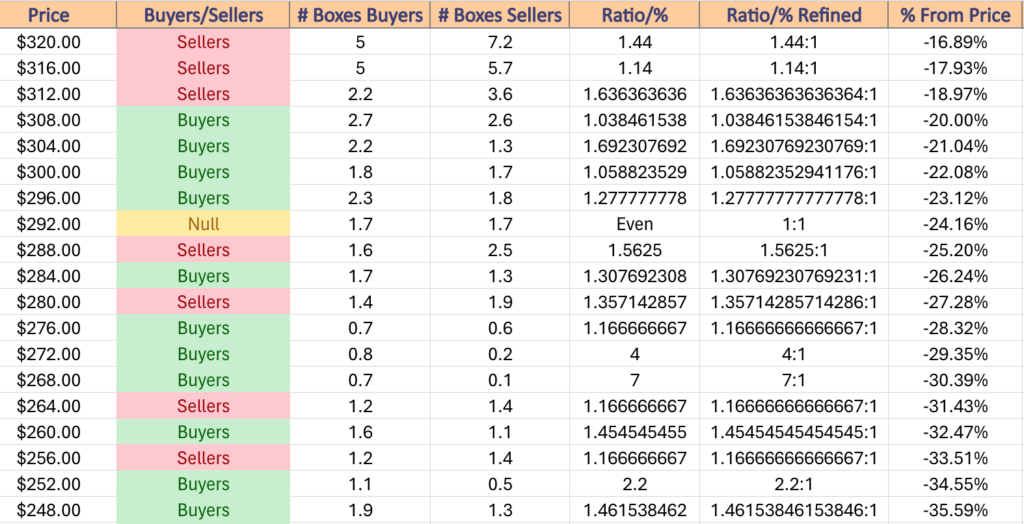
$320 – Sellers – 1.44:1; -16.89% From Current Price Level
$316 – Sellers – 1.14:1; -17.93% From Current Price Level
$312 – Sellers – 1.64:1; -18.97% From Current Price Level
$308 – Buyers – 1.04:1; -20% From Current Price Level
$304 – Buyers – 1.69:1; -21.04% From Current Price Level
$300 – Buyers – 1.06:1; -22.08% From Current Price Level
$296 – Buyers – 1.28:1; -23.12% From Current Price Level
$292 – Even – 1:1; -24.16% From Current Price Level
$288 – Sellers – 1.56:1; -25.2% From Current Price Level
$284 – Buyers – 1.31:1; -26.24% From Current Price Level
$280 – Sellers – 1.36:1; -27.28% From Current Price Level
$276 – Buyers – 1.17:1; -28.32% From Current Price Level
$272 – Buyers – 4:1; -29.35% From Current Price Level
$268 – Buyers – Buyers – 7:1; -30.39% From Current Price Level
$264 – Sellers – 1.17:1; -31.43% From Current Price Level
$260 – Buyers – 1.46:1; -32.47% From Current Price Level
$256 – Sellers – 1.17:1; -33.51% From Current Price Level
$252 – Buyers – 2.2:1; -34.55% From Current Price Level
$248 – Buyers – 1.46:1; -35.59% From Current Price Level
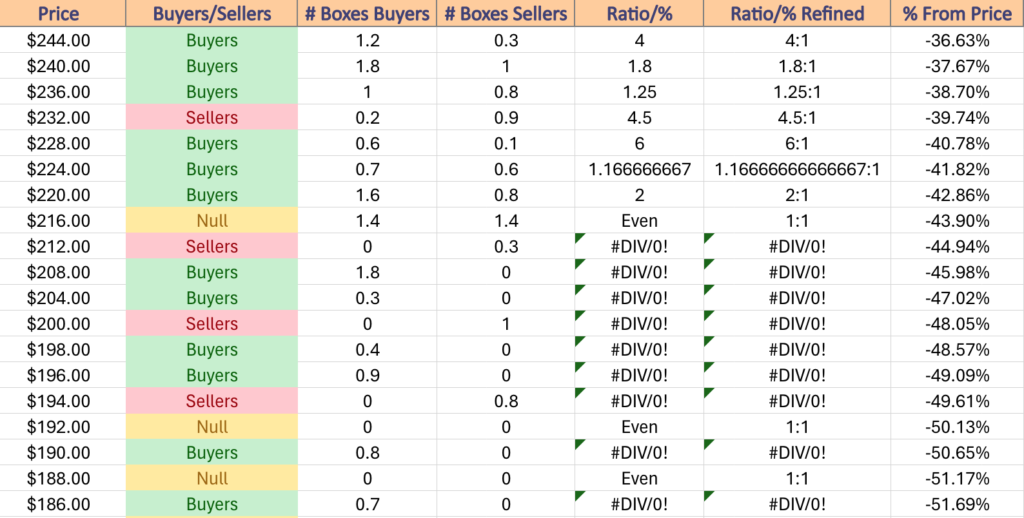
$244 – Buyers – 4:1; -36.63% From Current Price Level
$240 – Buyers – 1.8:1; -37.67% From Current Price Level
$236 – Buyers – 1.25:1; -38.7% From Current Price Level
$232 – Sellers – 4.5:1; -39.74% From Current Price Level
$228 – Buyers – 6:1; -40.78% From Current Price Level
$224 – Buyers – 1.17:1; -41.82% From Current Price Level
$220 – Buyers – 2:1; -42.86% From Current Price Level
$216 – Even – 1:1; -43.9% From Current Price Level
$212 – Sellers – 0.3:0*; -44.94% From Current Price Level
$208 – Buyers – 1.8:0*; -45.98% From Current Price Level
$204 – Buyers – 0.3:0*; -47.02% From Current Price Level
$200 – Sellers – 1:0*; -48.05% From Current Price Level
$198 – Buyers – 0.4:0*; -48.57% From Current Price Level
$196 – Buyers – 0.9:0*; -49.09% From Current Price Level
$194 – Sellers – 0.8:0*; -49.61% From Current Price Level
$192 – NULL – 0:0*; -50.13% From Current Price Level
$190 – Buyers – 0.8:0*; -50.65% From Current Price Level
$188 – NULL – 0:0*; -51.17% From Current Price Level
$186 – Buyers – 0.7:0* -51.69% From Current Price Level
$184 – NULL – 0:0*; -52.21% From Current Price Level
$182 – NULL – 0:0*; -52.73% From Current Price Levels
$180 – NULL – 0:0*; -53.25% From Current Price Level
$178 – Sellers – 0.7:0*; -53.77% From Current Price Level
$176 – NULL – 0:0*; -54.29% From Current Price Level
$174 – NULL – 0:0*; -54.81% From Current Price Level
$172 – Sellers – 0.8:0*; -55.33% From Current Price Level
$170 – NULL – 0:0*; -55.85% From Current Price Level
$168 – NULL – 0:0*; -56.37% From Current Price Level
*** I DO NOT OWN SHARES OR OPTIONS CONTRACT POSITIONS IN SPY, QQQ, IWM OR DIA AT THE TIME OF PUBLISHING THIS ARTICLE ***