SPY, the SPDR S&P 500 ETF climbed +2.65% this past week, as the VIX closed the week at 15.03 implying a one day change of +/- 0.98% & a one month change of +/-2.74% heading into the weekend.
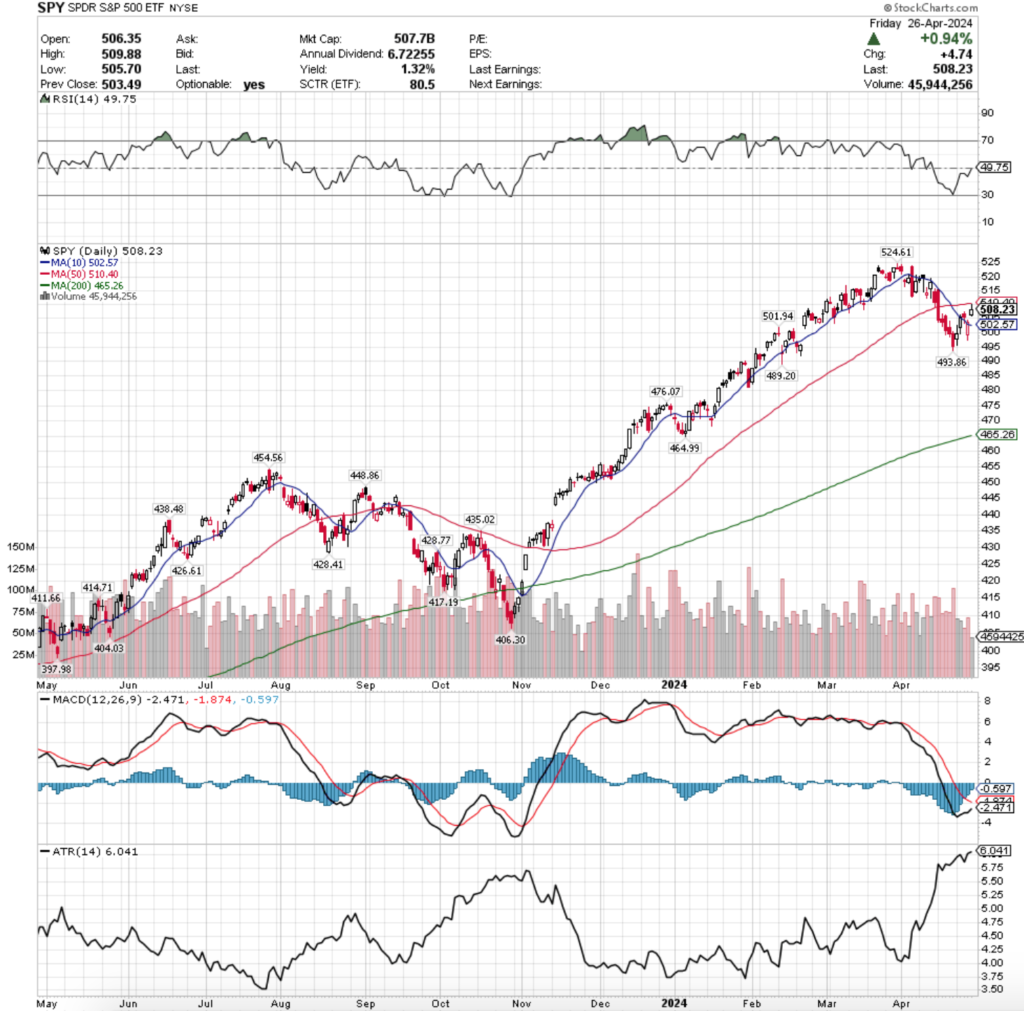
Their RSI is sitting just underneath the neutral level at 49.75, coming back from the oversold level prior to the upwards volatility of the past week & change, while their MACD is still in bearish territory, but is moving towards the signal line looking for a bullish crossover in the coming days (pending no downward movement).
Volumes were -19.38% below average compared to the year prior (62,714,181 vs. 77,792,641), which does not signal much confidence in the week’s gains, given that three of the five sessions were advances.
The week kicked off on an uncertain note, as Monday’s session resulted in a high wave spinning top on lackluster volume.
While the day resulted in a slight advance, there was a wide range of testing to both the upside & downside that ultimately showed that investors were unsure as to where they valued SPY & its compenents.
Tuesday continued this theme, as volumes were even lower than Monday’s session & while prices opened higher than Monday, they tested down to around Monday’s close before ultimately taking a run a the 10 day moving average’s resistance.
While Tuesday was able to test just above the 10 DMA, it ultimately closed below it, signaling that there was not much confidence in SPY at that high of a price level.
Wednesday was more of the same, with even lower volumes & price levels orbiting around the 10 DMA.
The session gapped up to open above the 10 day moving average, tested slightly higher, before ultimately trending lower, testing just below the support of the 10 DMA & closing narrowly above it.
Thursday the volatility & confusion carried on as the session opened on a gap down & looked set to test lower, but ultimately turned around & made a run at the 10 DMA’s resistance again.
The volume of Thursday looks like a squeeze for SPY, as it was the week’s highest volume session (although as noted above, volumes were weak for the week) & despite the bullish daily performance following the gap down open, the 10 day moving average’s resistance still held up.
Friday validated all of the concerns mentioned above in terms of uncertainty & a lack of strength & conviction, as the session opened on a gap higher, ran up the the 50 day moving average’s resistance but was unable to test it & the day’s candle resulted in a shooting star (bearish).
It is worth noting here that the volume from Friday’s +0.94% session is one of the lowest volume readings of the past year, indicating a lack of confidence in market participants.
SPY’s Average True Range has continued to advance as last week was rather volatile & should be expected to continue staying higher in the coming week(s).
A key area to be watching this week is the price relationship to the 50 DMA’s resistance, as well as the 10 DMA’s support.
There is now a basket around the price where the 10 DMA is creating a rounded bottom of support, while the 50 DMA is creating a rounding top of resistance & whichever one holds up the strongest will dictate the direction that SPY’s price moves in.
The low volumes & other signals of uncertainty from last week favor the 50 DMA holding up & the continued consolidation/decline, but that will largely be dictated by the continued earnings calls, as well as the Fed’s interest rate announcement & press conference on Wednesday (all are listed below).
Given how close we are to SPY’s all-time high & how sparse support levels are from the current price level it does not appear as though anything but a solid announcement of rate cuts will be able to continued prices moving higher at these levels, but again, the clues will come by how the 10 & 50 day moving averages hold up in the beginning of the week, as well as if the abnormally low volume trend continues.
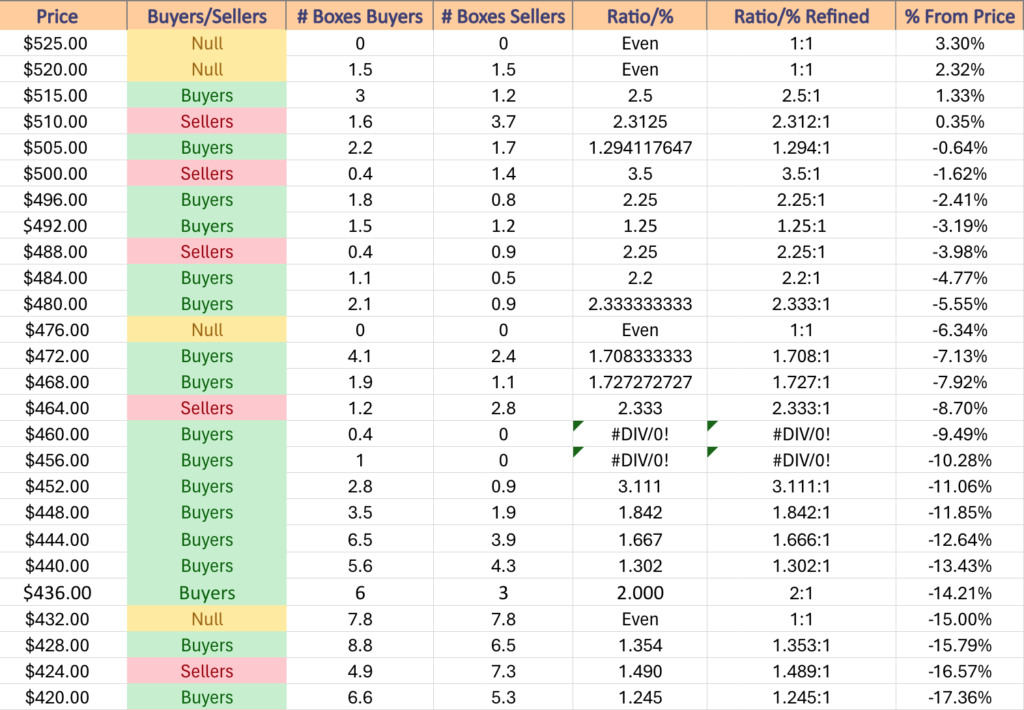
SPY has support at the $502.57 (10 Day Moving Average, Volume Sentiment: Sellers, 3.5:1), $501.94 (Volume Sentiment: Sellers, 3.5:1), $493.86 (Volume Sentiment: Buyers, 1.25:1) & $489.20/share (Volume Sentiment: Sellers, 2.25:1), with resistance at the $510.40 (50 Day Moving Average, Volume Sentiment: Sellers, 2.31:1) & $524.61/share (All-Time High, Volume Sentiment: NULL, 0:0*) price levels.
QQQ, the Invesco QQQ Trust ETF that tracks the NASDAQ 100 advanced +3.94% last week, faring the best of the major four indexes.
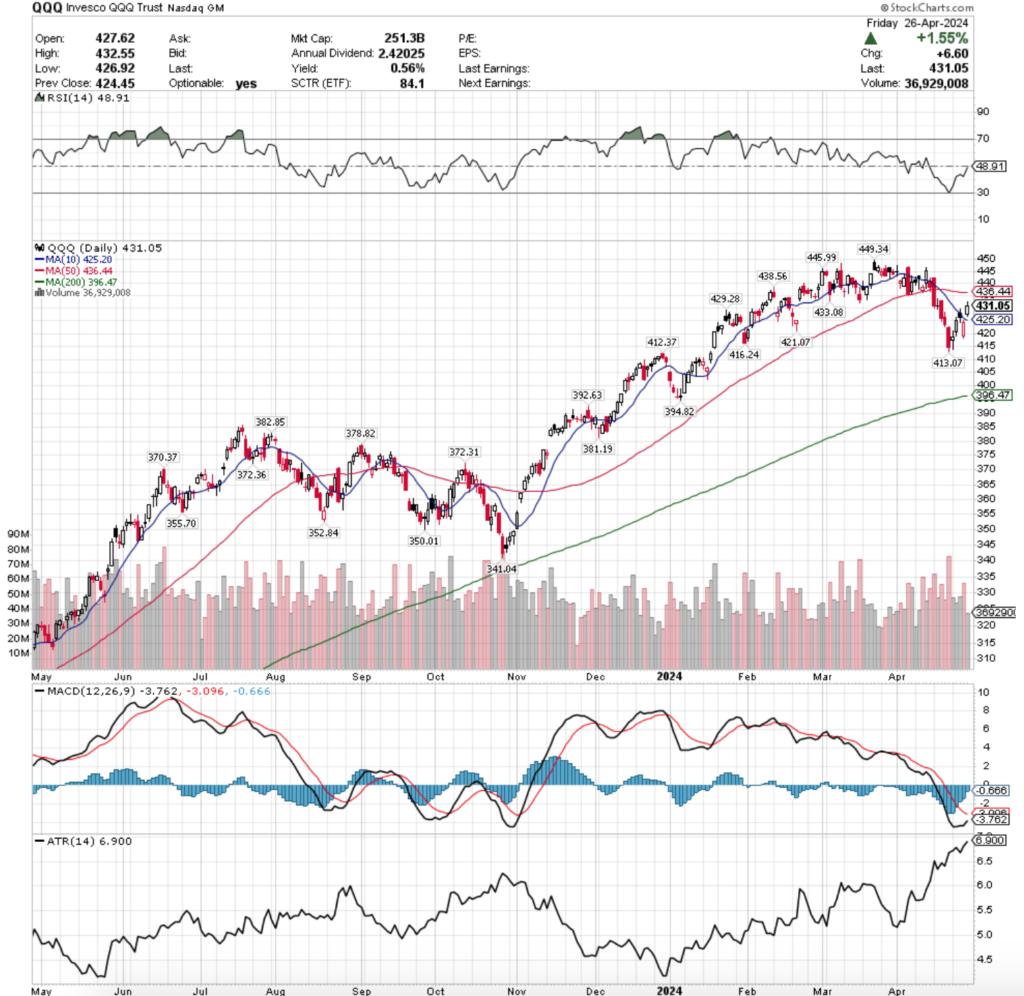
Their RSI is trending back towards neutral from oversold levels & currently sits at 48.91, while their MACD is in a similar position to SPY’s, still bearish but approaching the signal line for a potential crossover in the coming days.
Volumes were -2.39% lower than average compared to the year prior (47,908,620 vs. 49,080,898), which is interesting given the tech-heavy makeup of QQQ vs. SPY & appears to be directly tied into the tech company earnings calls of last week.
Much like SPY, QQQ’s week also kicked off to an uncertain tune with a high wave spinning top candle being the result of Monday’s session.
While Monday’s Open-Close price levels favored the higher half of the candle, the length of the lower shadow should pop out to readers as it shows that there was a large test lower, but the rest of the week’s gains were set up via the open & closing levels of the day.
Tuesday saw light volume force a large daily advance which does not signal much confidence in the upwards move.
Wednesday opened on a gap up near the 10 day moving average, tested slightly higher, before ultimately testing lower & closing lower on the day (filled in candle’s real body) & beneath the 10 day moving average.
This trend continued on Thursday, where QQQ opened on a gap down to below the lowest point of Tuesday’s session, but on the week’s highest volume was able to climb higher & close above its open, while still ending as a declining session & beneath the 10 day moving average’s resistance.
Friday delivered additional sentiment of uncertainty, as prices gapped up above the 10 DMA & continued higher on the day, but on the week’s weakest volume.
This is worth noting as well, as the week itself had just below average volume compared to the year prior, so the large one day jump heading into the weekend should be viewed skeptically.
QQQ’s Average True Range has continued to climb throughout the month of April & will likely continue to do so for the coming week(s) as volatility is unlikely to be subsiding in the near-term.
Much like SPY, QQQ enters this week with prices wedged in between the support of the 10 day moving average & the resistance of the 50 day moving average.
QQQ has more support levels near its current price than SPY, but given how close QQQ is to an all-time high this may not be able to prevent a slide to the downside as strongly as it would be assumed if their price level were slightly lower.
Keeping an eye on where prices move in relation to those moving averages this week & how it aligns with the daily volume readings will be key for anticipating which direction prices will move.
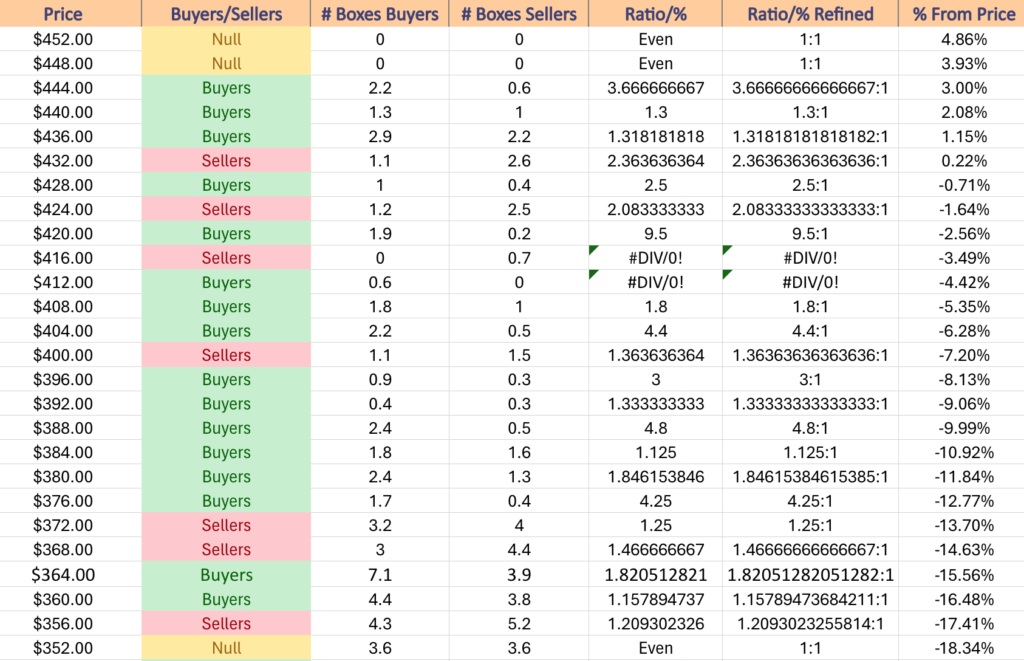
QQQ has support at the $429.28 (Volume Sentiment: Buyers, 2.5:1), $425.20 (10 Day Moving Average, Volume Sentiment: Sellers, 2.08:1), $421.07 (Volume Sentiment: Buyers, 9.5:1) & $416.24/share (Volume Sentiment: Sellers, 0.7:0*), with resistance at the $433.08 (Volume Sentiment: Sellers, 2.36:1), $436.44 (50 Day Moving Average, Volume Sentiment: Buyers, 1.32:1), $438.56 (Volume Sentiment: Buyers, 1.32:1) & $445.95/share (Volume Sentiment: Buyers, 3.67:1) price levels.
IWM, the iShares Russell 2000 ETF added +2.7% last week, as investors were even cautiously interested in piling into the small cap names.
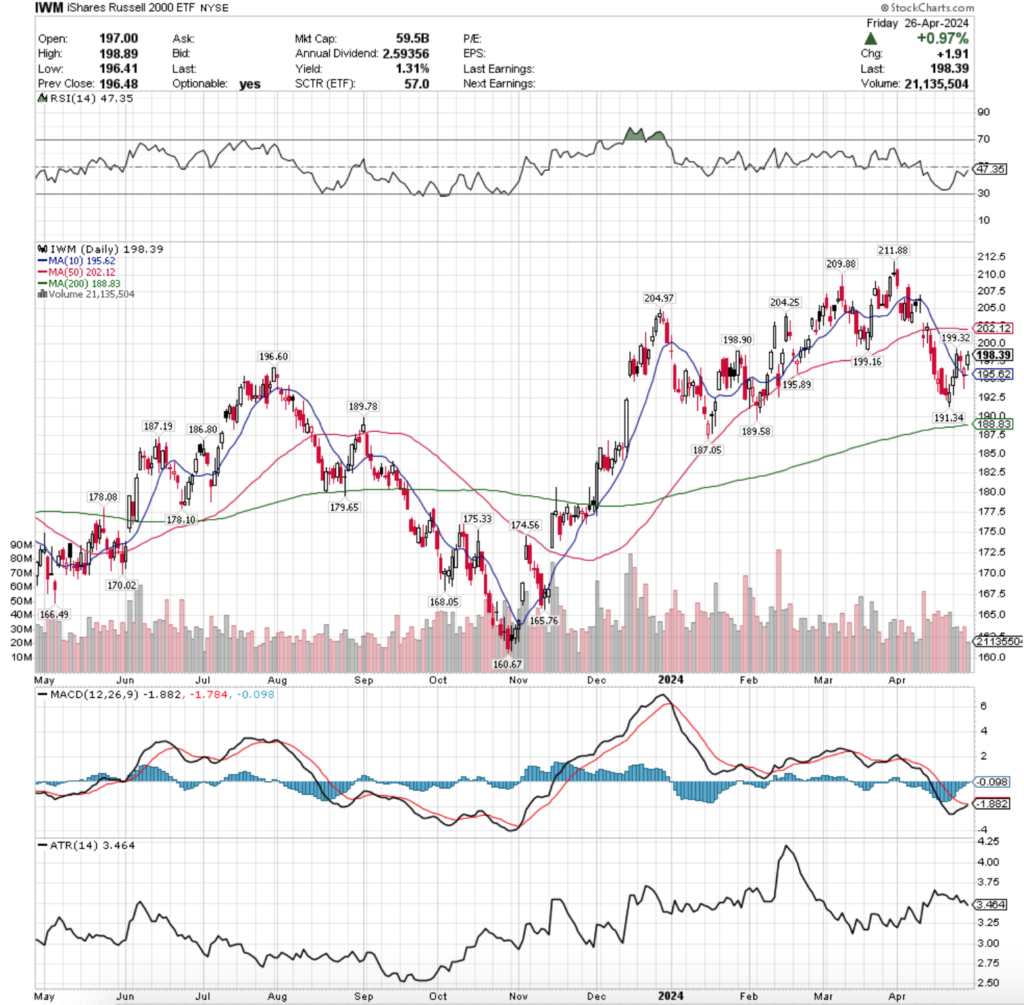
Their RSI is nearing the neutral level of 50 & currently sits at 47.35 in the wake of the declines of April, while their MACD looks set to bullishly cross the signal line during Monday’s session.
Volumes were -15.51% less than the average of the year prior (29,472,933 vs. 34,884,695), which highlights that “cautiously interested” mentioned above, as while there was a weekly advance, it was at noticeably low participation rates.
The week opened on a bullish note, as a high wave candle kicked off Monday in the direction higher for the week.
Tuesday the climb continued higher & the ten day moving average was smashed through, but the day’s high later became a resistance point which is something that will need to be paid attention to this week.
Wednesday saw an uncertain outlook from market participants for IWM, as a spinning top candle formed with Tuesday’s candle to create a bearish harami pattern on the second lowest volumes of the week.
The 10 day moving average’s support held up though on Wednesday, as the session’s candle’s lower shadow did not test the 10 DMA.
Thursday is where the weakness in IWM began to show, as following the bearish harami session the day opened on a gap down that was around the 10 day moving average.
Briefly testing well beneath the 10 DMA’s resistance, bulls regained control during the day & forced the session to close above its open, but still for a loss on the day on high volume for the week, much like the “squeeze” nature we saw above with SPY & QQQ.
Friday continued the march of uncertainty, with a gap up session that closed +0.97% on extremely weak volume heading into the weekend.
This did not display much in terms of confidence in IWM, especially when paired with the fact that the resistance level set on Tuesday was not able to be reached during Friday’s session, signaling that investors did not have much appetite towards the upside.
IWM’s Average True Range is currently in the middle of its range & trending downwards, as the modest gains of this week were able to cut off some of the bleeding from volatility that they’ve been experiencing over the past couple of months (April in particular).
Much like SPY & QQQ, the basket created around the price by the 10 day moving average (support) & 50 day moving average (resistance) will be an area to keep a close eye on this week.
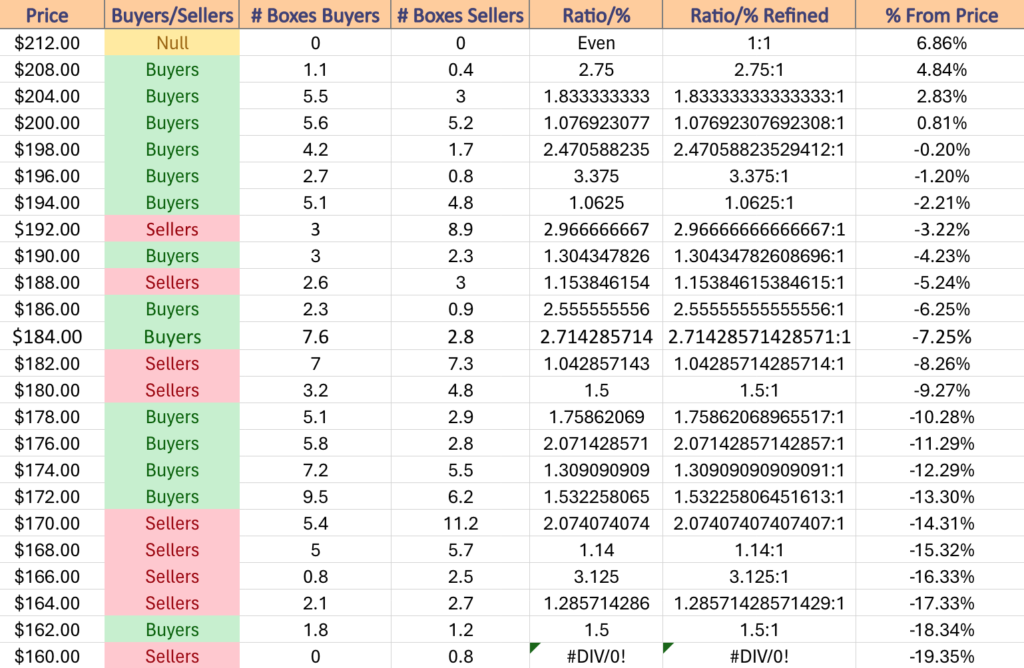
Both moving averages are moving towards one another & will ultimately squeeze the price in one direction or the other & the current favorite is the 50 DMA winning out when you consider how many resistance touch-points exist between the $198.90-$202.12 range (the latter being the 50 DMA as of Friday’s close), while there is no support for ~1.5% below Friday’s closing price.
IWM has support at the $196.60 (Volume Sentiment: Buyers, 3.38:1), $195.89 (Volume Sentiment: Buyers, 1.06:1), $195.62 (10 Day Moving Average, Volume Sentiment: Buyers, 1.06:1) & $191.34/share (Volume Sentiment: Buyers, 1.3:1), with resistance at the $198.90 (Volume Sentiment: Buyers, 2.47:1), $199.16 (Volume Sentiment: Buyers, 2.47:1), $199.32 (Volume Sentiment: Buyers, 2.47:1) & $202.12/share (50 Day Moving Average, Volume Sentiment: Buyers, 1.08:1) price levels.
DIA, the SPDR Dow Jones Industrial Average ETF had another close-range week, only gaining +0.66% for the week.
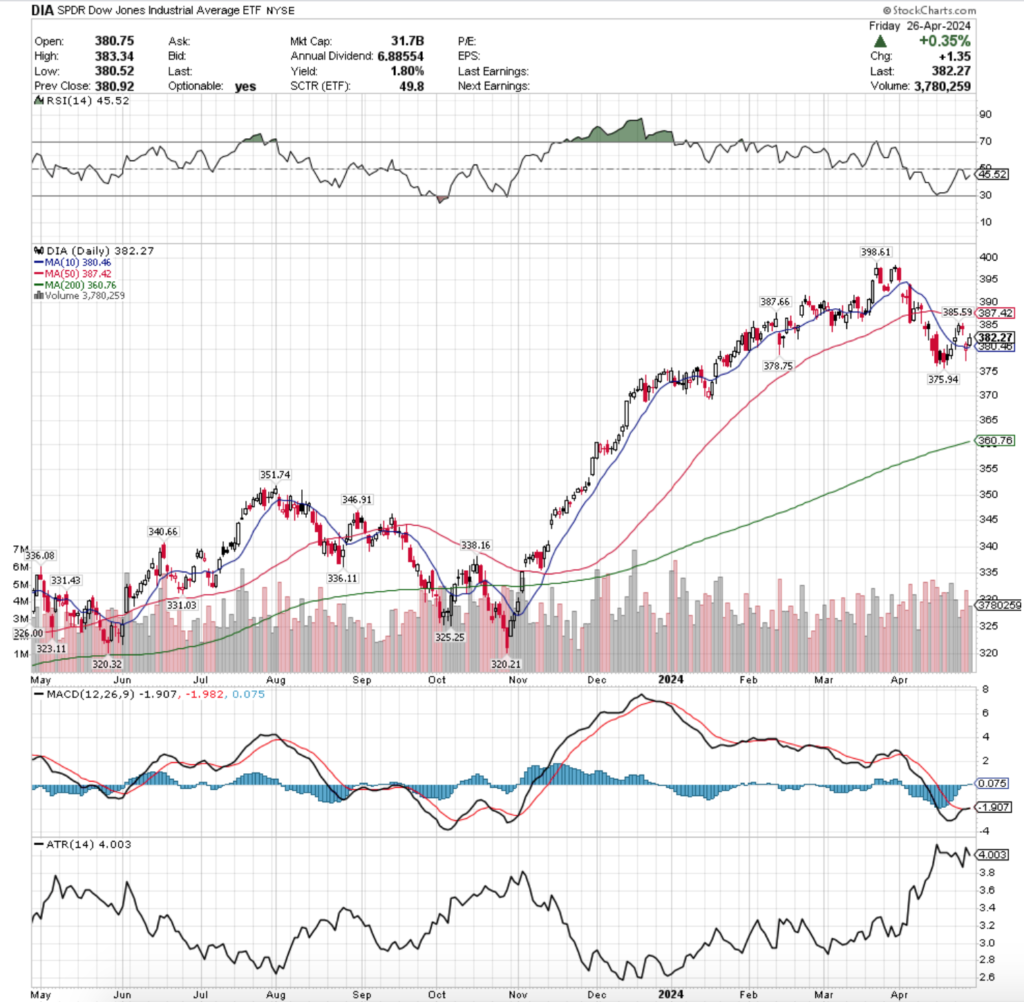
Their RSI is trending towards neutral & sits currently at 45.52, while their MACD is currently bullish, but muted & not looking particularly strong.
Volumes were +10.82% above average last week vs. the year prior (3,909,847 vs. 3,527,965), which should be noted as Thursday’s declining session was the strongest volume of the week.
Monday looked a bit different for DIA vs. the other major indexes, as a gap up session on a high wave spinning top candle brought prices above the resistance of the 10 day moving average.
The session did test below the 10 DMA’s support throughout the day, but rallied higher, while closing in the middle range of the day’s candle.
Tuesday flashed the caution lights for DIA, as the session jumped higher & ended in an advancing day, but on the lowest volume of the week, indicating that there was limited belief & positive sentiment behind the move upwards.
Wednesday continued supporting that sentiment, when the day resulted in a spinning top candle that completed a bearish harami with Tuesday’s candle & set the stage for Thursday’s gap lower session.
Thursday gapped down & opened beneath the 10 DMA’s resistance, tested lower (well into the prior week’s range), but was ultimately able to recover & close higher on the day & above the 10 day moving average’s support.
The 10 DMA’s support held up for Friday’s session, which opened just above it & resulted in a +0.35% daily advance, although prices did test slightly higher than the closing level throughout the day.
DIA’s Average True Range is still on the higher end of its range, but is declining as the past week was less volatile than the rest of the month of April was.
As with the other three major indexes mentioned above, the relationship to DIA’s price & the 10 & 50 DMA’s will be the central focus this week on a technical standpoint, as well as how the daily volumes wind up.
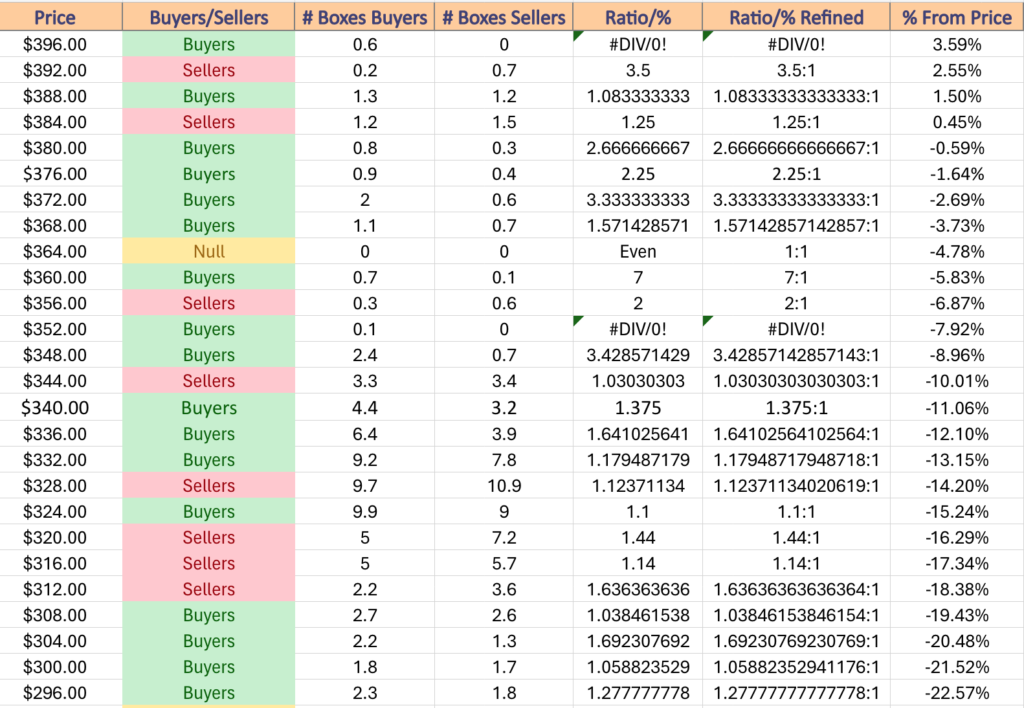
DIA’s chart is more situated like SPY’s & does not have many support levels near the current price, so should the 10 DMA’s support be broken it will be difficult for them to find footing near the current price level.
Watching each day’s volume levels will provide insight into which direction market participants will be favoring, as well as into the strength of support/resistance levels that the price encounters over the coming days.
DIA has support at the $380.46 (10 Day Moving Average, Volume Sentiment: Buyers, 2.67:1), $378.75 (Volume Sentiment: Buyers, 2.25:1), $375.94 (Volume Sentiment: Buyers, 3.33:1) & $360.76/share (200 Day Moving Average, Volume Sentiment: Buyers, 7:1), with resistance at the $385.59 (Volume Sentiment: Sellers, 1.25:1), $387.42 (50 Day Moving Average, Volume Sentiment: Sellers, 1.25:1), $387.66 (Volume Sentiment: Sellers, 1.25:1) & $398.61/share (All-Time High, Volume Sentiment: Buyers, 0.6:0*) price levels.
The Week Ahead
Monday does not have any major economic data scheduled for release.
Domino’s Pizza, Franklin Resources, JinkoSolar, ON Semiconductor, Revvity & SoFi Technologies report earnings before Monday’s opening bell, with Amkor, Arch Capital, Brixmor Property, Chegg, Coursera, Crown Holdings, Cushman & Wakefield, CVR Energy, Douglas Dynamics, Element Solutions, Everest Group, F5 Networks, Flowserve, Harmonic, Kforce, Lattice Semiconductor, LTC Properties, Medifast, MicroStrategy, NXP Semiconductors, Paramount Global, PotlatchDeltic, Qiagen, Rambus, Sanmina, SBA Communications, Sensata Technologies, Sun Communities, Welltower, Woodward & Yum China schedule to report after the closing bell.
Employment Cost Index data is released Tuesday at 8:30 am, followed by S&P Case-Schiller Home Price Index (20 Cities) at 9 am, Chicago Business Barometer (PMI) at 9:45 am & Consumer Confidence data at 10 am.
Tuesday morning brings us earnings from 3M, ACI Worldwide, Air Products, American Electric, American Tower, Archer-Daniels-Midland, Armstrong World Industries, ATI, Brinker International, CenterPoint Energy, Coca-Cola, Corning, Dana, Eaton, Ecolab, Eli Lilly, Enterprise Products, Equitrans Midstream, Franklin Electric, Gartner, GE HealthCare, Graphic Packaging, Harmony Biosciences, Hubbell, Illinois Tool Works, Incyte, Lear, Macerich, Marathon Petroleum, Martin Marietta Materials, McDonald’s, Molson Coors Brewing, MPLX, Northern Oil & Gas, Oaktree Specialty Lending Corp, OneMain Holdings, PACCAR, PayPal Holdings, Penske Automotive Group, Public Service, Sirius XM Holdings, Sysco, Taylor Morrison Home, Tenet Healthcare, Trane Technologies, UFP Industries & Zebra Technologies, with Amazon.com, Advanced Micro Devices, Ashland, Axos Financial, Blackbaud, Boston Properties, Caesars Entertainment, Chesapeake Energy, Clorox, Denny’s, Diamondback Energy, DigitalBridge, Edison International, Equitable Holdings, Essex Property, Exelixis, Extra Space Storage, Gulfport Energy, Hillenbrand, Huron Consulting, Invitation Homes, Leggett & Platt, Lemonade, Lending Club, Littelfuse, LPL Financial, Lumen Technologies, Matson, Mirion Technologies, Mondelez International, O-I Glass, ONEOK, Park Hotels & Resorts, Piedmont Office Realty Trust, Pinterest, Powell Industries, Prudential, Public Storage, Republic Services, Skyworks Solutions, STAG Industrial, Starbucks, Stryker, Super Micro Computer, Tanger, UDR, Unum Group, Voya Financial, W.P. Carey & Werner Enterprises all reporting after the closing bell.
Wednesday kicks off with ADP Employment data at 8:15 am, followed by Construction Spending, ISM Manufacturing & Job Openings data at 10 am, the anticipated FOMC Interest Rate Decision at 2pm, Fed Chair Powell’s Press Conference at 2:30 pm & Auto Sales data at 5:30 pm.
Mastercard, AerCap Holdings, Alkermes, APA, Ares Capital, Automatic Data Processing, Avista, Avnet, Axalta Coating Systems, Bausch + Lomb, Berry Petroleum, Bio-Techne, Brookfield Infrastructure, CDW, CGI Group, Chefs’ Warehouse, Clean Harbors, Conduent, CTS Corp, CVS Health, Dayforce, DuPont, Estee Lauder, Extreme Networks, Garmin, Generac, Gibraltar Industries, GlaxoSmithKline, Global Payments, IDEXX Laboratories, Johnson Controls, KKR, Kraft Heinz, Life Time Group Holdings, LivaNova, Marriott International, Mastercard, Neurocrine Biosciences, Norwegian Cruise Line, OGE Energy, Parsons, Pfizer, PPL Corp, Repligen, Scotts Miracle-Gro, Silgan Holdings, Smith Douglas Homes, Spire, Stagwell, Vita Coco, Trinity Industries, TTM Technologies, Westlake, Wingstop & Yum! Brands are all schedule to report earnings before Wednesday’s open, with Acadia Healthcare, Aflac, Albemarle, Alkami Technology, Allstate, American Financial Group, American International Group, American Water Works, ANSYS, Avis Budget, Axcelis Technologies, AXIS Capital, Bally’s Corp, Beazer Homes, BrightView, C.H. Robinson Worldwide, Camping World, Carvana, CF Industries, Clearwater Analytics, Coeur Mining, Cognizant Technology Solutions, Comstock Resources, Corteva, Cross Country Healthcare, Curtiss-Wright, Devon Energy, Digi International, DoorDash, eBay, Envista Holdings, EPR Properties, Equity Commonwealth, Etsy, eXp World Holdings, Fastly, First Solar, Flex, Freshworks, Glaukos, Green Brick Partners, Hanover Insurance, Heartland Financial, Herbalife Nutrition, Host Hotels & Resorts, Hudson Pacific Properties, Informatica, Jazz Pharmaceuticals, Kemper, Knowles, Kulicke & Soffa, Marathon Oil, MetLife, MGIC Investment, MGM Resorts, Mister Car Wash, Monolithic Power, Mosaic, Murphy USA, National Fuel Gas, National Storage Affiliates, Netgear, Paramount Group, Paycom Software, Pilgrim’s Pride, Procore Technologies, PTC, Qorvo, Qualcomm, Radian Group, Rayonier, Rush Street Interactive, Ryman Hospitality, Schrodinger, Sprouts Farmers Market, Sunnova Energy, Tetra Tech, UGI Corp, Upwork, Valmont Industries, Ventas, VICI Properties, Wolfspeed & Zillow all reporting after the session’s close.
Initial Jobless Claims, U.S. Trade Deficit & U.S. Productivity data are released Thursday at 8:30 am, followed by Factory Orders data at 10 am.
Thursday starts off on a busy note earnings-wise with AGCO Corp, Agios Pharmaceuticals, Altice USA, Apollo Global Management, Aptiv, ArcelorMittal, Ares Management, Arrow Electronics, Baxter, Becton, Dickinson and Company, BorgWarner, BrightSpring Health Services, Canada Goose, Cardinal Health, Church & Dwight, Cinemark, CNH Industrial, Cognex, ConocoPhillips, Cummins, CyberArk Software, Dominion Energy, Driven Brands, Enovis Corporation, Eversource Energy, Exelon, ExlService, Ferrari, Frontdoor, Frontier Group Holdings, Howmet Aerospace, Huntington Ingalls, IdaCorp, InMode, Insight Enterprises, Intercontinental Exchange, InterDigital, IQVIA, Iron Mountain, Itron, ITT, Janus Henderson Group, Kellanova, Kimbell Royalty Partners, Kimco Realty, Kontoor Brands, Lamar Advertising, Lancaster Colony, Lincoln National, Linde, LXP Industrial Trust, Malibu Boats, Moderna, Moody’s, Murphy Oil, Organon, Parker-Hannifin, Peabody Energy, Peloton Interactive, PENN Entertainment, Pinnacle West, Pitney Bowes, Quanta Services, Regeneron Pharmaceuticals, Sabre, Sealed Air, Shake Shack, Shutterstock, SolarWinds, Southern, Stanley Black & Decker, The Cigna Group, Turning Point Brands, Utz Brands, Vontier, Vulcan Materials, Walker & Dunlop, Wayfair, Wendy’s, WestRock, XPEL, Xylem & Zoetis all reporting before the opening bell, followed by Apple, AAON, ACCO Brands, AES, American Homes 4 Rent, Amgen, Arcosa, Asure Software, Beacon Roofing Supply, BigBear.ai, Bill.com, BJ Restaurants, Block, Booking Holdings, Bright Horizons, Cable ONE, Camden Property, Civitas Resources, Cloudflare, Cohu, Coinbase Global, Con Edison, Coterra Energy, DaVita, Diamondrock Hospitality, Digital Realty Trust, Dolby Labs, DraftKings, El Pollo Loco, EOG Resources, Expedia Group, Federal Realty, Five9, Floor & Decor, Fortinet, Fox Factory Holding, GoDaddy, Hologic, Huntsman, Illumina, Ingersoll-Rand, Kilroy Realty, Live Nation, MasTec, Motorola Solutions, MP Materials, Omega Health, Open Text, Opendoor Technologies, Paylocity, Pioneer Natural Resources, Post, Quaker Chemical, RE/MAX Holdings, Reinsurance Group of America, Rocket Companies, Ryan Specialty Group, Silicon Motion, SM Energy, Southwestern Energy, Tandem Diabetes Care, Texas Roadhouse, U.S. Steel, Universal Display, Viavi, Workiva, WW, Xenia Hotels & Xponential Fitness after the closing bell.
Friday winds the week down with U.S. Employment Report, U.S. Unemployment Rate, U.S. Hourly Wages & Hourly Wages Year-over-Year data at 8:30 am & Consumer Credit data at 3pm.
The earnings week rounds out with Adient, American Axle, Brookfield Renewable Partners, Cboe Global Markets, CBRE Group, Chart Industries, Cheniere Energy, Corebridge Financial, Essent Group, Fluor, Green Plains, Hershey Foods, Imperial Oil, Koppers Holdings, Newmark Group, Owens & Minor, Plains All American, Protolabs, Trimble, Uniti Group & XPO all scheduled to report before the opening bell.
See you back here next week!
*** I DO NOT OWN SHARES OR OPTIONS CONTRACT POSITIONS IN SPY, QQQ, IWM OR DIA AT THE TIME OF PUBLISHING THIS ARTICLE ***