With most market indexes sitting near all-time highs & the FOMC interest rate decision being announced tomorrow, it is worth taking a look at the strength of each support & resistance level of the major four indexes.
Doing so can help market participants be prepared if prices should go back to re-test each level, as it shows the sentiment that market participants had in recent history at the same valuation levels.
This document will focus on the support & resistance levels from the past year for SPY (S&P 500), QQQ (NASDAQ 100), IWM (Russell 2000) & DIA (Dow Jones Industrial Average); for a technical analysis of each index ETF’s recent performance please see yesterday’s note.
Each section below shows the past year’s chart for each of the above mentioned ETF’s, as well as tables listing their support & resistance levels, with what their historic volume sentiment has been at each, followed by a list of volume sentiments for price blocks that they have traded at.
SPY, QQQ & IWM has ~2-3 years worth of data in their numbers, while DIA has ~3-4 years worth of data for their numbers.
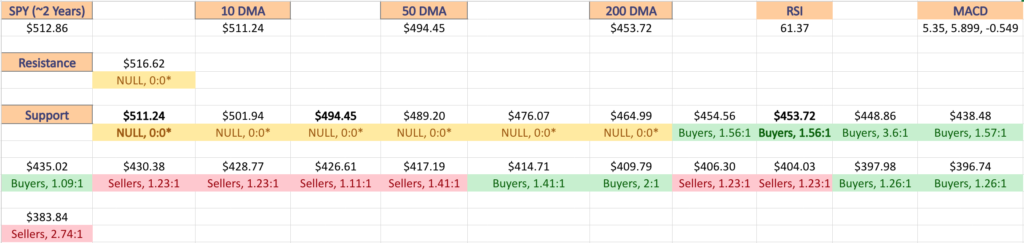
Note that “NULL, 0:0*” values denote areas that each name has traded at but with limited volume data to work with from a comparison standpoint in terms of creating a ratio of buyers:sellers (or vice versa).
Also, prices that do have a ratio of buyers:sellers (or vice versa) where the denominator is 0 are denoted with an asterisk “*” as well.
In the written lists of the price levels & volume sentiments the price levels that contain support & resistance levels are marked in BOLD.
This is not intended to serve as investing advice, but rather as a barometer or compass rose that can be added into your due diligence toolkit for added context in assessing the strength or weakness of upcoming support or resistance levels.
Price Level:Volume Sentiment Analysis For SPY (S&P 500) ETF
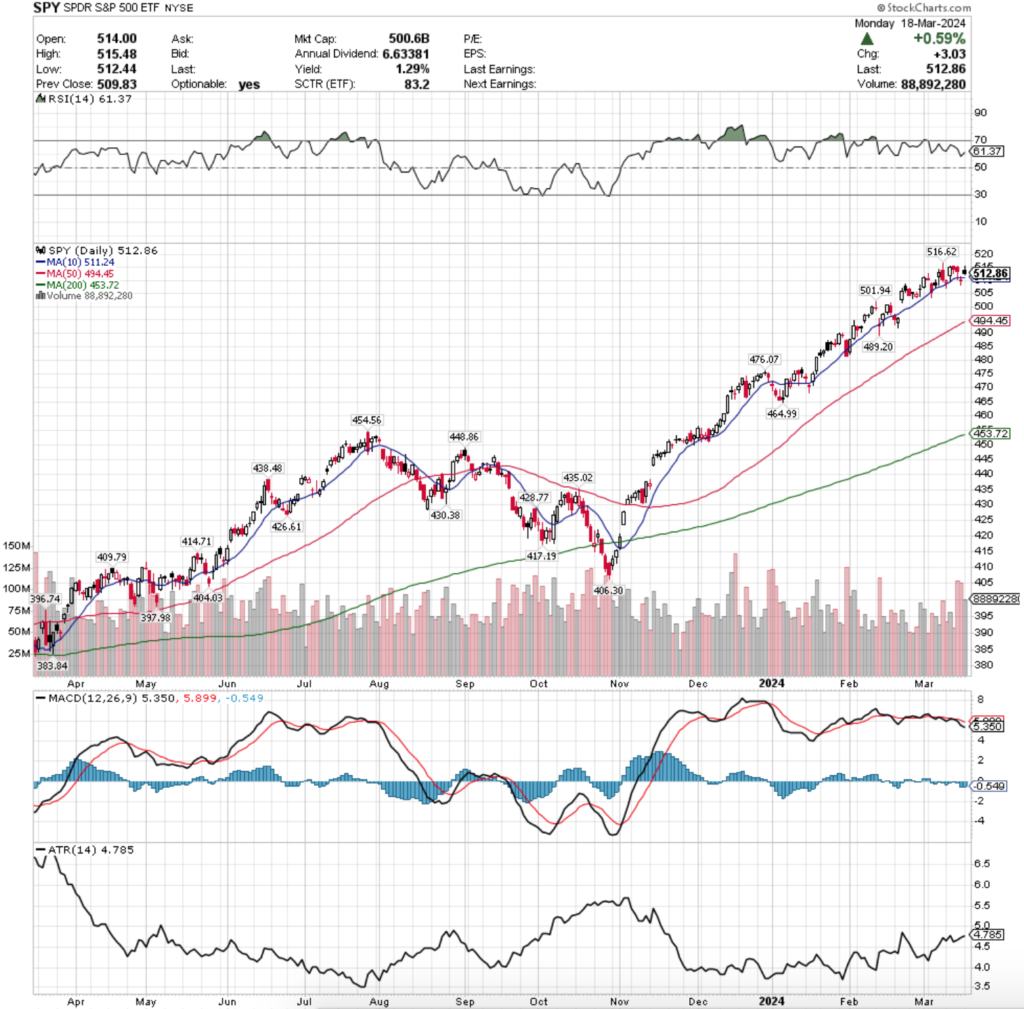
SPY, the SPDR S&P 500 ETF has seen consistent growth over the past year, advancing 32.59% (ex-distributions).
Due to their rapid ascent that began in November of 2023 their support touch-points are most densely situated near the bottom of their chart, which makes it important to have an idea as to how the ones closer to their current price will hold up in the event of a re-test.
Below is the price level:volume sentiment analysis for SPY using data from the past ~2-3 years.
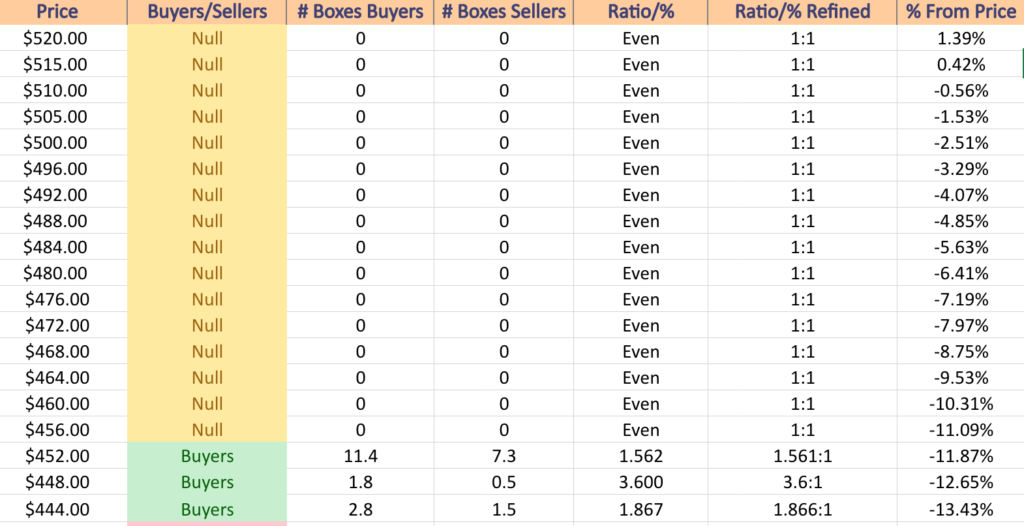
$520 – NULL – 0:0*; +1.39% From Monday’s Closing Level
$515 – NULL – 0:0*; +0.42% From Monday’s Closing Level
$510 – NULL – 0:0*; -0.56% From Monday’s Closing Level – Current Price Level & 10 Day Moving Average**
$505 – NULL – 0:0*; -1.53% From Monday’s Closing Level
$500 – NULL – 0:0*; -2.51% From Monday’s Closing Level
$496 – NULL – 0:0*; -3.29% From Monday’s Closing Level
$492 – NULL – 0:0*; -4.07% From Monday’s Closing Level – 50 Day Moving Average*
$488 – NULL – 0:0*; -4.85% From Monday’s Closing Level
$484 – NULL – 0:0*; -5.63% From Monday’s Closing Level
$480 – NULL – 0:0*; -6.41% From Monday’s Closing Level
$476 – NULL – 0:0*; -7.19% From Monday’s Closing Level
$472 – NULL – 0:0*; -7.97% From Monday’s Closing Level
$468 – NULL – 0:0*; -8.75% From Monday’s Closing Level
$464 – NULL – 0:0*; -9.53% From Monday’s Closing Level
$460 – NULL – 0:0*; -10.31% From Monday’s Closing Level
$456 – NULL – 0:0*; -11.09% From Monday’s Closing Level
$452 – Buyers – 1.56:1; -11.87% From Monday’s Closing Level – 200 Day Moving Average*
$448 – Buyers – 3.6:1; -12.65% From Monday’s Closing Level
$444 – Buyers – 1.87:1; -13.43% From Monday’s Closing Level
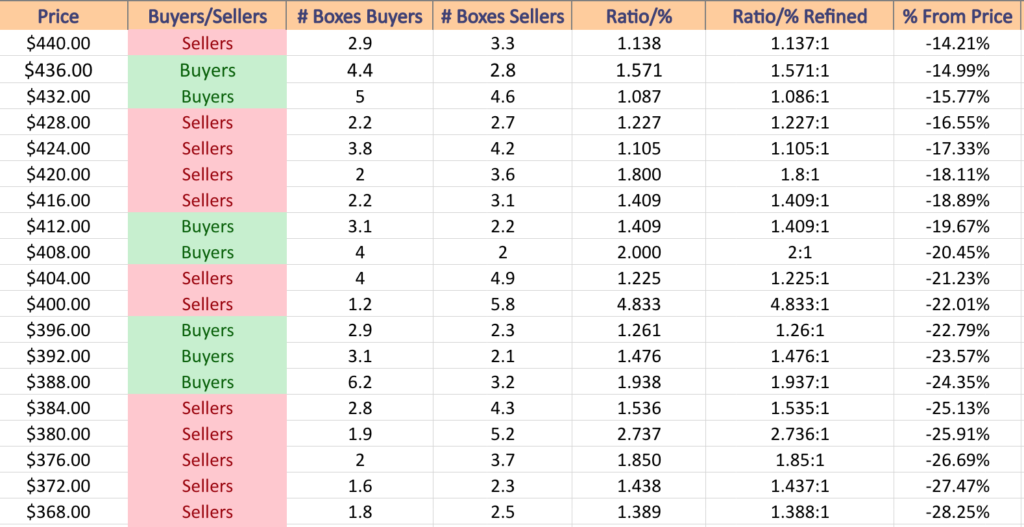
$440 – Sellers – 1.14:1; -14.21% From Monday’s Closing Level
$436 – Buyers – 1.57:1; -14.99% From Monday’s Closing Level
$432 – Buyers – 1.09:1; -15.77% From Monday’s Closing Level
$428 – Sellers – 1.23:1; -16.55% From Monday’s Closing Level
$424 – Sellers – 1.11:1; -17.33% From Monday’s Closing Level
$420 – Sellers – 1.8:1; -18.11% From Monday’s Closing Level
$416 – Sellers – 1.41:1; -18.89% From Monday’s Closing Level
$412 – Buyers – 1.41:1; -19.67% From Monday’s Closing Level
$408 – Buyers – 2:1; -20.45% From Monday’s Closing Level
$404 – Sellers – 1.23:1; -21.23% From Monday’s Closing Level
$400 – Sellers – 4.83:1; -22.01% From Monday’s Closing Level
$396 – Buyers – 1.26:1; -22.79% From Monday’s Closing Level
$392 – Buyers – 1.48:1; -23.57% From Monday’s Closing Level
$388 – Buyers – 1.94:1; -24.35% From Monday’s Closing Level
$384 – Sellers – 1.54:1; -25.13% From Monday’s Closing Level
$380 – Sellers – 2.74:1; -25.91% From Monday’s Closing Level
$376 – Sellers – 1.85:1; -26.69% From Monday’s Closing Level
$372 – Sellers – 1.44:1; -27.47% From Monday’s Closing Level
$368 – Sellers – 1.39:1; -28.25% From Monday’s Closing Level
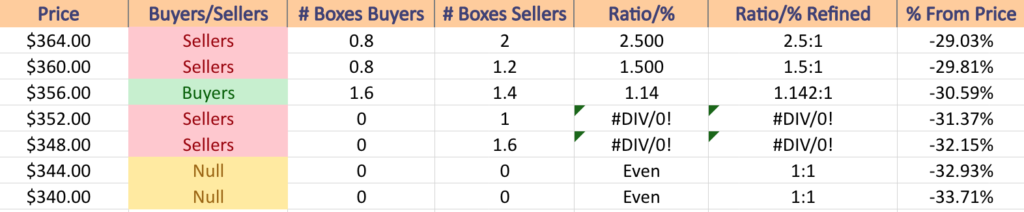
$364 – Sellers – 2.5:1; -29.03% From Monday’s Closing Level
$360 – Sellers – 1.5:1; -29.81% From Monday’s Closing Level
$356 – Buyers – 1.14:1; -30.59% From Monday’s Closing Level
$352 – Sellers – 1:0*; -31.37% From Monday’s Closing Level
$348 – Sellers – 1.6:0*; -32.93% From Monday’s Closing Level
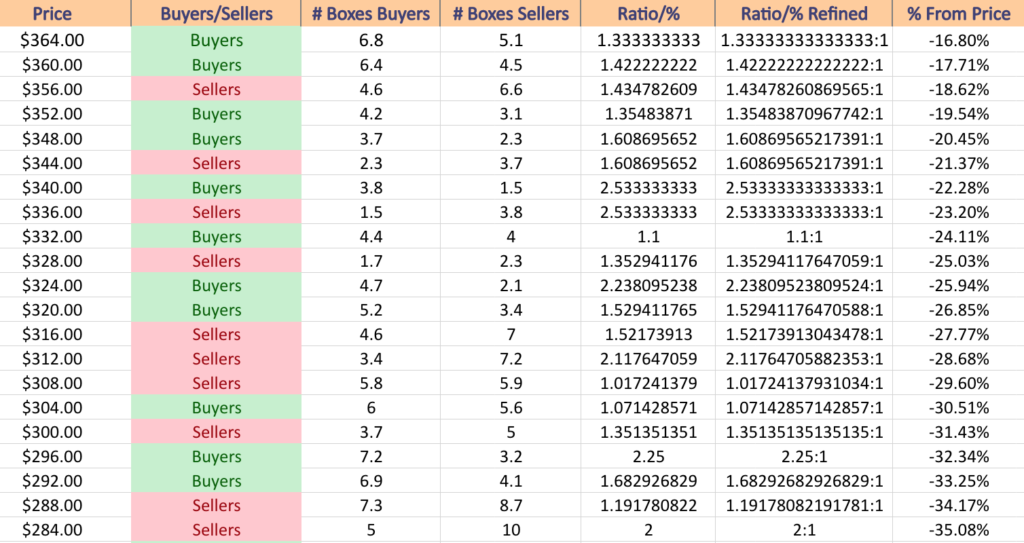
Price Level:Volume Sentiment Analysis For QQQ (NASDAQ 100) ETF
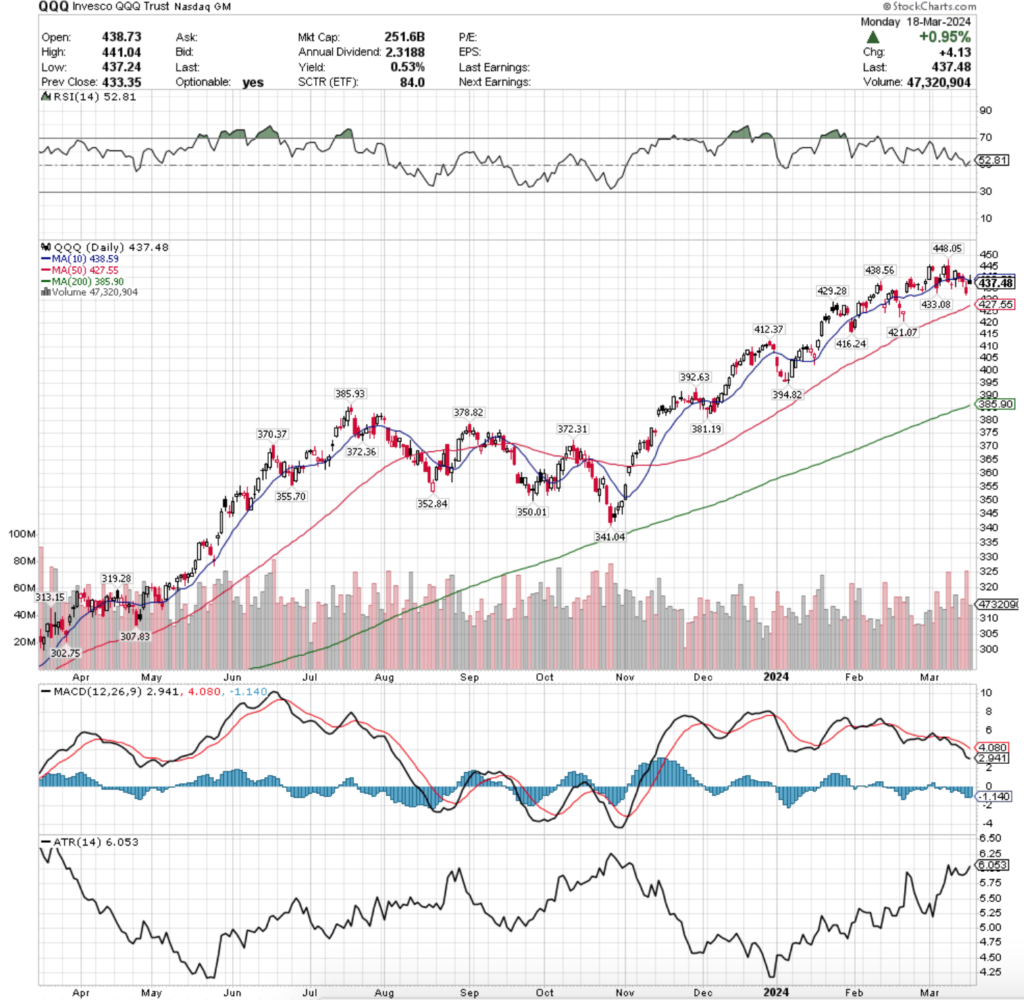
QQQ, the Invesco QQQ Trust ETF has also had a strong year, advancing +44.11% over the past year (ex-distributions).
They have made their gains in a less rapidly rising manner than SPY, which does give them more support closer to their current price, but given the nature of the tech-heavy index (QQQ) vs. the S&P 500 (SPY) it will be important to understand the strength of these touch-points.
QQQ is more at risk of a more serious decline based on fundamentals compared to SPY, making it worth reviewing the tables below.
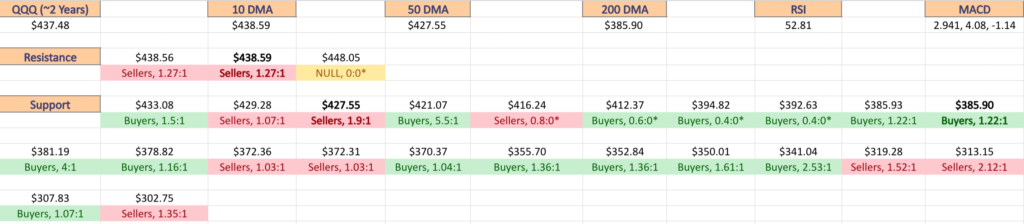
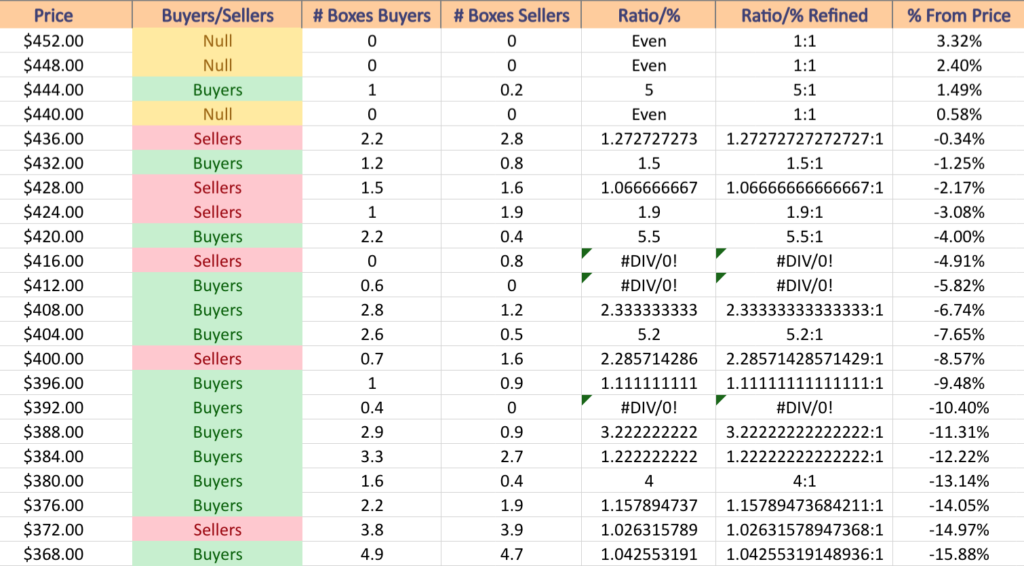
$452 – NULL – 0:0*; +3.32% From Monday’s Closing Level
$448 – NULL – 0:0*; +2.4% From Monday’s Closing Level
$444 – Buyers – 5:1; +1.49% From Monday’s Closing Level
$440 -NULL – 0:0*; +0.58% From Monday’s Closing Level
$436 – Sellers – 1.27:1; -0.34% From Monday’s Closing Level – Current Price Level & 10 Day Moving Average**
$432 – Buyers – 1.5:1; -1.25% From Monday’s Closing Level
$428 – Sellers – 1.07:1; -2.17% From Monday’s Closing Level
$424 – Sellers – 1.9:1; -3.08% From Monday’s Closing Level – 50 Day Moving Average*
$420 – Buyers – 5.5:1; -4% From Monday’s Closing Level
$416 – Sellers – 0.8:0*; -4.91% From Monday’s Closing Level
$412 – Buyers – 0.6:0*; -5.82% From Monday’s Closing Level
$408 – Buyers – 2.33:1; -6.74% From Monday’s Closing Level
$404 – Buyers – 5.2:1; -7.65% From Monday’s Closing Level
$400 – Sellers – 2.29:1; -8.57% From Monday’s Closing Level
$396 – Buyers – 1.11:1; -9.48% From Monday’s Closing Level
$392 – Buyers – 0.4:0*; -10.4% From Monday’s Closing Level
$388 – Buyers – 3.22:1; -11.31% From Monday’s Closing Level
$384 – Buyers – 1.22:1; -12.22% From Monday’s Closing Level – 200 Day Moving Average*
$380 – Buyers – 4:1; -13.14% From Monday’s Closing Level
$376 – Buyers – 1.16:1; -14.05% From Monday’s Closing Level
$372 – Sellers – 1.02:1; -14.97% From Monday’s Closing Level
$368 – Buyers – 1.04:1; -15.88% From Monday’s Closing Level
$364 – Buyers – 1.33:1; -16.8% From Monday’s Closing Level
$360 – Buyers – 1.42:1; -17.71% From Monday’s Closing Level
$356 – Sellers – 1.44:1; -18.62% From Monday’s Closing Level
$352 – Buyers – 1.36:1; -19.54% From Monday’s Closing Level
$348 – Buyers – 1.61:1; -20.45% From Monday’s Closing Level
$344 – Sellers – 1.61:1; -21.37% From Monday’s Closing Level
$340 – Buyers – 2.53:1; -22.28% From Monday’s Closing Level
$336 – Sellers – 2.53:1; -23.2% From Monday’s Closing Level
$332 – Buyers – 1.1:1; -24.11% From Monday’s Closing Level
$328 – Sellers – 1.36:1; -25.03% From Monday’s Closing Level
$324 – Buyers -2.24:1; -25.94% From Monday’s Closing Level
$320 – Buyers – 1.53:1; -26.85% From Monday’s Closing Level
$316 – Sellers – 1.52:1; -27.77% From Monday’s Closing Level
$312 – Sellers – 2.12:1; -28.68% From Monday’s Closing Level
$308 – Sellers – 1.02:1; -29.6% From Monday’s Closing Level
$304 – Buyers – 1.07:1; -30.51% From Monday’s Closing Level
$300 – Sellers – 1.35:1; -31.43% From Monday’s Closing Level
$296 – Buyers – 2.25:1; -32.34% From Monday’s Closing Level
$292 – Buyers – 1.68:1; -33.25% From Monday’s Closing Level
$288 – Sellers – 1.19:1; -34.17% From Monday’s Closing Level
$284 – Sellers – 2:1; -35.08% From Monday’s Closing Level
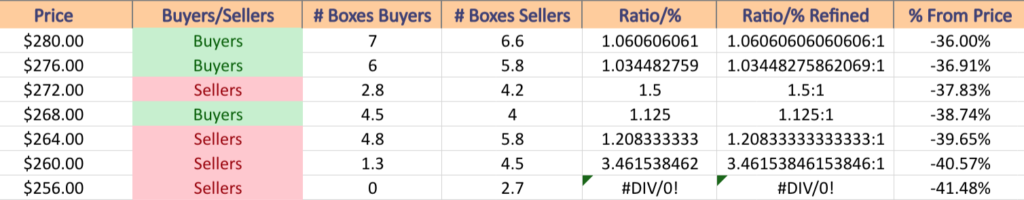
$280 – Buyers – 1.06:1; -36% From Monday’s Closing Level
$276 – Buyers – 1.03:1; -36.91% From Monday’s Closing Level
$272 – Sellers – 1.5:1; -37.83% From Monday’s Closing Level
$268 – Buyers – 1.13:1; -38.74% From Monday’s Closing Level
$264 – Sellers – 1.21:1; -39.65% From Monday’s Closing Level
$260 – Sellers – 3.46:1; -40.57% From Monday’s Closing Level
$256 – Sellers – 2.7:0*; -41.48% From Monday’s Closing Level
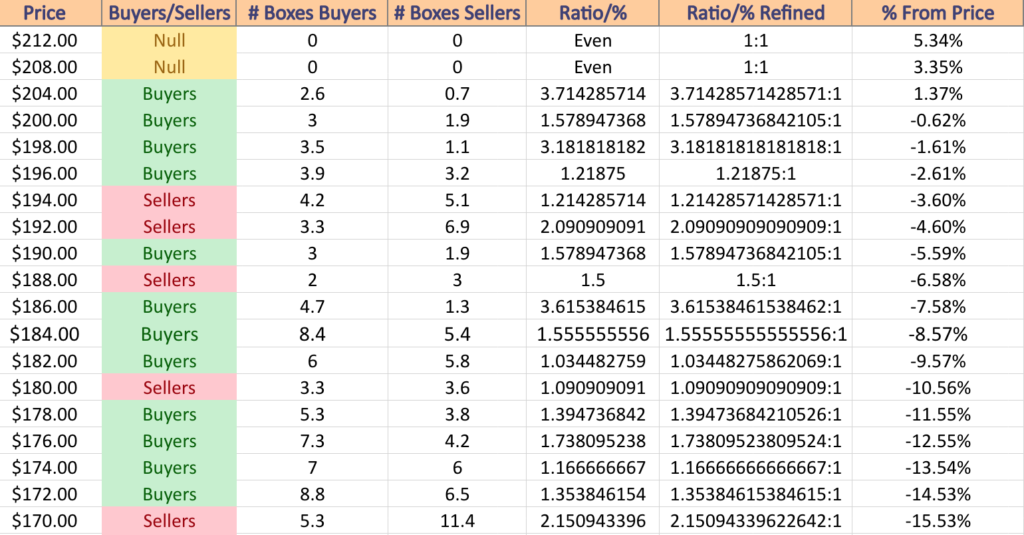
Price Level:Volume Sentiment Analysis For IWM (Russell 2000) ETF
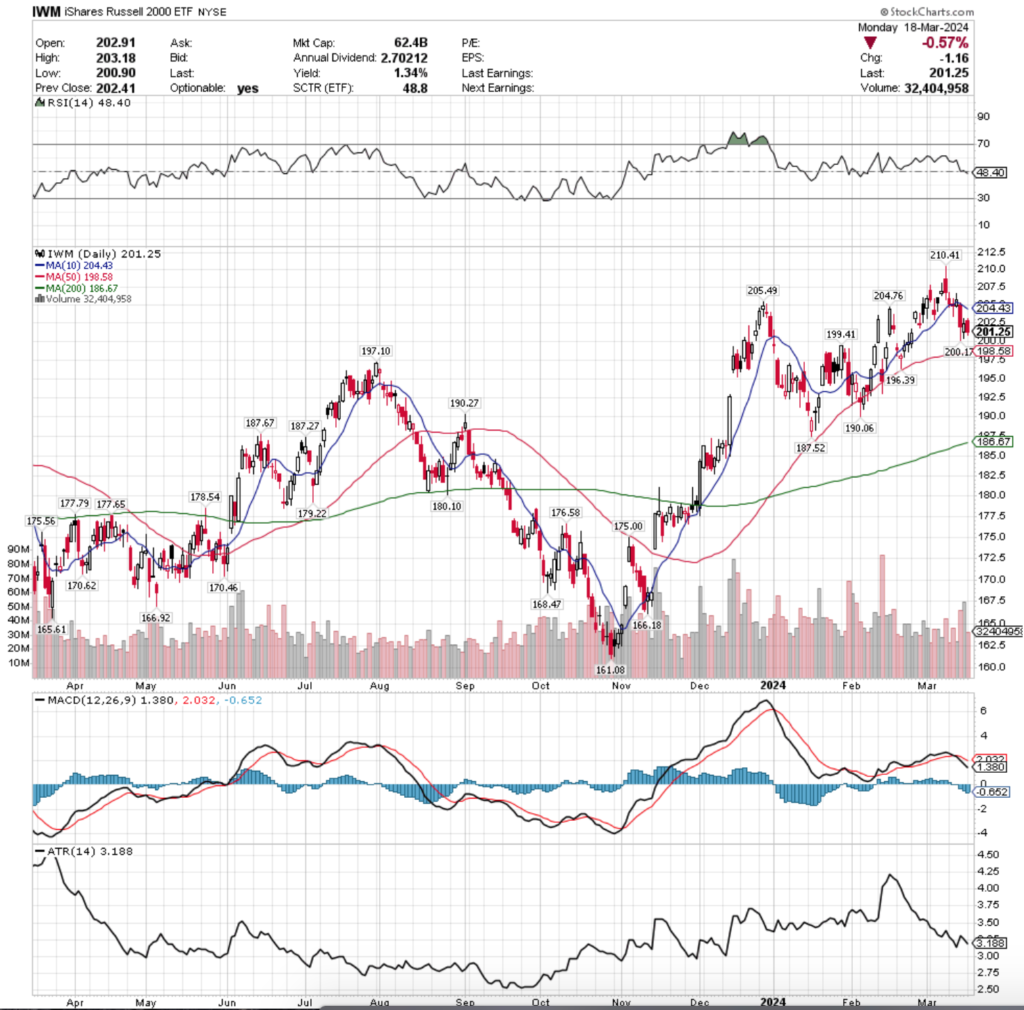
IWM, the iShares Russell 2000 ETF has advanced +18.5% over the past year, as it tends to oscillate more around a centralized price level compared to the rapid uphill sloped growth of SPY or QQQ.
This provides it with more support levels between its current price & its 52-week low than the previous two index ETFs have in the event of a near-term correction.
However, due to the nature of small caps, in a larger move downward across the board they will not be immune from declines & as a result the tables below are important to review.
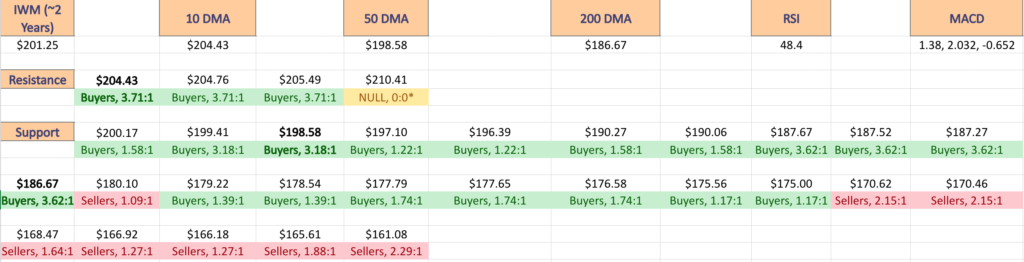
$212 – NULL – 0:0*; +5.34% From Monday’s Closing Level
$208 – NULL – 0:0*; +3.35% From Monday’s Closing Level
$204 – Buyers – 3.71:1; +1.37% From Monday’s Closing Level – 10 Day Moving Average*
$200 – Buyers – 1.58:1; -0.62% From Monday’s Closing Level – Current Price Level*
$198 – Buyers – 3.18:1; -1.61% From Monday’s Closing Level – 50 Day Moving Average*
$196 – Buyers – 1.22:1; -2.61% From Monday’s Closing Level
$194 – Sellers – 1.21:1; -3.6% From Monday’s Closing Level
$192 – Sellers – 2.09:1; -4.6% From Monday’s Closing Level
$190 – Buyers – 1.58:1; -5.59% From Monday’s Closing Level
$188 – Sellers – 1.5:1; -6.58% From Monday’s Closing Level
$186 – Buyers – 3.62:1; -7.58% From Monday’s Closing Level – 200 Day Moving Average*
$184 – Buyers – 1.56:1; -8.57% From Monday’s Closing Level
$182 – Buyers – 1.03:1; -9.57% From Monday’s Closing Level
$180 – Sellers – 1.09:1; -10.56% From Monday’s Closing Level
$178 – Buyers – 1.40:1; -11.55% From Monday’s Closing Level
$176 – Buyers – 1.74:1; -12.55% From Monday’s Closing Level
$174 – Buyers – 1.17:1; -13.54% From Monday’s Closing Level
$172 – Buyers – 1.35:1; -14.53% From Monday’s Closing Level
$170 – Sellers – 2.15:1; -15.53% From Monday’s Closing Level
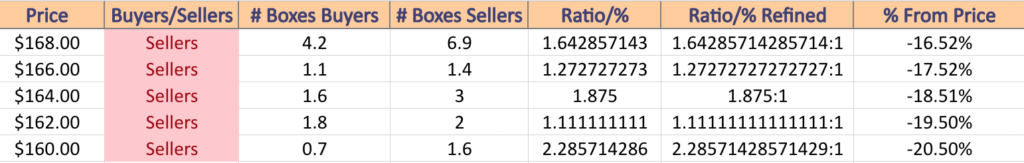
$168 – Sellers – 1.64:1; -16.52% From Monday’s Closing Level
$166 – Sellers – 1.27:1; -17.52% From Monday’s Closing Level
$164 – Sellers – 1.88:1; -18.51% From Monday’s Closing Level
$162 – Sellers – 1.11:1; -19.5% From Monday’s Closing Level
$160 – Sellers – 2.29:1; -20.5% From Monday’s Closing Level
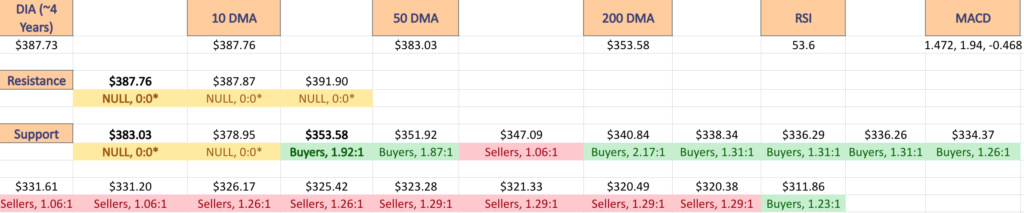
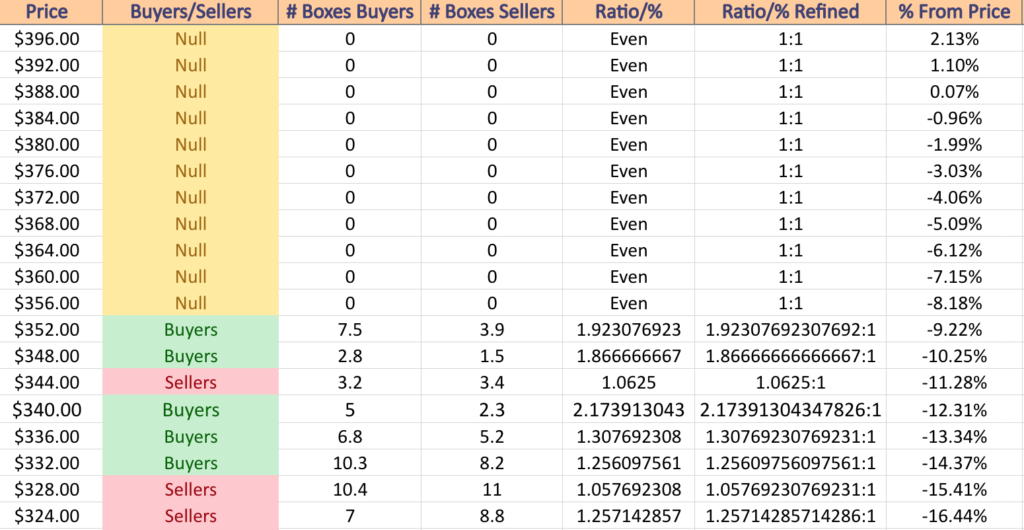
Price Level:Volume Sentiment Analysis For DIA (Dow Jones Industrial Average) ETF
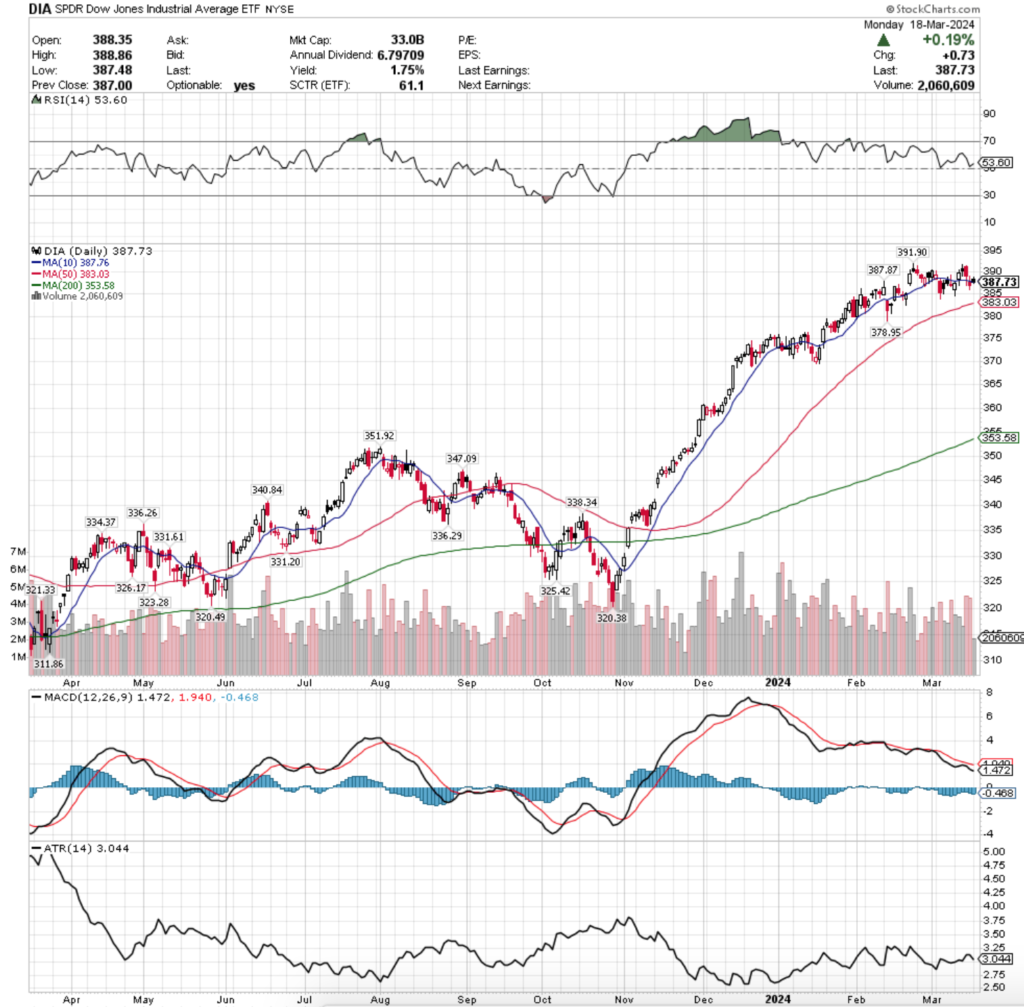
DIA, the SPDR Dow Jones Industrial Average ETF has advanced +23.55% over the past year (ex-distributions & much like SPY its current support levels are primarily concentrated well below its current price level in the wake of the rally that kicked off in November of 2023.
While DIA houses some of the largest stocks in the market, they are not immune to declines & investors should be prepared for how they may behave at the support levels outlined below in the event of a near-term re-test.
$396 – NULL – 0:0*; +2.13% From Monday’s Closing Level
$392 – NULL – 0:0*; +1.1% From Monday’s Closing Level
$388 – NULL – 0:0*; +0.07% From Monday’s Closing Level
$384 – NULL – 0:0*; -0.96% From Monday’s Closing Level – Current Price Level & 10 Day Moving Average**
$380 -NULL – 0:0*; -1.99% From Monday’s Closing Level – 50 Day Moving Average*
$376 – NULL – 0:0*; -3.03% From Monday’s Closing Level
$372 – NULL – 0:0*; -4.06% From Monday’s Closing Level
$368 – NULL – 0:0*; -5.09% From Monday’s Closing Level
$364 – NULL – 0:0*; -6.12% From Monday’s Closing Level
$360 – NULL – 0:0*; -7.15% From Monday’s Closing Level
$356 – NULL – 0:0*; -8.18% From Monday’s Closing Level
$352 – Buyers – 1.92:1; -9.22% From Monday’s Closing Level – 200 Day Moving Average*
$348 – Buyers – 1.87:1; -10.25% From Monday’s Closing Level
$344 – Sellers – 1.06:1; -11.28% From Monday’s Closing Level
$340 – Buyers – 2.17:1; -12.31% From Monday’s Closing Level
$336 – Buyers – 1.31:1; -13.34% From Monday’s Closing Level
$332 – Buyers – 1.26:1; -14.37% From Monday’s Closing Level
$328 – Sellers – 1.06:1; -15.41% From Monday’s Closing Level
$324 – Sellers – 1.26:1; -16.44% From Monday’s Closing Level
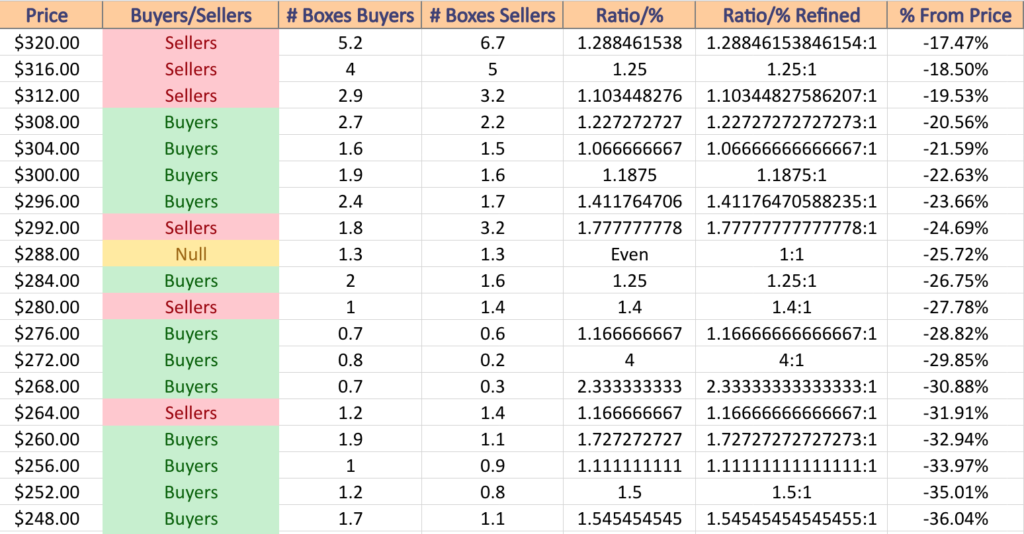
$320 – Sellers – 1.29:1; -17.47% From Monday’s Closing Level
$316 – Sellers – 1.25:1; -18.5% From Monday’s Closing Level
$312 – Sellers – 1.1:1; -19.53% From Monday’s Closing Level
$308 – Buyers – 1.23:1; -20.56% From Monday’s Closing Level
$304 – Buyers – 1.07:1; -21.59% From Monday’s Closing Level
$300 – Buyers – 1.19:1; -22.63% From Monday’s Closing Level
$296 – Buyers – 1.41:1; -23.66% From Monday’s Closing Level
$292 – Sellers – 1.78:1; -24.69% From Monday’s Closing Level
$288 – Even – 1:1; -25.72% From Monday’s Closing Level
$284 – Buyers – 1.25:1; -26.75% From Monday’s Closing Level
$280 – Sellers – 1.4:1; -27.78% From Monday’s Closing Level
$276 – Buyers – 1.17:1; -28.82% From Monday’s Closing Level
$272 – Buyers – 4:1; -29.85% From Monday’s Closing Level
$268 – Buyers – 2.33:1; -30.88% From Monday’s Closing Level
$264 – Sellers – 1.17:1; -31.91% From Monday’s Closing Level
$260 – Buyers – 1.72:1; -32.94% From Monday’s Closing Level
$256 – Buyers – 1.11:1; -33.97% From Monday’s Closing Level
$252 – Buyers – 1.5:1; -35.01% From Monday’s Closing Level
$248 – Buyers – 1.55:1; -36.04% From Monday’s Closing Level
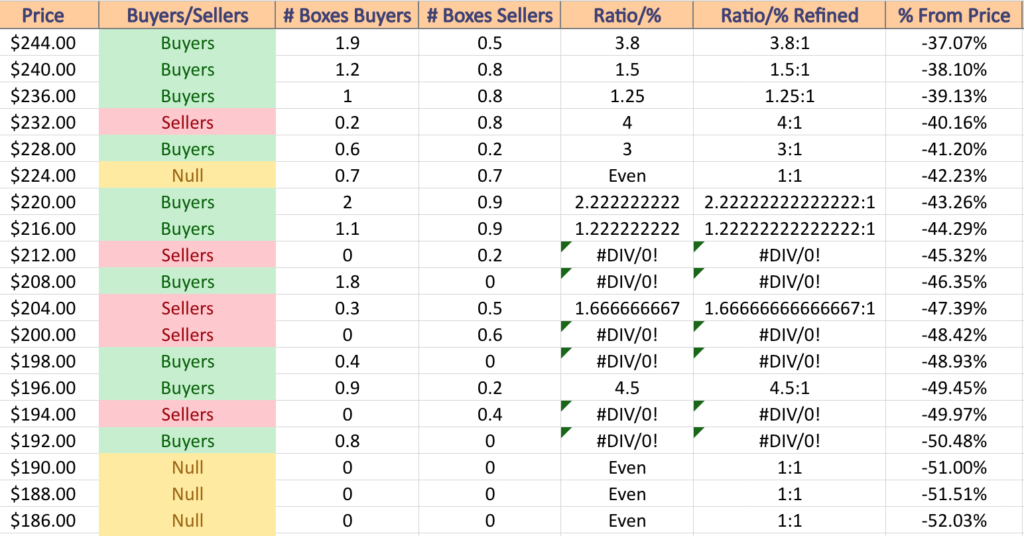
$244- Buyers – 3.8:1; -37.07% From Monday’s Closing Level
$240 – Buyers – 1.5:1; -38.1% From Monday’s Closing Level
$236 – Buyers – 1.25:1; -39.13% From Monday’s Closing Level
$232 – Sellers – 4:1; -40.16% From Monday’s Closing Level
$228 – Buyers – 3:1; -41.2% From Monday’s Closing Level
$224 – Even – 1:1; -42.23% From Monday’s Closing Level
$220 – Buyers – 2.22:1; -43.26% From Monday’s Closing Level
$216 – Buyers – 1.22:1; -44.29% From Monday’s Closing Level
$212 – Sellers – 0.2:0*; -45.32% From Monday’s Closing Level
$208 – Buyers – 1.8:0*; -46.35% From Monday’s Closing Level
$204 – Sellers – 1.67:1; -47.39% From Monday’s Closing Level
$200 – Sellers – 0.6:0*; -48.42% From Monday’s Closing Level
$198 – Buyers – 0.4:0*; -48.93% From Monday’s Closing Level
$196 – Buyers – 4.5:1; -49.45% From Monday’s Closing Level
$194 – Sellers – 0.4:0*; -49.97% From Monday’s Closing Level
$192 – Buyers – 0.8:0*; -50.48% From Monday’s Closing Level
*** I DO NOT OWN SHARES OR OPTIONS CONTRACT POSITIONS IN SPY, QQQ, IWM OR DIA AT THE TIME OF PUBLISHING THIS ARTICLE ***