With major market indexes retreating from recently reached all-time highs & recent volatility in the energy sector, it’s a good time to check in with how XLE, the Energy Select Sector SPDR ETF is performing.
A major part of that is understanding its historic volume sentiments at recent key support & resistance levels.
Before going any further, I own a long in-the-money puts position in XLE that I initiated this past Friday at the open.
Below is a brief technical analysis of XLE’s past year performance, as well as a list of their volume sentiment at the different price levels they’ve traded at over the past 2-3 years.
This is not a specific recommendation, nor is it a substitute for performing your own due diligence, but rather it is meant to be an extra tool to take into consideration while making your own assessment of XLE.
Brief Technical Analysis Of XLE, The Energy Select Sector SPDR ETF
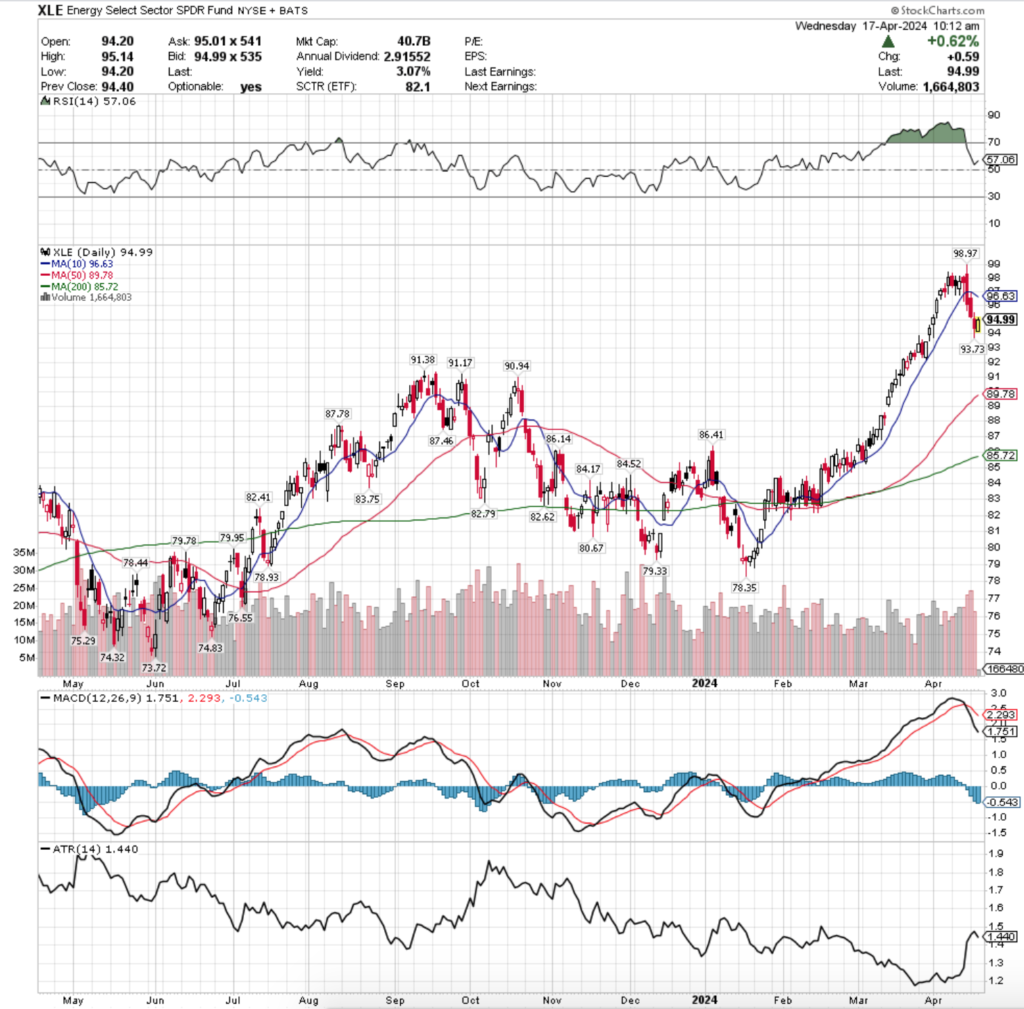
XLE is recently coming off of a new 52-week high that it reached last week & has since been in decline.
Their RSI is currently 57.06, which is relatively neutral, while their MACD is bearish in the wake of said declines.
Volumes over this past week have been +10.96% above average compared to the year prior (21,014,420 vs. 18,937,925, not including today’s session’s data*), as market participants have been eager to take profits from their recent price run up that began in January of 2024.
Due to the velocity of their recent ascent there are limited support levels in near proximity to the current share price & the 10 day moving average has curled over bearishly & is now applying downwards pressure on XLE’s share price.
Their next resistance level is ~1% away & after that there is a support zone is -3.8% below the current price ($94.99 at the time of writing this).
Today’s session is currently showing a bit of relief in the wake of the sell off of the past handful of days, but there is still risk-off sentiment in the near-term based on the lower shadow of yesterday’s session & today’s open kicking off below the close of yesterday’s session.
This makes it even more important to have an understanding of how market participants have behaved at different price levels XLE has traded at in the recent past.
Price Level:Volume Sentiment For XLE Over The Past 2-3 Years
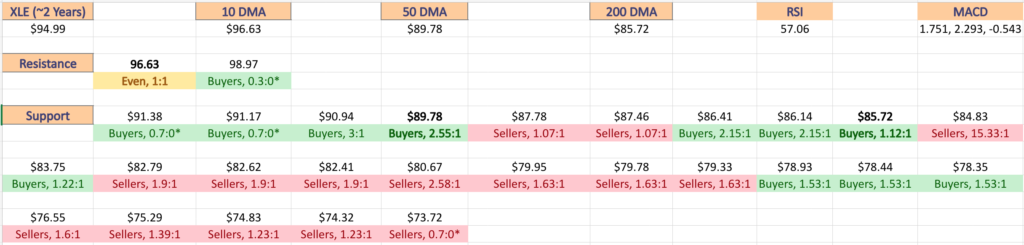
Below is a list of the one year support & resistance levels, with the 10, 50 & 200 day moving averages denoted in bold & the Buyer:Seller sentiment ratio beneath each price level.
The images that follow it list out the volume sentiment for each price level that XLE has traded at over the past 2-3 years.
These ratios can be used to make an assessment about how strong a particular support or resistance level may be, based on how buyers & sellers have behaved there in the recent past.
There is also a list typed out below it with the same table information, where the bold prices indicate a support/resistance level.
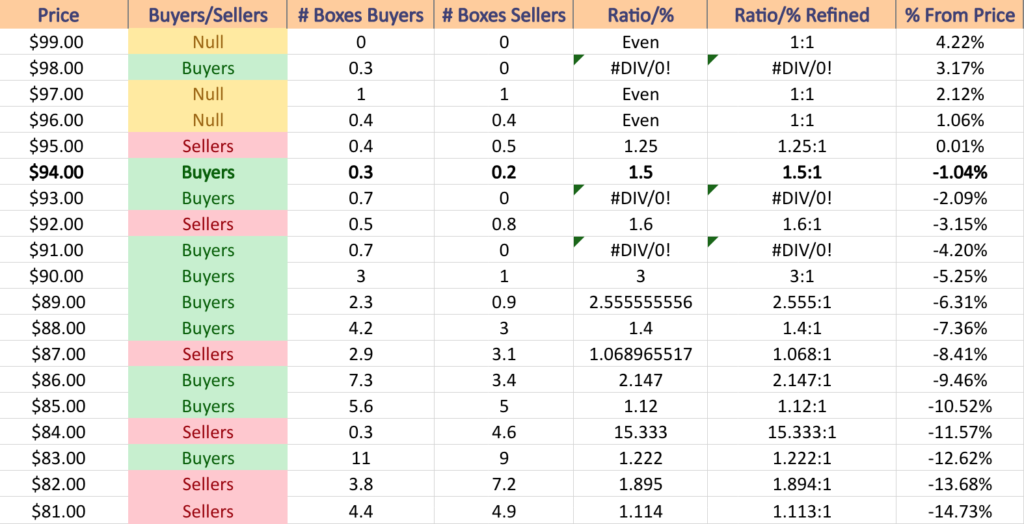
$99 – NULL – 0:0*; +4.22% From Current Price
$98 – Buyers – 0.3:0*; +3.17% From Current Price
$97 – Even – 1:1; +2.12% From Current Price
$96 – Even – 1:1; +1.06% From Current Price – 10 Day Moving Average*
$95 – Sellers – 1.25:1; +0.01% From Current Price
$94 – Buyers – 1.5:1; -1.04% From Current Price – Current Price Level*
$93 – Buyers – 0.7:0*; -2.09% From Current Price
$92 – Sellers – 1.6:1; -3.15% From Current Price
$91 – Buyers – 0.7:0*; -4.2% From Current Price
$90 – Buyers – 3:1; -5.25% From Current Price
$89 – Buyers – 2.56:1; -6.31% From Current Price – 50 Day Moving Average*
$88 – Buyers – 1.4:1; -7.36% From Current Price
$87 – Sellers – 1.07:1; -8.41% From Current Price
$86 – Buyers – 2.15:1; -9.46% From Current Price
$85 – Buyers – 1.12:1; -10.52% From Current Price – 200 Day Moving Average*
$84 – Sellers – 15.33:1; -11.57% From Current Price
$83 – Buyers- 1.22:1; -12.62% From Current Price
$82 – Sellers – 1.89:1; -13.68% From Current Price
$81 – Sellers – 1.11:1; -14.73% From Current Price
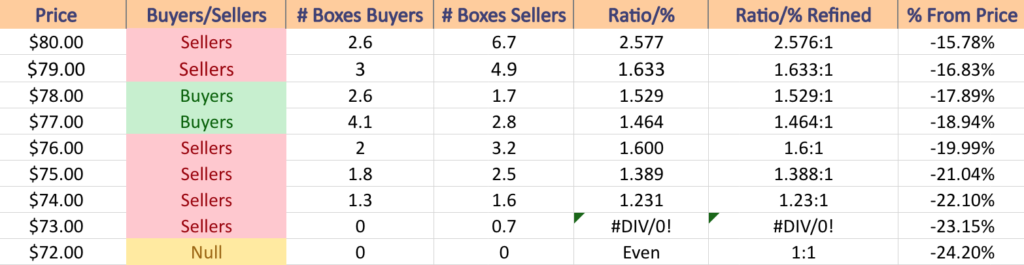
$80 – Sellers – 2.58:1; -15.78% From Current Price
$79 – Sellers – 1.63:1; -16.83% From Current Price
$78 – Buyers – 1.53:1; -17.89% From Current Price
$77 – Buyers – 1.46:1; -18.94% From Current Price
$76 – Sellers – 1.6:1; -19.99% From Current Price
$75 – Sellers – 1.39:1; -21.04% From Current Price
$74 – Sellers – 1.23:1; -22.1% From Current Price
$73 – Sellers – 0.7:0*; -23.15% From Current Price
$72 – NULL – 0:0*; -24.27% From Current Price
*** I CURRENTLY OWN A LONG, IN-THE-MONEY PUT POSITION IN XLE AT THE TIME OF PUBLISHING THIS ARTICLE ***