One month after reaching a new all-time high, it is worth taking a look at how market participants have behaved at different support & resistance levels for XLF, the Financial Select Sector SPDR Fund ETF.
Having an understanding of how investors have behaved at these levels historically is beneficial in the event that there is further consolidation in XLF & the price levels are re-tested.
Below is a brief technical analysis of XLF’s past year performance, as well as a list of their volume sentiment at the various price levels that they have traded at over the past ~15 years.
This is not a specific recommendation, nor is it a substitute for performing your own due diligence, but rather it is meant to be an extra tool that you can take into consideration while making your own assessment of XLF.
Brief Technical Analysis Of XLF, The Financial Select Sector SPDR Fund ETF
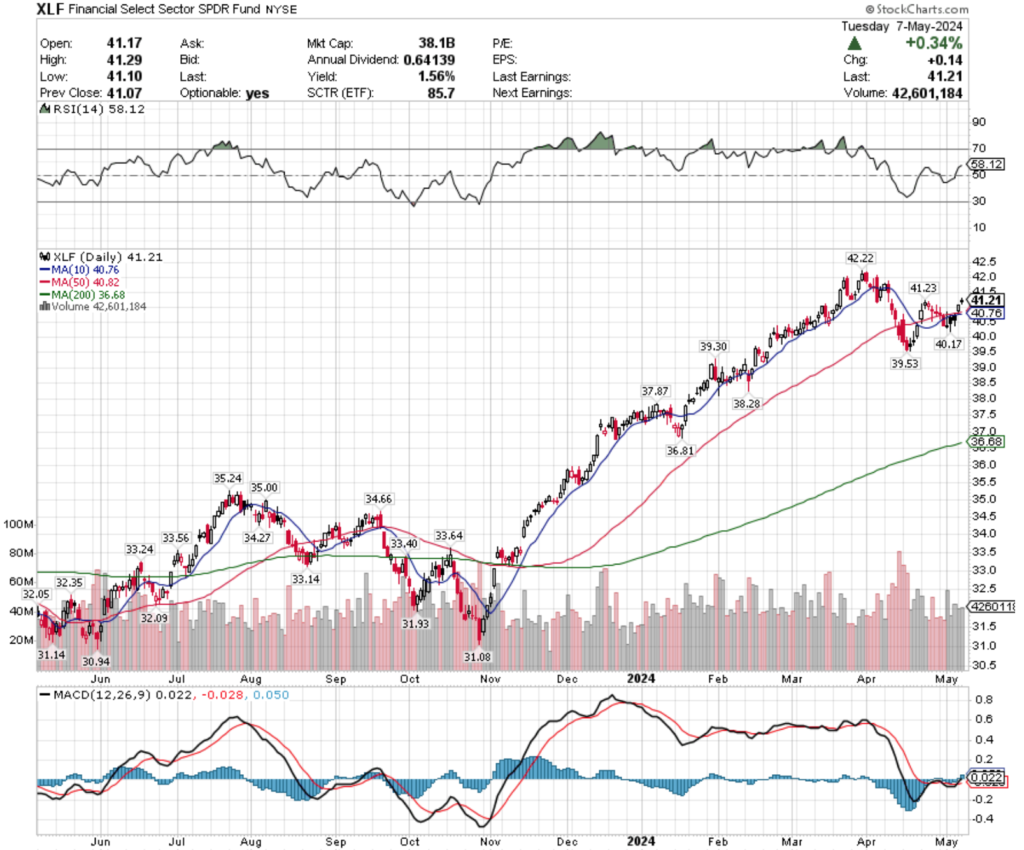
XLF has advanced +29.53% over the past year (ex-distributions), adding +31.41% since their 52-week low in October of 2023 & having declined -2.39% since their 52-week high in March of 2024.
Volumes over the past week were -0.25% below average compared to the year prior (42,704,000 vs. 42,812,205.16), as prices continued a consolidation that began in April.
Their RSI is currently 58.12 & beginning to show signs of weakness, while their MACD is bullish, but relatively muted & not showing signals of strength.
Over the past week XLF has staged a turnaround from the declines of the previous five sessions, beginning last Wednesday with a spinning top candle that’s upper shadow tested & briefly went above the resistance of the 10 & 50 day moving averages.
Thursday of last week resulted in a brief advance, but it should be noted that the session closed lower than it opened & was again denied by the 10 & 50 day moving averages.
Friday followed in the footsteps of Wednesday & Thursday’s sessions, as XLF pushed higher on the open, only to close lower than it had opened; however it should be noted that a weak uptrend was established.
Monday kicked this week off with a bang, as XLF opened above the support of the 10 & 50 day moving averages & pushed higher.
Yesterday proved to be an area to keep an eye on for XLF though, as the session gapped higher on the open & closed in a spinning top candle that set up a dark cloud cover formation (bearish).
Today all eyes will be on whether or not an evening star pattern is formed with the past three days’ candles & if so, where today’s session closes in relation to the 10 & 50 day moving averages’ support.
The past two days’ volumes were lower than Friday’s volume, although they have been higher than those posted in the last week of April.
Given that the sessions have resulted in advances in this past week, it now will come down to whether further consolidation on these average volumes continues, or if there will be some profit taking from the advances of the past week.
It will also be worth keeping an eye on the 10 & 50 DMAs, in particular to see how strong they prove to be as support levels.
The 50 is currently still above the 10, which means if prices do dip below both there will be two moving averages applying downwards pressure on prices in the form of resistance.
XLF’s Average True Range (not shown) is near the neutral middle of its range, indicating that there may be another round of volatility on the near-term horizon.
Price Level:Volume Sentiment For XLF Over The Past ~15 Years
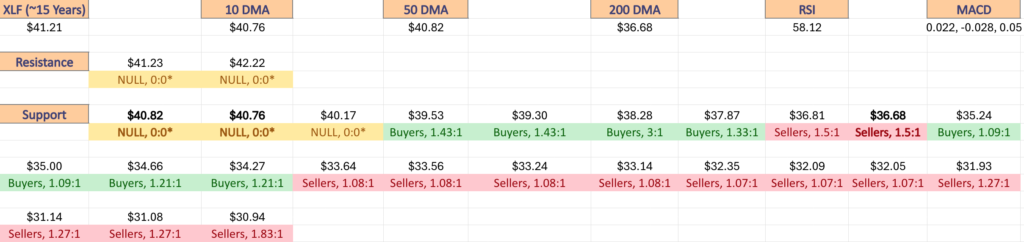
Below is a list of the one year support & resistance levels, with the 10, 50 & 200 day moving averages denoted in bold & the Buyer:Seller sentiment ratio beneath each price level.
The images that follow it list out the volume sentiment for each price level that XLF has traded at over the past ~15 years.
These ratios can be used to make an assessment about how strong a particular support or resistance level may be, based on how buyers & sellers have behaved there in the recent past.
There is also a list typed out below it with the same table information, where the bold prices indicate a support/resistance level.
Note that due to price extremes (being near the all-time high) some price levels do not have enough data yet & are marked as NULL 0:0*, while other high levels will be skewed towards buyers, as there has not been much in terms of downside tests against them.
This is something that should be kept in mind when working with the data below.
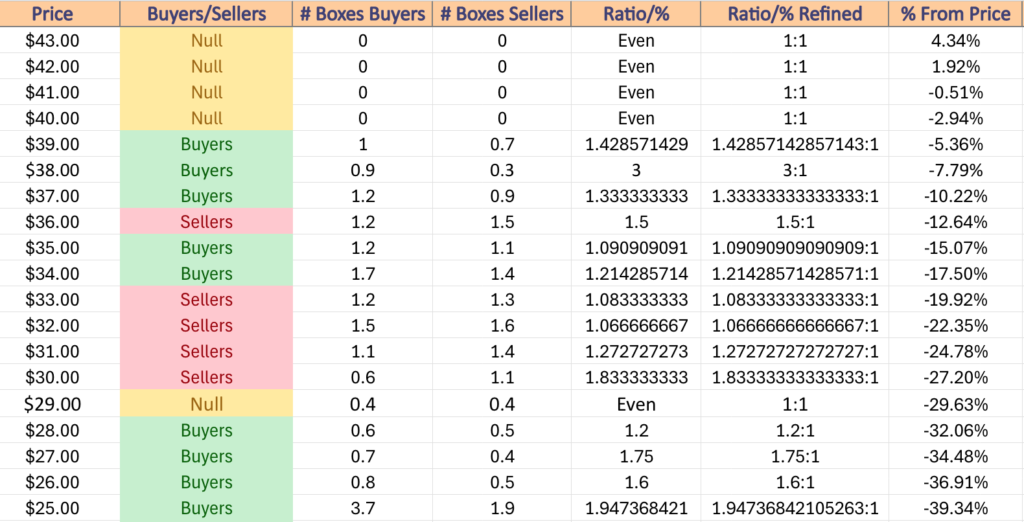
$43 – NULL – 0:0*, +4.34% From Current Price Level
$42 – NULL – 0:0*, +1.92% From Current Price Level
$41 – NULL – 0:0*, -0.51% From Current Price Level – Current Price Level*
$40 – NULL – 0:0*, -2.94% From Current Price Level – 10 & 50 Day Moving Averages**
$39 – Buyers – 1.43:1, -5.36% From Current Price Level
$38 – Buyers – 3:1, -7.79% From Current Price Level
$37 – Buyers – 1.33:1, -10.22% From Current Price Level
$36 – Sellers – 1.5:1, -12.64% From Current Price Level – 200 Day Moving Average*
$35 – Buyers – 1.09:1, -15.07% From Current Price Level
$34 – Buyers – 1.21:1, -17.5% From Current Price Level
$33 – Sellers – 1.08:1, -19.92% From Current Price Level
$32 – Sellers – 1.07:1, -22.35% From Current Price Level
$31 – Sellers – 1.27:1, -24.78% From Current Price Level
$30 – Sellers – 1.83:1, -27.2% From Current Price Level
$29 – Even – 1:1, -29.63% From Current Price Level
$28 – Buyers – 1.2:1, -32.06% From Current Price Level
$27 – Buyers – 1.75:1, -34.48% From Current Price Level
$26 – Buyers – 1.6:1, -36.91% From Current Price Level
$25 – Buyers – 1.95:1, -39.34% From Current Price Level
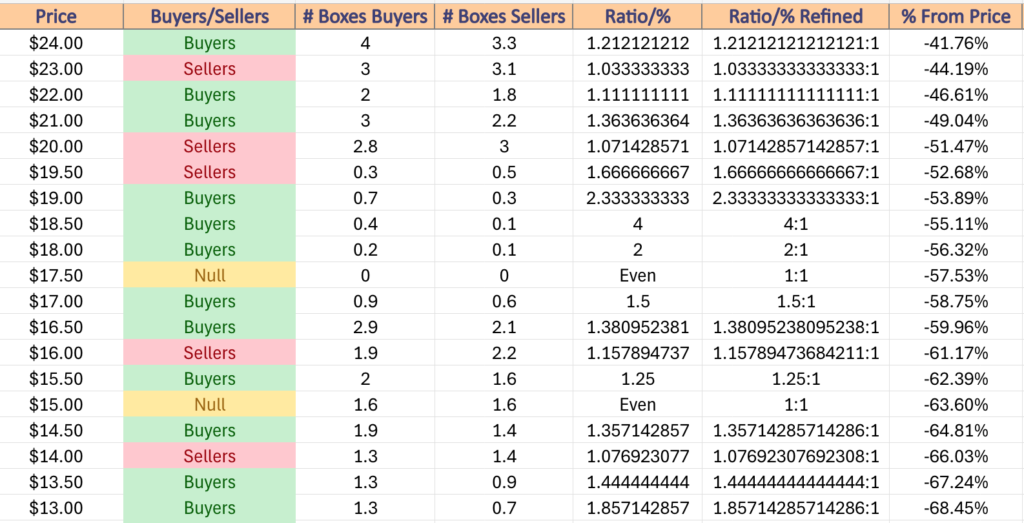
$24 – Buyers – 1.21:1, -41.76% From Current Price Level
$23 – Sellers – 1.03:1, -44.19% From Current Price Level
$22 – Buyers – 1.11:1, -46.61% From Current Price Level
$21 – Buyers – 1.36:1, -49.04% From Current Price Level
$20 – Sellers – 1.07:1, -51.47% From Current Price Level
$19.50 – Sellers – 1.67:1, -52.68% From Current Price Level
$19 – Buyers – 2.33:1, -53.89% From Current Price Level
$18.50 – Buyers – 4:1, -55.11% From Current Price Level
$18 – Buyers – 2:1, -56.32% From Current Price Level
$17.50 – NULL – 0:0*, -57.53% From Current Price Level
$17 – Buyers – 1.5:1, -58.75% From Current Price Level
$16.50 – Buyers – 1.38:1, -59.96% From Current Price Level
$16 – Sellers – 1.16:1, -61.17% From Current Price Level
$15.50 – Buyers – 1.25:1, -62.39% From Current Price Level
$15 – Even – 1:1, -63.6% From Current Price Level
$14.50 – Buyers – 1.36:1, -64.81% From Current Price Level
$14 – Sellers – 1.08:1, -66.03% From Current Price Level
$13.50 – Buyers – 1.44:1, -67.24% From Current Price Level
$13 – Buyers – 1.86:1, -68.45% From Current Price Level
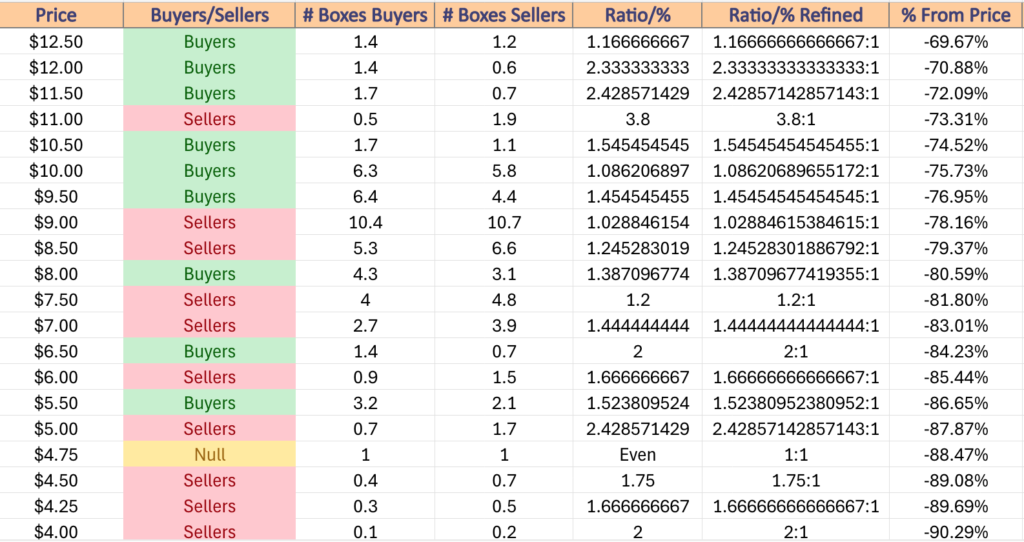
$12.50 – Buyers – 1.17:1, -69.67% From Current Price Level
$12 – Buyers – 2.33:1, -70.88% From Current Price Level
$11.50 – Buyers – 2.43:1, -72.09% From Current Price Level
$11 – Sellers – 3.8:1, -73.31% From Current Price Level
$10.50 – Buyers – 1.55:1, -74.52% From Current Price Level
$10 – Buyers – 1.09:1, -75.73% From Current Price Level
$9.50 – Buyers – 1.46:1, -76.95% From Current Price Level
$9 – Sellers – 1.03:1, -78.16% From Current Price Level
$8.50 – Sellers – 1.25:1, -79.37% From Current Price Level
$8 – Buyers – 1.39:1, -80.59% From Current Price Level
$7.50 – Sellers – 1.2:1, -81.8% From Current Price Level
$7 – Sellers – 1.44:1, -83.01% From Current Price Level
$6.50 – Buyers – 2:1, -84.23% From Current Price Level
$6 – Sellers – 1.67:1, -85.44% From Current Price Level
$5.50 – Buyers – 1.53:1, -86.65% From Current Price Level
$5 – Sellers – 2.43:1, -87.87% From Current Price Level
$4.75 – Even – 1:1, -88.47% From Current Price Level
$4.50 – Sellers – 1.75:1, -89.08% From Current Price Level
$4.25 – Sellers – 1.67:1, -89.69% From Current Price Level
$4 – Sellers – 2:1, -90.29% From Current Price Level
*** I DO NOT CURRENTLY OWN SHARES OR OPTIONS POSITIONS IN XLF ETF AT THE TIME OF PUBLISHING THIS ARTICLE ***