SPY, the SPDR S&P 500 ETF gained +0.6% last week, with the VIX closing at 13.49 on Friday, implying a one day move of +/-0.85% & a one month move of +/-2.46%.
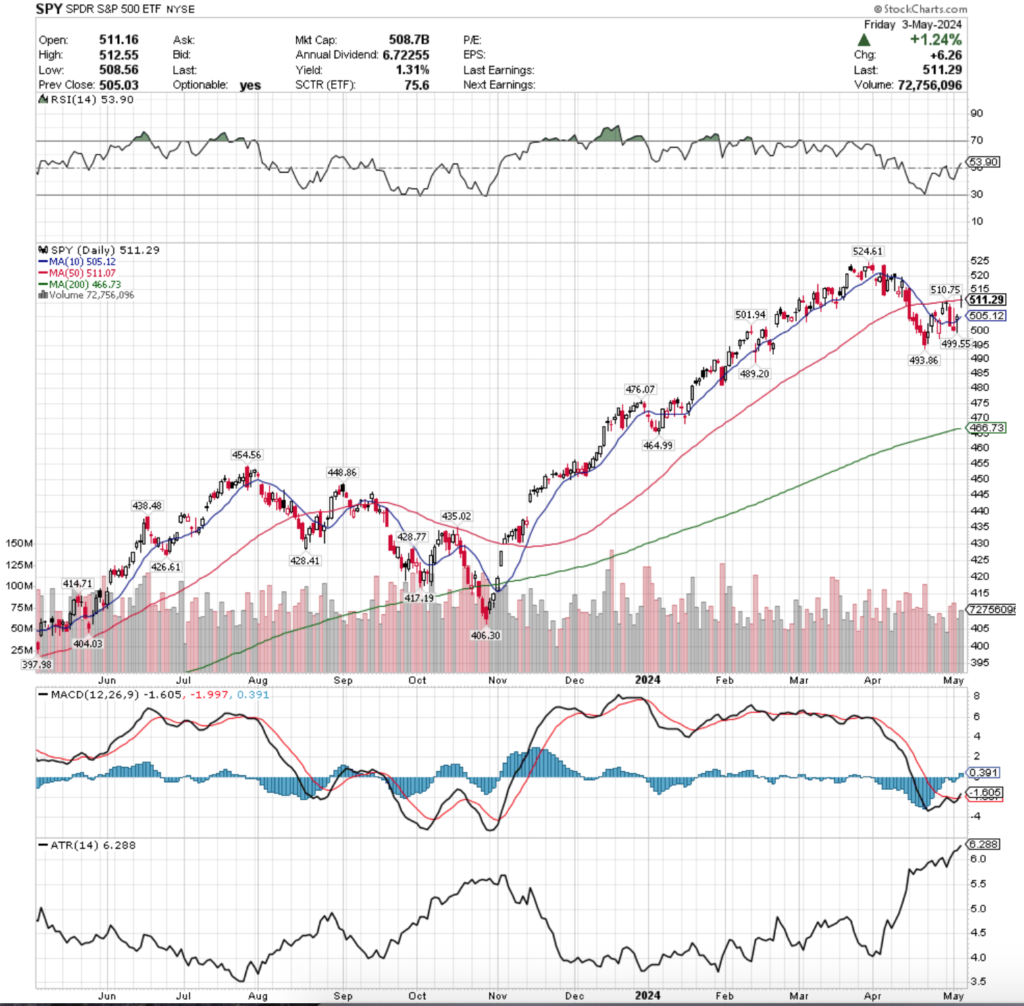
Their RSI is currently 53.9 after crossing back over the neutral spot of 50 during Friday’s session, while their MACD is bullish, but not indicating much strength & conviction in terms of an actual trend.
Volumes were -12.36% below average compared to the year prior (67,844,385 vs. 77,415,622), with the two declining sessions of the week having the highest levels, which is not a major vote of confidence from market participants.
The week kicked off on Monday with a theme of uncertainty, as a low volume session resulted in a dragonfly doji that opened & closed just below the 50 day moving average.
Tuesday was a risk-off session on the second highest volume of the week, where prices dipped down & broke through the support of the 10 day moving average.
Wednesday gave interesting signals, with prices opening lower than Tuesday, finding some footing & moving above the 10 DMA’s resistance, but ultimately resulting in bearish decline as bears rushed in & forced prices to close lower than the day’s open in an inverted hammer candle.
The session was also the highest volume of the week, signaling that there was a bit of conflicting sentiment for SPY, as there was a temporary intraday push higher that had limited sticking power & the spinning top candle body denotes uncertainty on the part of market participants.
Thursday saw a slight increase, opening in line with the 10 day moving average, testing beneath it to about the low of Wednesday before advancing & closing above the support of the 10 DMA.
Closing as a spinning top, there is still a strong scent of uncertainty on Thursday, especially as the session covered a wide trading range on the second lowest volume of the week.
Friday rounded the week out on an even less clear note, as the session opened on gap up & resulted in a long-legged doji that closed just above the support of the 50 day moving average.
SPY’s Average True Range is on the high end currently after a couple of weeks of volatile trading & will likely remain elevated in the coming week(s).
A key area to keep an eye on this week will be the strength of the 50 day moving average, which is currently functioning as support.
If this holds up there will be additional upwards pressure on prices as the 10 day moving average crosses through it, else as they’ve gotten closer together if the price declines beneath them both there will be downwards pressure providing added volatility to SPY in the near-term.
It will also be worth keeping an eye on the window created by Friday’s gap up session to see if it gets filled or not in the coming days.
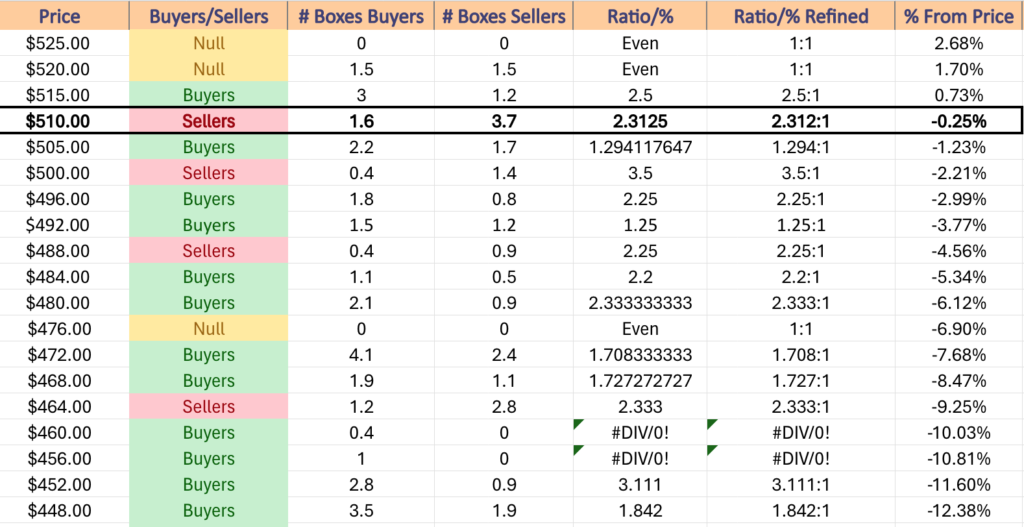
Support levels are still sparse for SPY at these price levels, with the volume sentiment for the nearest four below.
SPY has support at the $510.75 (10 Day Moving Average, Volume Sentiment: Sellers, 2.31:1), $505.12 (10 Day Moving Average, Volume Sentiment: Buyers, 1.29:1), $501.94 (Volume Sentiment: Sellers, 3.5:1) & $499.55/share (Volume Sentiment: Buyers, 2.25:1) price levels, with resistance at the $511.29 (50 Day Moving Average, Volume Sentiment: Sellers, 2.31:1) & $524.61/share (Volume Sentiment: NULL, 0:0*) price levels.
QQQ, the Invesco QQQ Trust ETF added +1.04% last week, mostly due to Friday’s +2.01% gap up session.
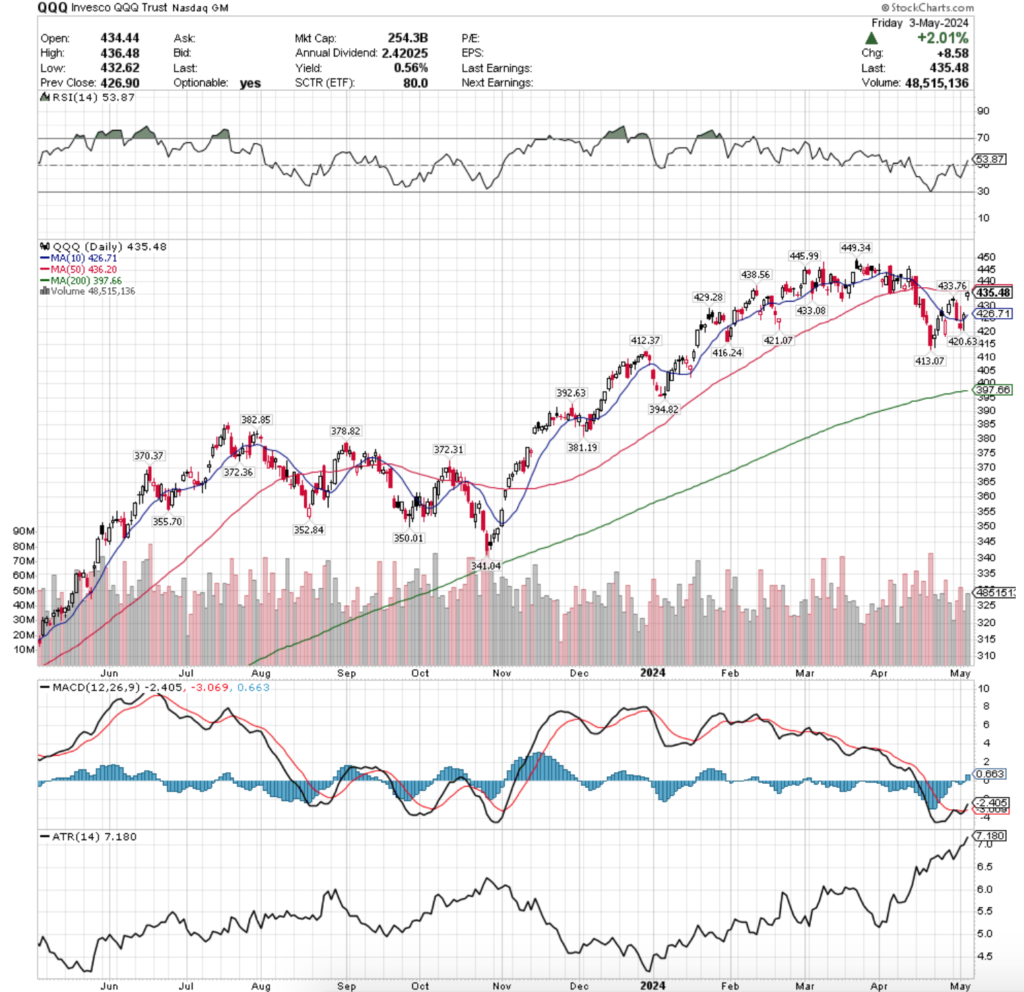
Their RSI is 53.87, also having crossed over the neutral level following Friday’s gap up session, while their MACD is bullish, but not indicating a major change in trend & will be an area to keep an eye on in the coming week.
Volumes were -13.68% below average last week compared to the year prior (42,101,522 vs. 48,771,561), matching SPY’s in terms of day-over-day performance from last week.
QQQ’s week resembled SPY’s in more ways than just the volume, even their daily candles last week are all highly similar, both with regards to their proximity to the support at the 10 day moving average & their size & shapes as well.
One key area of difference was Friday though for QQQ, where the second highest volume of the week occurred on the gap up session that pushed QQQ into positive territory to end the week.
QQQ ended Friday’s session on a weak, uncertain note given that the day’s candle was a spinning top & that it was unable to close above the resistance of the 50 day moving average (although it did temporarily break above it).
That relationship will be a key area of focus heading into this week, much like what was outlined above for SPY.
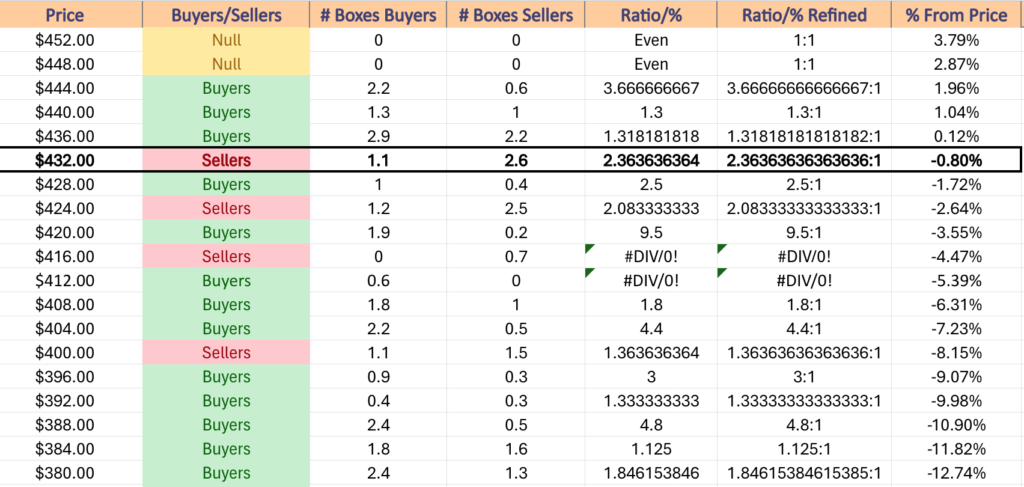
It should be noted though that due to the lesser velocity that QQQ has risen with over the past 6 months that there are more local support levels for QQQ to catch itself on in the event of decline.
With that said, it should also be noted that they serve as resistance levels on the way up as well & their volume sentiments outlined below should be kept in mind while looking at their chart this week.
Also, like SPY, QQQ’s Average True Range is also on the higher end currently after April’s volatility & will likely continue to be at heightened levels in the near-term.
QQQ has support at the $433.08 (Volume Sentiment: Sellers, 2.36:1), $429.28 (Volume Sentiment: Buyers, 2.5:1), $426.71 (10 Day Moving Average, Volume Sentiment: Sellers, 2.08:1) & $421.07/share (Volume Sentiment: Buyers, 9.5:1) price levels, with resistance at the $436.20 (50 Day Moving Average, Volume Sentiment: Buyers, 1.32:1), $438.56 (Volume Sentiment: Buyers, 1.32:1), $445.99 (Volume Sentiment: Buyers, 3.67:1) & $449.34/share (All-Time High, Volume Sentiment: NULL, 0:0*) price levels.
IWM, the iShares Russell 2000 ETF advanced +1.78% last week, as small cap names were the favorite among market participants in terms of the major indexes.
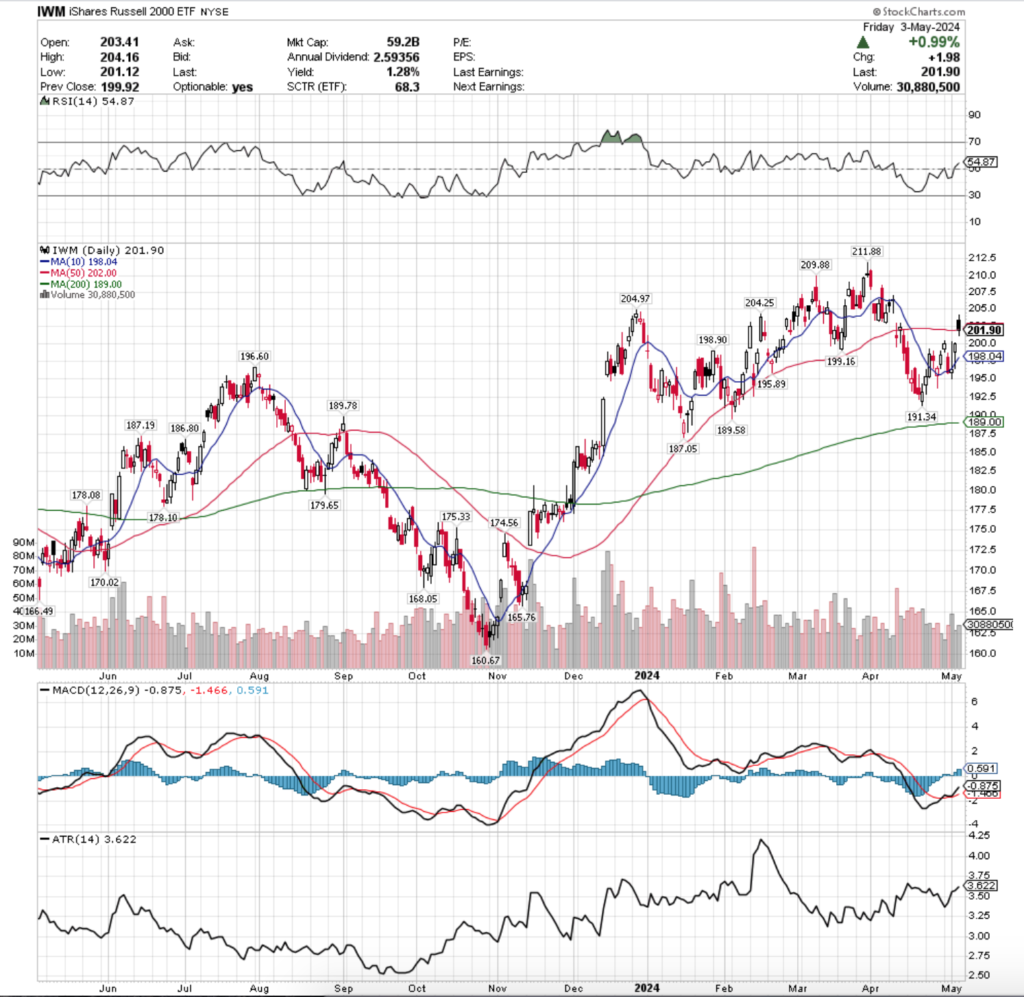
Their RSI is 54.87 after crossing the neutral level mid-week, while their MACD is bullish.
While IWM’s MACD currently looks more bullish than SPY or QQQ’s, it is still an area to keep a close eye on in the coming week to see how it holds up.
Volumes were -15.16% below average vs. the year prior (29,517,412 vs. 34,792,056), which is noteworthy as all but one session of the week resulted in advances, indicating that while IWM advanced for the week, there was not strong sentiment behind its performance.
Monday kicked the week off with an advancing spinning top candle, a signal of uncertainty that ultimately would reign the overall sentiment until Friday.
Tuesday was a declining session that covered a wide range of price action, but was ultimately supported by the 10 day moving average & closed right along it.
Wednesday was an interesting session, as the week’s highest volume came on a wide-range day that opened below the 10 DMA, tested above it & back towards the highs of Monday’s session before ultimately declining & closing just below the 10 DMA.
Thursday is when things shifted gears, as prices jumped up on the open, tested lower, temporarily breaking down below the 10 DMA’s support, only to roar back up & close the day above $200/share.
Friday the week closed on an ominous note, as the session opened on a gap up & made a run towards the $205/share level, but ultimately was stopped short & went lower, settling for the day just beneath the 50 day moving average.
IWM’s Average True Range is not as elevated as those of SPY or QQQ, but it will likely continue rising in the coming week(s) as it appears that there will be an uptick in volatility.
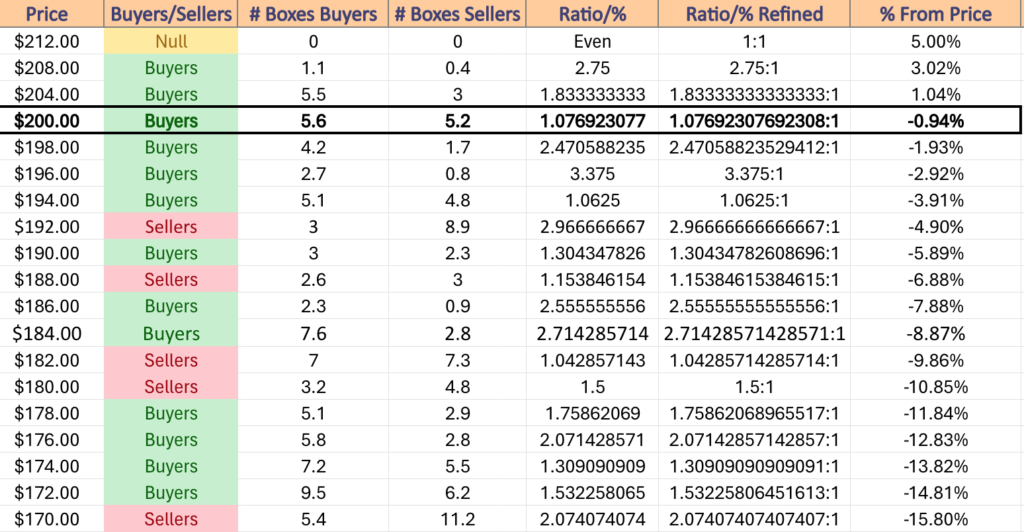
Due to the nature of how IWM trades more in ranges than the steep climbing SPY or QQQ there are more local support levels to rely on in the near-term.
IWM has support at the $199.16 (Volume Sentiment: Buyers, 2.47:1), $198.90 (Volume Sentiment: Buyers, 2.47:1), $198.04 (10 Day Moving Average, Volume Sentiment: Buyers, 2.47:1) & $196.60/share (Volume Sentiment: Buyers, 3.38:1) price levels, with resistance at the $202 (50 Day Moving Average, Volume Sentiment: Buyers, 1.08:1), $204.25 (Volume Sentiment: Buyers, 1.83:1), $204.97 (Volume Sentiment: Buyers, 1.83:1) & $209.88/share (Volume Sentiment: Buyers, 2.75:1) price levels.
DIA, the SPDR Dow Jones Industrial Average ETF climbed +1.17% last week, having the second best week of the major indexes behind the Russell 2000.
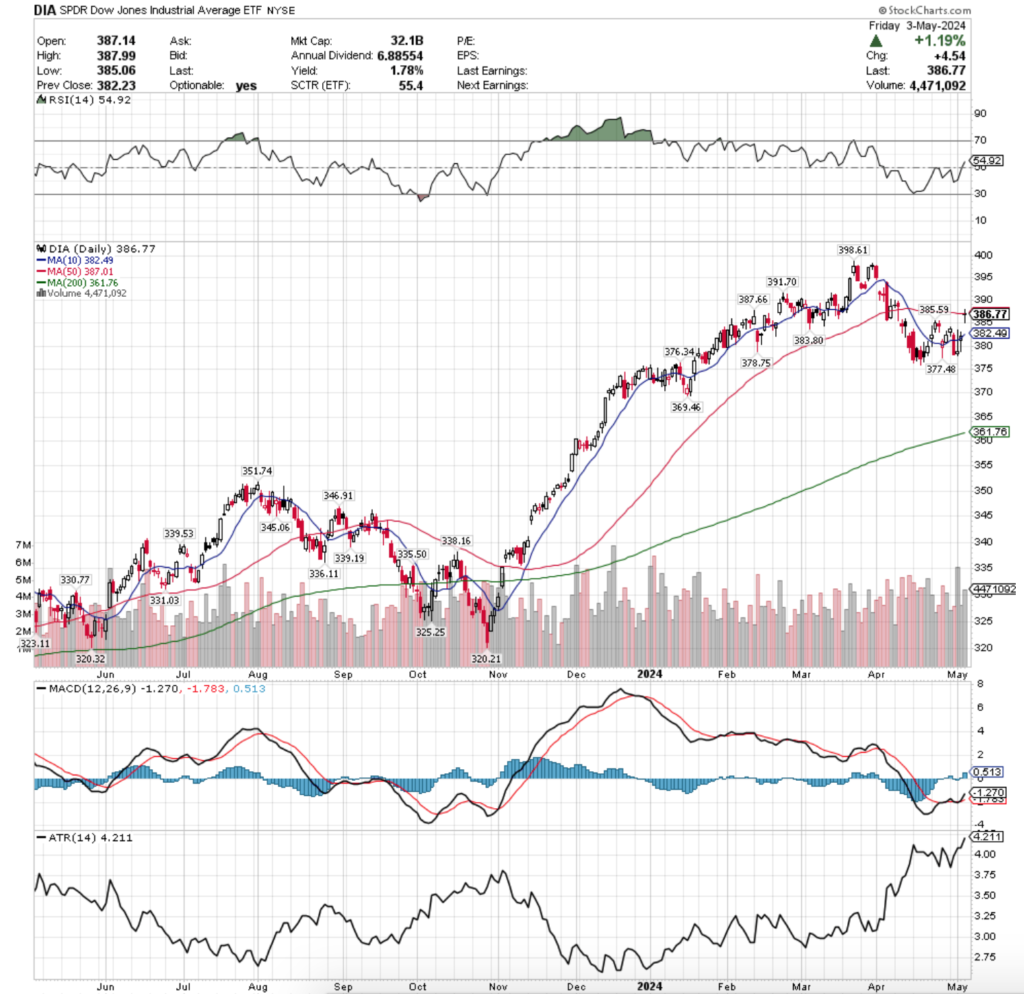
Their RSI is 54.92, while their MACD is bullish.
Volumes were +15.45% above average compared to the year prior (4,093,225 vs. 3,545,474), which is interesting given how the top three days of the week by volume were all advancing sessions.
Much like the other major indexes, DIA opened the week up with a spinning top candle on low volume, spelling uncertainty by market participants.
Tuesday opened lower & closed beneath the support of the 10 day moving average, before a high wave candle created a bullish Harami pattern with it on Wednesday & the bulls began to take over.
Wednesday’s session should also be noted for having the week’s strongest volume.
Thursday the 10 DMA was overcome as prices settled for the day just above it, and Friday closed the week out on an uncertain note with a doji candle that closed just below the 50 day moving average.
Much like the other index ETFs mentioned above, DIA’s relationship with the 50 DMA will be a closely watched area this week in the markets, as it was still providing resistance heading into the weekend.
DIA’s Average True Range is near the high end of its range due to the recent volatility of the past month & it will likely remain elevated going into the coming week(s).
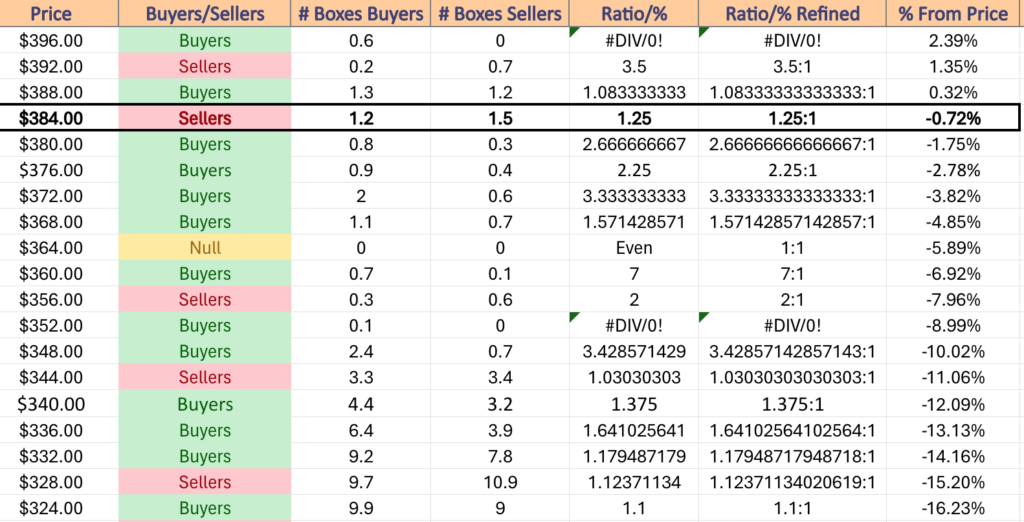
In the event of increasing volatility, it will become important to have an understanding of the volume sentiments of the price levels where support lies, which is outlined below.
DIA has support at the $385.59 (Volume Sentiment: Sellers, 1.25:1), $383.80 (Volume Sentiment: Buyers, 2.67:1), $382.49 (10 Day Moving Average, Volume Sentiment: Buyers, 2.67:1) & $378.75/share (Volume Sentiment: Buyers, 2.25:1) price levels, with resistance at the $387.01 (50 Day Moving Average, Volume Sentiment: Sellers, 1.25:1), $387.66 (Volume Sentiment: Sellers, 1.25:1) $391.70 (Volume Sentiment: Buyers, 1.08:1) & $398.61/share (All-Time High, Volume Sentiment: Buyers, 0.6:0*) price levels.
The Week Ahead
Monday the week kicks off with Richmond Fed President Barkin speaking at 12:50 pm, followed by New York Fed President Williams speaking at 6 pm.
Affiliated Managers, BioCryst Pharmaceuticals, BioNTech, Freshpet, Jones Lang LaSalle, Napco Security Technologies, Northwest Natural, Perficient, Spirit Airlines, Sunstone Hotel, TreeHouse Foods & Tyson Foods all report earnings before Monday’s opening bell, with ADTRAN, Air Lease, Axon, BellRing Brands, Beyond, Cabot, Coherent, Coty, Fabrinet, Fidelity National Information Services, FMC Corp, Golub Capital, Goodyear Tire, Hims & Hers Health, International Flavors & Fragrances, J&J Snack Foods, Lucid Group, Lumentum, Marriott Vacations, Matterport, Microchip Technology, National Health Investors, Noble, ONE Gas, Otter Tail Power, Palantir Technologies, Playa Hotels & Resorts, Primerica, ProAssurance, Realty Income, Regal Rexnord, Rocket Lab USA, Safehold, ShockWave Medical, Simon Property Group, Talos Energy, Teradata, TrueBlue, Varonis Systems, Vertex Pharmaceuticals, Vimeo, Vornado Realty Trust & Williams Companies all reporting earnings after the closing bell.
Consumer credit data is released at 3pm on Tuesday.
Tuesday morning reports include Walt Disney, AdaptHealth, Apellis Pharmaceuticals, Aramark, Avient, Bloomin’ Brands, Builders FirstSource, Celsius Holdings, Crocs, Datadog, Delek US Holdings, Duke Energy, Energizer, Enpro Inc., Expeditors International of Washington, First Watch Restaurant Group, GlobalFoundries, Gogo, Healthcare Realty, Henry Schein, Hillman Solutions, Ionis Pharmaceuticals, Jacobs Engineering, Kenvue, NJ Resources, NRG Energy, Oscar Health, Perrigo, Portillo’s, Rockwell Automation, ScanSource, Sempra Energy, Spirit Aerosystems, Squarespace, Tempur Sealy International, TopBuild, Transdigm Group, UBS, Waters, WideOpenWest & WK Kellogg, followed by Reddit, American States Water, Andersons, Angi, Arcadium Lithium, Arista Networks, Assurant, Assured Guaranty, Astera Labs, Astrana Health, Bio-Rad Labs, BlackLine, Brighthouse Financial, Cadre Holdings, California Resources Corp, Chord Energy, Cirrus Logic, Confluent, Corsair Gaming, Coupang, Douglas Emmett, Dutch Bros, Electronic Arts, Flywire, Globus Medical, GoPro, Grocery Outlet, GXO Logistics, Halozyme Therapeutics, IAC, iRobot, Jack Henry, Kratos Defense and Security, Kyndryl, LegalZoom.com, Luminar Technologies, Lyft, Magnolia Oil & Gas, Manitowoc, Match Group, McKesson, MeridianLink, Myriad Genetics, Occidental Petroleum, Open Lending, Pacira BioSciences, Permian Resources, PROS Holdings, PubMatic, Qualys, Redfin, Revolve Group, RingCentral, Rivian Automotive, Shoals Technologies, Sonos, STAAR Surgical, Sturm Ruger, Toast, TripAdvisor, Twilio, Upstart, Veeco Instruments, Virgin Galactic, Wynn Resorts & ZoomInfo after the closing bell.
Wholesale Inventories data is scheduled for Wednesday at 10 am, followed by Fed. Governor Cook speaking at 1:30 pm.
Wednesday morning begins with earnings calls by ACM Research, Affirm, Anheuser-Busch InBev, Ardmore Shipping, Autohome, Brinks, Broadridge Financial, Choice Hotels, Clarivate, Dine Brands, Editas Medicine, Emerson, Everi, Fox Corp, Griffon, Hain Celestial, HF Sinclair, Holley, Ingredion, International Money Express, International Seaways, Kennametal, Kornit Digital, LCI Industries, MasterCraft, New Fortress Energy, New York Times, NiSource, ODP Corp, Payoneer Global, Performance Food Group, Starwood Property Trust, Sunoco, Taboola.com, Teva Pharmaceutical, TPG, Uber Technologies, United Parks & Resorts, Valvoline, Vericel, Vertex, Vishay & Wolverine World Wide, followed by Arm Holdings, ACADIA Pharmaceuticals, Airbnb, AMC Entertainment, Amdocs, AppLovin, Atmos Energy, AZEK, B&G Foods, Beyond Meat, Black Hills Corp, Bumble, Celanese, Cheesecake Factory, Chesapeake Utilities, CleanSpark, Compass Minerals, CoreCivic, Crane NXT, Cytokinetics, Duolingo, Encore Capital, Energy Transfer, Exact Sciences, Fidelity National, Fluence, Forward Air, Genco Shipping & Trading, Hecla Mining, Helios Technologies, HighPeak Energy, Horace Mann, HubSpot, Innovative Industrial Properties, Instacart, Jackson Financial, James River Group, Kinetik, Klaviyo, Kodiak Gas Services, Mannkind, News Corp., Nu Skin, OraSure, Paycor HCM, Primoris Services, QuinStreet, Robinhood Markets, Royal Gold, Sinclair Broadcast, SiTime, SolarEdge Technologies, Sun Life, Sunrun, Supernus Pharmaceuticals, The Trade Desk, TKO Group Holdings, Topgolf Callaway Brands, Traeger, TTEC Holdings, Vista Outdoor, Vital Energy, Watts Water Technologies, Western Midstream & Ziff Davis after the closing bell.
Thursday begins with Initial Jobless Claims data at 8:30 am.
Allegro Microsystems, Allete, Amicus Therapeutics, Berry Global, BigCommerce, Brookfield, Canadian Solar, Cars.com, Cerence, Ceva, Charles River, Clearway Energy, Cogent Communications, Constellation Energy, Endeavor Group, Evergy, Ferrari, First Advantage, Fiverr, GoodRx, Haemonetics, Hanesbrands, Hilton Grand Vacations, Himax Technologies, Hyatt Hotels, Installed Building Products, Intellia Therapeutics, Ironwood Pharmaceuticals, Janus International Group, Krispy Kreme, Lightspeed, Madison Square Garden Entertainment, Medical Properties Trust, N-able, NetScout Systems, Nexstar Media Group, Nomad Foods, Papa John’s, PAR Technology, Planet Fitness, Playtika, Privia Health, Roblox, Sally Beauty, SharkNinja, Six Flags, Spectrum Brands, Stevanato Group, Tapestry, Tower Semiconductor, US Foods, Viatris, Warby Parker, Warner Bros. Discovery, Warner Music Group & YETI Holdings will all report earnings Wednesday morning before the opening bell, with Akamai Technologies, Alarm.com, Americold Realty Trust, AMN Healthcare, Amplitude, Applied Optoelectronics, Arlo Technologies, Array Technologies, Arrowhead Pharmaceuticals, Babcock & Wilcox Enterprises, Blink Charging, Bloom Energy, CarGurus, Chuy’s, Collegium Pharmaceutical, Diodes, Dropbox, EverCommerce, Evolent Health, Expensify, Funko, Gen Digital, Genpact, Green Dot, Guardant Health, H&R Block, Health Catalyst, indie Semiconductor, JFrog, Lions Gate Entertainment, Marathon Digital Holdings, Mercer International, Mettler-Toledo, Navitas Semiconductor, Pacific Biosciences, Progyny, Rackspace Technology, Savers Value Village, Scripps, SoundHound AI, Sweetgreen, Synaptics, TechTarget, The Beauty Health Company, Trex, Unity Software, Victory Capital, Westrock Coffee Company, Xenon Pharmaceuticals, Yelp & ZipRecruiter all due to report after the session’s close.
Friday brings us Consumer Sentiment (prelim) data at 10 am & Monthly U.S. Federal Budget data at 2pm.
MC Networks, ANI Pharmaceuticals, Construction Partners, DigitalOcean, DNOW, Enbridge, Sylvamo, Telus & TELUS International will all report earnings before the opening bell rings on Friday morning to round out the week.
See you back here next week!
*** I DO NOT OWN SHARES OR OPTIONS CONTRACTS POSITIONS IN SPY, QQQ, IWM OR DIA AT THE TIME OF PUBLISHING THIS ARTICLE ***