Advanced Micro Devices Inc. stock trades under the ticker AMD & has advanced +118.21% over the past year.
AMD has fallen -9.96% from their 52-week high in December of 2023, while gaining +126.49% from their 52-week low in January of 2023.
After a great run this past year & a new 52-week high set last week it’s a good time to do a technical breakdown of AMD’s past year’s performance, as well as review their price level:volume sentiment from recent history to gain clues into how market participants may behave around key support & resistance levels again in the future.
As always, this is not intended as investing advice, but rather as an additional resource to use in addition to your existing due diligence process.
Technical Analysis Of AMD Advanced Micro Devices Inc. Stock
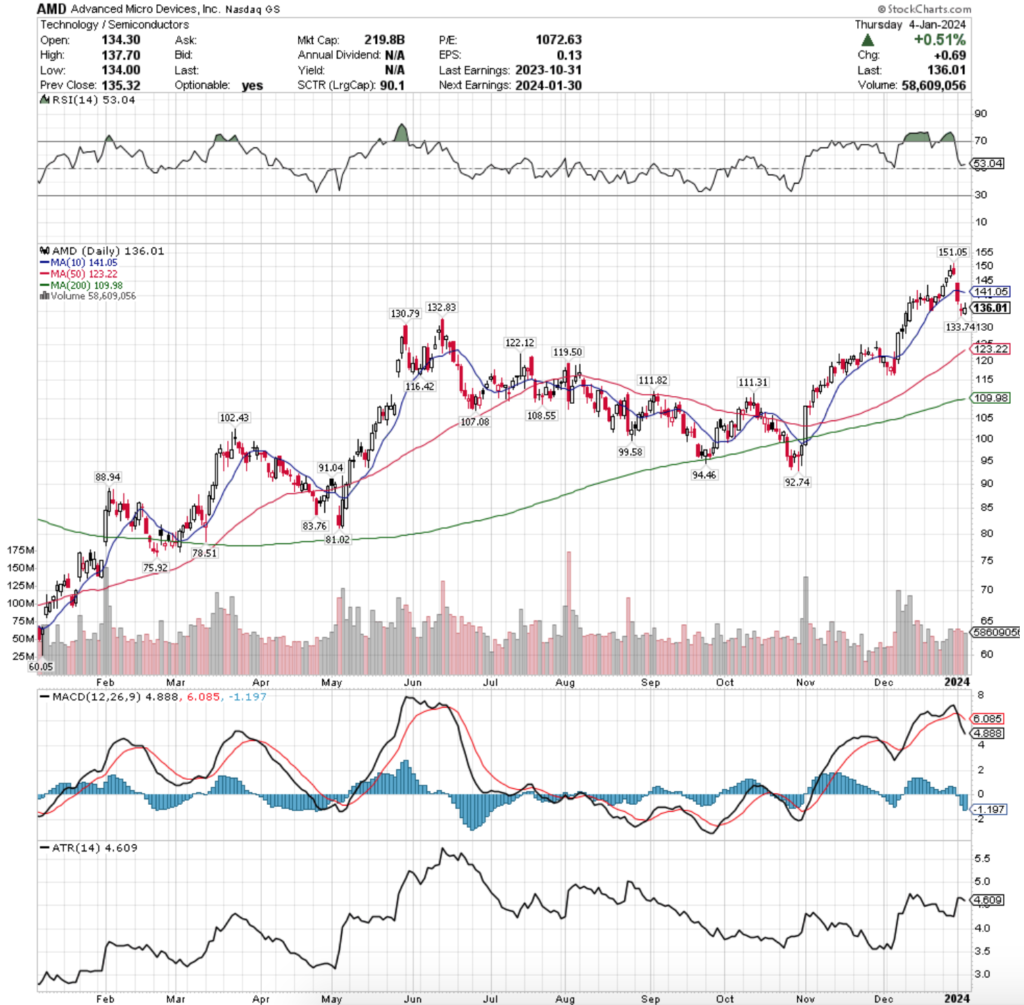
Their RSI has returned to near the neutral level after being at overbought levels for much of December & is currently at 53.04, while their MACD is in steep bearish decline following the declines of 3 of the past 4 sessions.
The volumes of the past week were +0.87% above average compared to the year prior (62,249,360 vs. 61,714,841), indicating that this is still normal profit taking after reaching a new 52-week high at the end of December 2023.
It will be interesting to watch their moving averages in the coming weeks, particularly as the 10 day moving average gave up support on Tuesday & is now curling over bearishly & the 50 DMA is -9.4% below their current share price.
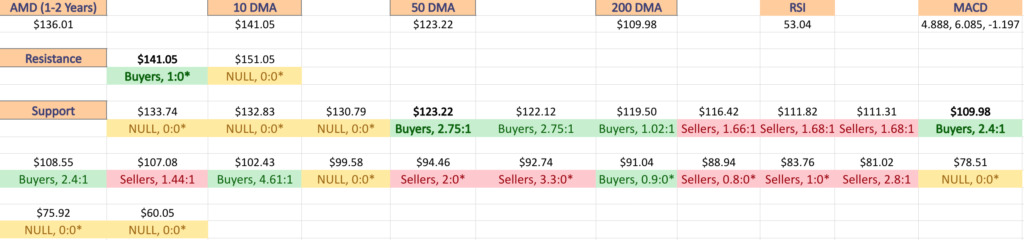
While there are three additional support levels between the current price & 50 DMA, the data for the past 1-2 years does not indicate that there is strength in favor of the buyers or the sellers at the support levels mentioned ($133.74, $132.83 & $130.79/share).
In the lead up to their new 52-week high, last week kicked off with the support of the 10 day moving average forcing AMD’s share price higher, followed Wednesday with a hanging man candle, indicating that sellers were stepping in & there was uncertainty about the price moving much higher.
Thursday nudged higher, but confirmation was given based on the real body of the session’s candle being focused more on the lower end of the day’s trading range, despite the session marking a temporary new 52-week high.
Friday, the last trading session of the year is when the party stopped, as prices advanced slightly & set a new 52-week high, before closing midway down the real body of the session prior’s candle.
Tuesday kicked this week off with a gap down session that opened with support from the 10 day moving average, which quickly faded & prices tested lower & resulted in closing below the 10 DMA, with a small lower shadow indicating that there was more seller pressure to come.
Confirmation arrived Wednesday when prices continued lower & a hint of uncertainty was in the air as the day resulted in a doji candle.
Thursday’s session did not inspire much confidence, opening lower than Wednesday’s close, but closing slightly above it.
Although Thursday tested higher with their upper shadow, the average volume does not indicate conviction in the slight movement higher.
The strength of the $130-133 support zone will be tested to see if prices can consolidate & establish a new range following the -9.96% dip from their 52-week high.
Price Level:Volume Sentiment Analysis For AMD Advanced Micro Devices Inc. Stock
Given that we are near a price extreme (52-week high) it is typical to see some price levels have Buyer:Seller values that are either lacking in data (NULL), or are heavily skewed to one side or the other.
The charts below indicate that there is no clear winner in the battle of buyers & sellers at the $130-133.99/share support zone & that the $126-129.99/share blocks are heavily skewed towards buyers, which makes sense when the number of advancing sessions in those price zones is broken down.
The $124-125.99/share price level should it be tested is historically 1.96:1 Sellers:Buyers, which would walk ADM’s share price down ~-9%, where support picks back up in the $120-123.99/share price levels, which respectively have been Buyer dominated ($122 = 2.75:1, $120 = 2.27:1).
If footing is unable to be found at this zone, the $118-119.99/share block has very weak historical buyers sentiment, which would pave the way into another seller dominated zone.
In the event that this were to happen, the next three support levels are dominated historically by Sellers, 1.66:1 & 1.68:1, before the support of the 200 DMA & the $108.55/share support level look to have historic strength, with Buyers outdoing the sellers 2.4:1.
While this extreme scenario would demonstrate a decline of -19-20%, it would not be out of the question given how much semiconductor stocks advanced over the past year & how crowded they have become.
The charts below will be something for market participants to keep an eye on in the coming months as support/resistance levels are tested.
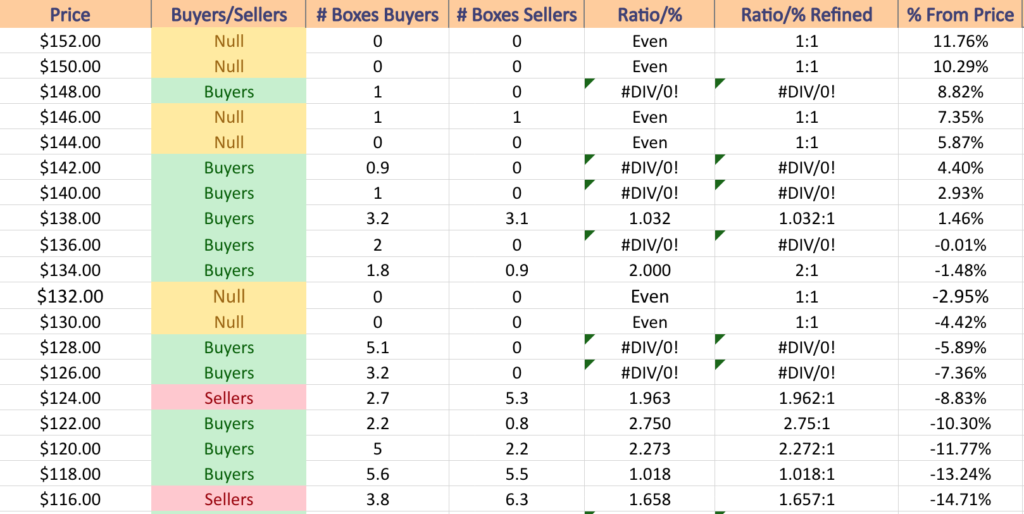
$152 – NULL – 0:0*; +11.28% From Current Price Level
$150 – NULL – 0:0*; +9.82% From Current Price Level
$148 – Buyers – 1:0*; +8.35% From Current Price Level
$146 – Even – 1:1; +6.89% From Current Price Level
$144 – NULL – 0:0*; +5.42% From Current Price Level
$142 – Buyers – 0.9:0*; +3.96% From Current Price Level
$140 – Buyers – 1:0*; +2.5% From Current Price Level – 10 Day Moving Average*
$138 – Buyers – 1.03:1; +1.03% From Current Price Level
$136 – Buyers – 2:0*; -0.43% From Current Price Level – Current Price Box*
$134 – Buyers – 2:1; -1.9% From Current Price Level
$132 – NULL – 0:0*; -3.36% From Current Price Level
$130 – NULL – 0:0*; -4.82% From Current Price Level
$128 – Buyers – 5.1:0*; -6.29% From Current Price Level
$126 – Buyers – 3.2:0*; -7.75% From Current Price Level
$124 – Sellers – 1.96:1; -9.92% From Current Price Level
$122 – Buyers – 2.75:1; -10.68% From Current Price Level – 50 Day Moving Average*
$120 – Buyers – 2.27:1; -12.15% From Current Price Level
$118 – Buyers – 1.02:1; -13.61% From Current Price Level
$116 – Sellers – 1.66:1; -15.07% From Current Price Level
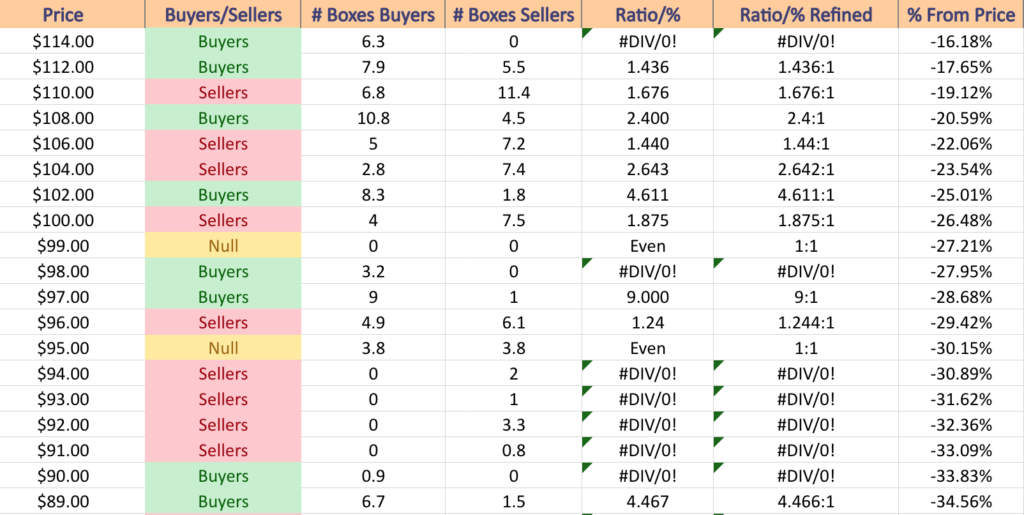
$114 – Buyers – 6.3:0*; -16.54% From Current Price Level
$112 – Buyers – 1.44:1; -18% From Current Price Level
$110 – Sellers – 1.68:1; -19.47% From Current Price Level
$108 – Buyers – 2.4:1; -20.93% From Current Price Level – 200 Day Moving Average*
$106 – Sellers – 1.44:1; -22.4% From Current Price Level
$104 – Sellers – 2.64:1; -23.86% From Current Price Level
$102 – Buyer s- 4.61:1; -25.32% From Current Price Level
$100 – Sellers – 1.88:1; -26.79% From Current Price Level
$99 – NULL – 0:0*; -27.52% From Current Price Level
$98 – Buyers – 3.2:0*; -28.25% From Current Price Level
$97 – Buyers – 9:1; -28.98% From Current Price Level
$96 – Sellers – 1.24:1; -29.72% From Current Price Level
$95 – Even – 1:1; -30.45% From Current Price Level
$94 – Sellers – 2:0*; -31.18% From Current Price Level
$93 – Sellers – 1:0*; -31.91% From Current Price Level
$92 – Sellers – 3.3:0*; -32.65% From Current Price Level
$91 – Sellers – 0.8:0*; -33.38% From Current Price Level
$90 – Buyers – 0.9:0*; -34.11% From Current Price Level
$89 – Buyers – 4.47:1; -34.84% From Current Price Level
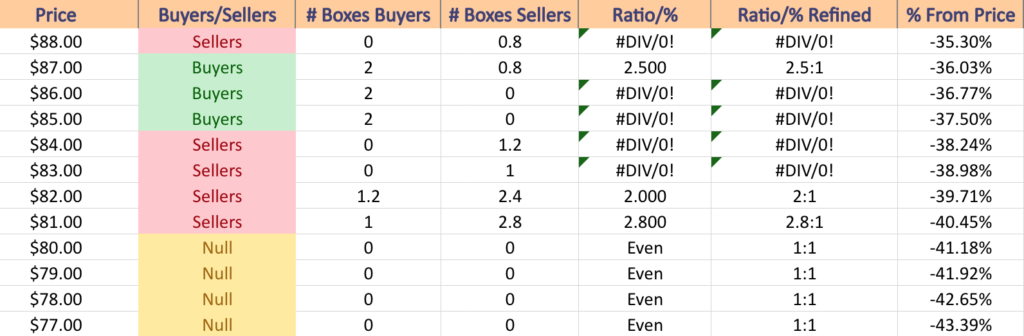
$88 – Sellers – 0.8:0*; -35.57% From Current Price Level
$87 – Buyers – 2.5:1; -36.31% From Current Price Level
$86 – Buyers 2:0*; -37.04% From Current Price Level
$85 – Buyers – 2:0*; -37.77% From Current Price Level
$84 – Sellers – 1.2:0*; -38.5% From Current Price Level
$83 – Sellers – 1:0*; -39.32% From Current Price Level
$82 – Sellers – 2:1; -39.97% From Current Price Level
$81 – Sellers – 2.8:1; -40.7% From Current Price Level
$80 – NULL – 0:0*; -41.43% From Current Price Level
$79 – NULL – 0:0*; -42.16% From Current Price Level
$78 – NULL – 0:0*; -42.89% From Current Price Level
$77 – NULL – 0:0*; -43.63% From Current Price Level
*** I DO NOT OWN SHARES OR OPTIONS CONTRACT POSITIONS IN AMD STOCK AT THE TIME OF PUBLISHING THIS ARTICLE ***