SPY, the SPDR S&P 500 ETF declined -1.54% this past week, faring second best of the major indexes only to the Dow Jones Industrial Average, as market participants sought the safety of larger cap names.
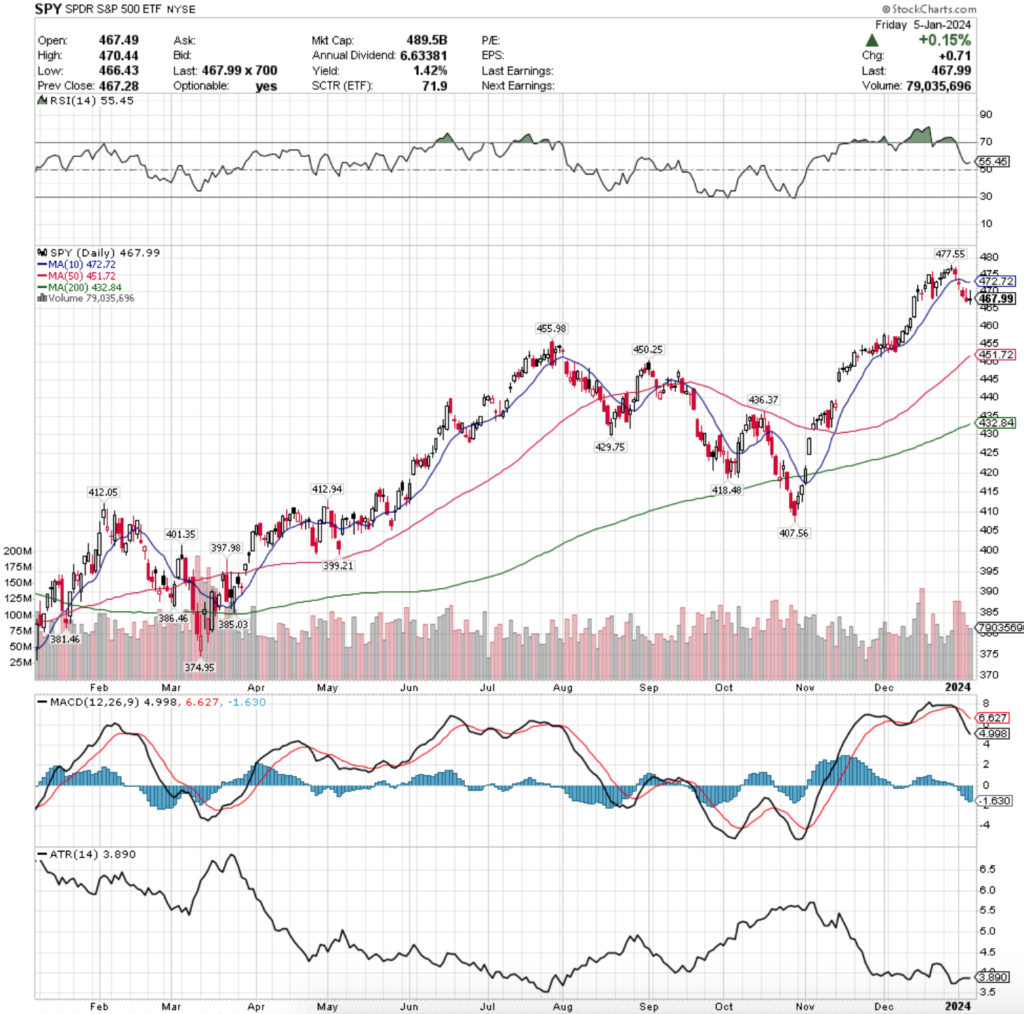
Their RSI has trended back towards neutral after spending most of December in overbought territory & currently sits at 55.25, while their MACD is currently in bearish decline following the declines of the past week & a half.
Volumes were 20.73% above average compared to the year prior (99,250,522 vs. 82,211,072), with the first two sessions of the week’s declines being the heaviest, following last Friday’s footsteps as market participants were eager to take chips off of the table following the new 52-week high set the week prior.
This will be something to keep an eye on, given how weak the inflow volume has been the couple of weeks before that, especially now that the support of the 10 day moving average has been broken.
Another key area to be watching is the wide range candle from 12/13/2023, whose high & low for the session were $468.86 & $462.25.
While that range is only 1.4%, when compared to the other candles of the past 2 months it is one of the largest, and is currently keeping the gate before prices would decline into a range that would begin the creation of the right hand shoulder, with the 52-week high as the head.
The 50 day moving average is currently set up in a manner that would be able to provide support & an easing into said shoulder, which would likely be caused by a weaker than anticipated earnings season on the horizon.
The 10 DMA was able to support last Friday’s spinning top session, but Tuesday’s session opened below the 10 DMA, tested it & ultimately closed below the open, resulting in a spinning top candle.
While the real body is concentrated towards the top of the candle, the close being below the open on an already down session set a bearish tone for the week.
Wednesday the declines continued, although seller volume slightly dipped from the higher levels of Friday & Tuesday.
Another sign of uncertainty came Thursday when a spinning top candle was the result of the day’s session, but the real body of the candle was confined to the bottom 30% of the candle, which signaled that the ice may be starting to crack.
Friday continued the theme of uncertainty, with a +0.14% gain on a doji candle; which isn’t exactly risk off, but showed that there was hardly any appetite for more risk either.
Friday did see a little participation than Thursday, but given the resulting candle was a doji that was on the lower half of the day’s range it does not signal much confidence moving into the coming week.
The candle from 12/13 is not a support level, but the open of that day’s range will be something worth looking at now, as Friday’s candle entered into the range of it.
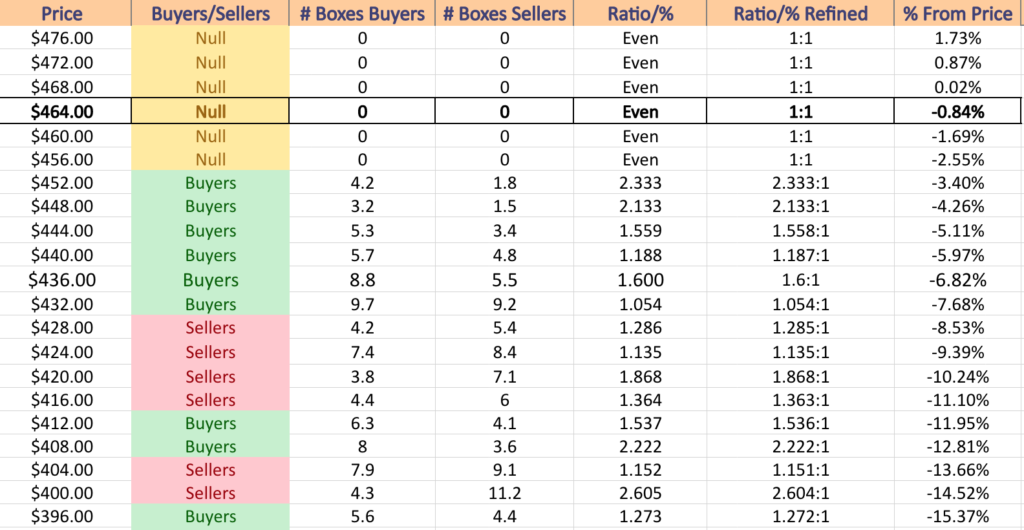
The next support level is ~2.5% below the current price where buyers have historically dominated the sellers 2.33:1 over the past 1-2 years, however given that we are near the 52-week high these numbers are skewed towards the advancing volume.
Looking at the chart below you can see that the buyer volume sentiment is currently winning the battle for the next -7.68%, but that the sentiment wanes the further down the prices go.
Sellers step in from there historically until a -11.1% decline, which would bring us to the $415.99-412/share range, where buyers have historically stepped back in 1.54:1.
Their Average True Range is still very low, due to the low volatility & tight trading ranges of the past couple of weeks, which will likely be increasing by the end of the coming week.
SPY has support at the $455.98 (Volume Sentiment: Buyers, 2.33:1), $451.72 (50 Day Moving Average; Volume Sentiment: Buyers, 2.13:1), $450.25 (Volume Sentiment: Buyers, 2.13:1) & $439.84/share (Volume Sentiment: Buyers, 1.6:1) price levels, with resistance at the $472.71 (10 Day Moving Average; Volume Sentiment: NULL, 0:0*) & $477.55/share (52-Week High; Volume Sentiment: NULL, 0:0*) price levels.
QQQ, the Invesco QQQ Trust ETF fell -3.12% this past week, as the tech heavy index was the second least favorite of market participants.
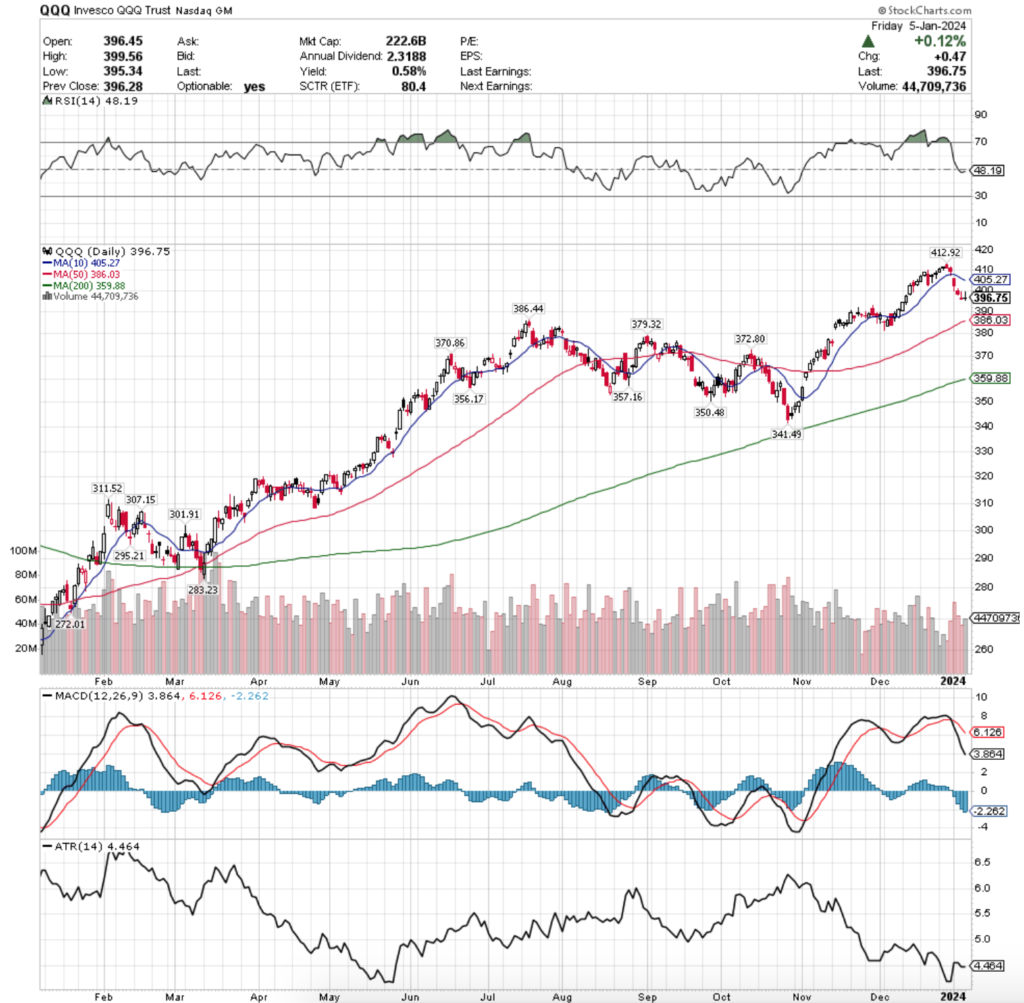
Their RSI has dipped below the neutral mark of 50 & sits at 48.19 following being in overbought territory for most of December, while their MACD is bearish & signaling further declines.
Volumes were -9.78% below average this week compared to the year prior (47,239,585 vs. 52,357,932), as market participants were skeptical following Tuesday’s declines that were steeper than last Friday’s risk off price action.
Last Friday the support of the 10 day moving average held up, but Tuesday opened, closed & tested further below the 10 DMA’s resistance, before the rest of the week was riddled with indecisive candles.
Wednesday featured a spinning top that’s real body was concentrated on the lower end of the day’s range, while Thursday & Friday’s sessions each resulted in gravestone dojis, signaling uncertainty, but with market participants favoring the bearish end of the days’ ranges.
The $400/share mark will be where to keep an eye on now, as the past two days’ sessions upper shadows tested the level, but the bodies of the candles closed ~1% below (near where they opened).
In terms of support, there are two touch-points ~2.5% below the current price of QQQ, one being the 50 day moving average at $386.03 & the other being at $386.44/share, which is a candidate for being the left shoulder in the event a head & shoulders pattern emerges, using the 52-week high as the head.
Something to keep an eye on it the 10 day moving average, as it looks identical to a head & shoulders pattern & has begun to descend into the right hand shoulder, which from where we stand today looks like it would form by the end of January.
Given that the 50 DMA is moving up at the price level though this may become interesting, as if the price breaks through its support it would then become an added layer of resistance & force QQQ’s price lower.
The 200 DMA also is something to keep watch on over the next month, as it currently is -9% below the price of QQQ & is moving higher day by day (slowly).
Given the below average volumes it does appear that there is waning sentiment towards the NASDAQ names, particularly after some of its largest components led the entire market higher on their own for the past handful of months while other companies did not perform nearly as well.
This will likely give way as market participants take some chips off of the table earlier into the year to secure profits before a year that is sure to be marred with uncertainty.
Like SPY, their Average True Range is also on the lower end of its range, due to the small price range declining sessions that we’ve seen over the past week & a half, but once earnings season begins there should be more volatility & the ATR will march higher.
This may not occur until next week as the earlier names reporting earnings may have little impact on the NASDAQ.
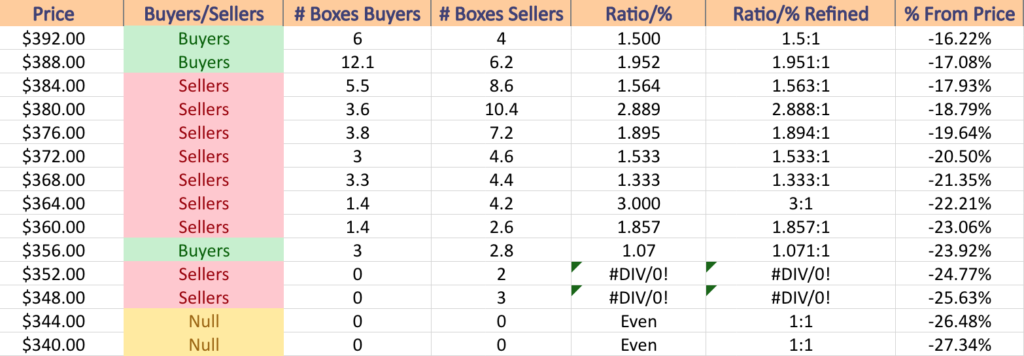
The $380-383.99/share mark will be a critical area to watch, as that is the strongest buyer dominated price zone over the past 1-2 years at 4:1 Buyers:Sellers (-4.22% from current price), with the $360-363.99/share level being next (-9.26% from current price) in terms of buyer strength.
While the other price zones are relatively buyer oriented or even, this looks primed to even out in the course of the coming few months & will be something to watch.
QQQ has support at the $393.15 (Volume Sentiment: NULL, 0:0*), $386.44 (Volume Sentiment: Buyers, 1.55:1), $386.03 (50 Day Moving Average; Volume Sentiment: Buyers, 1.55:1) & $383.35/share (Volume Sentiment: Buyers, 4:1) price levels, with resistance at the $405.27 (10 Day Moving Average; Volume Sentiment: NULL, 0:0*) & $412.92/share (52-Week High; Volume Sentiment: NULL, 0:0*) price levels.
IWM, the iShares Russell 2000 ETF has the worst week of the major indexes, dipping -3.69% as investors were weary of small cap names that had been enjoying a solid run up from a 52-week low in October of 2023 to a new 52-week high in December.
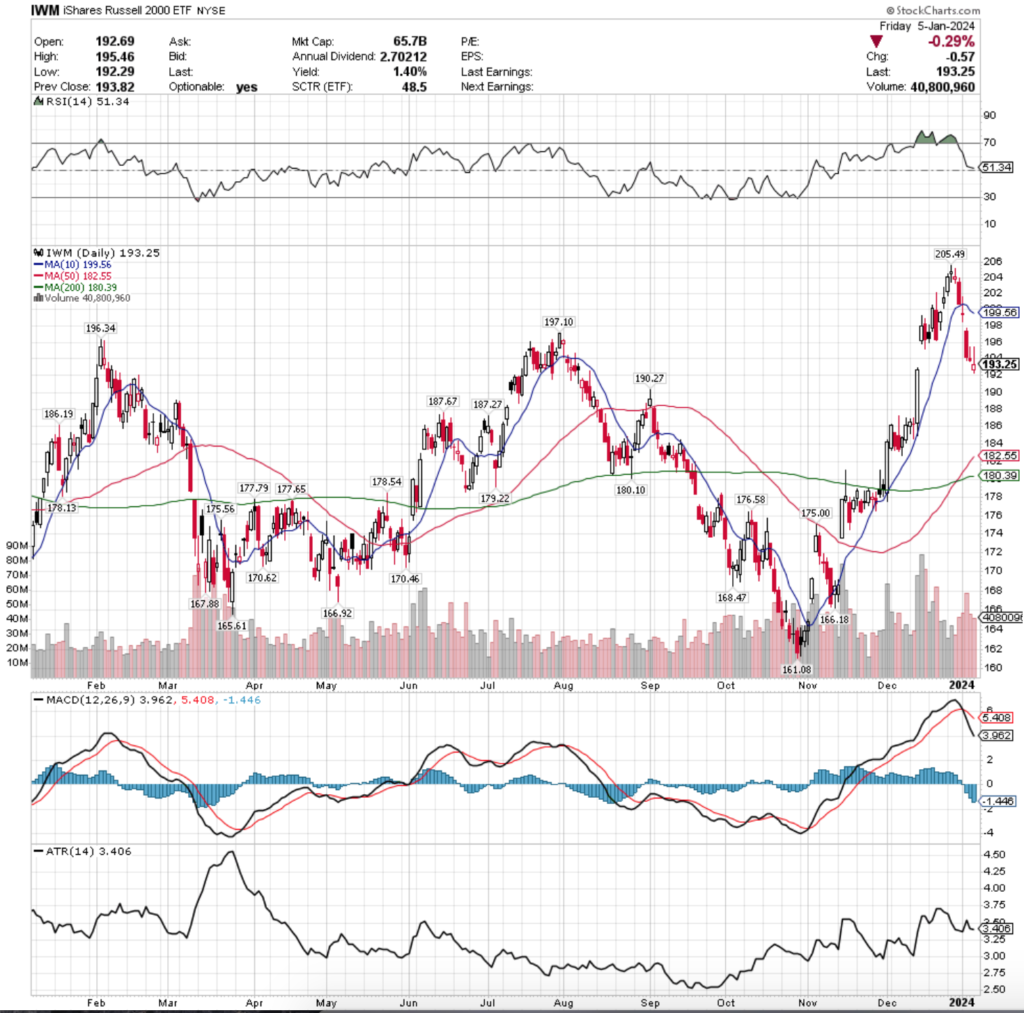
Their RSI has just retreated to the near neutral level & sits at 51.34, after spending most of December in overbought territory following a +27.57% run from a new 52-week low to 52-week high that began at the end of October & ended mid-December 2023.
Their MACD is also currently in bearish decline due to the declines from the 52-week high.
Volumes were 44.12% above average compared to the year prior (46,084,180 vs. 31,976,621), as market participants were eager to take their winnings off of the table, signaling that the “January Effect” may not be taking place this year.
All of this week’s bearish volumes eclipsed the volumes of the week & a half prior, signaling that there looks to be blood in the water.
Much like SPY & QQQ, last Friday’s session was held up by the support of the 10 day moving average for IWM.
However, Tuesday opened, tested & broke above the 10 DMA, before closing well below it on a doji candle, signaling uncertainty, but also a risk off attitude.
Wednesday kicked off with a gap down, which tried briefly to break higher but left a large window, before declining ~1.7% in a wide range session to the downside.
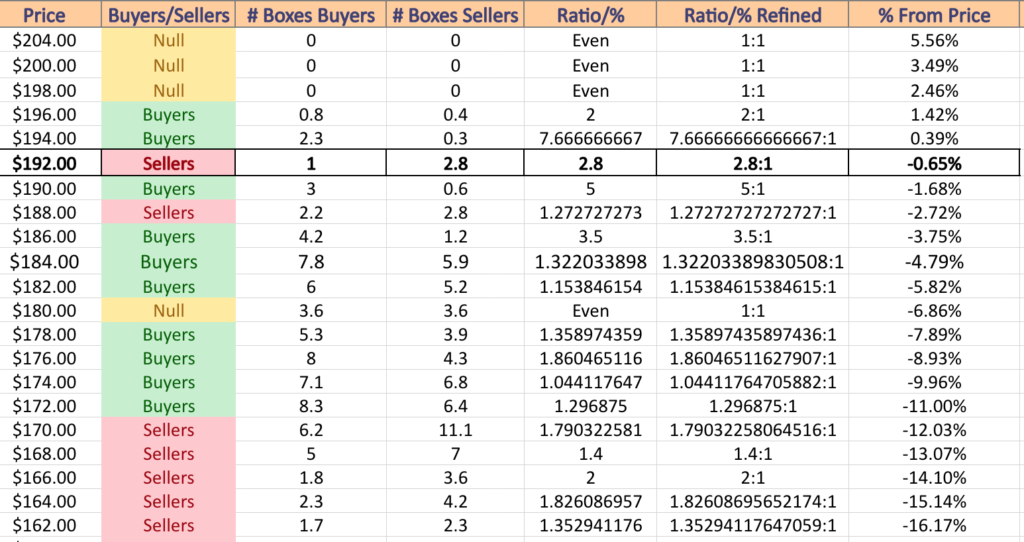
Thursday the painful outlook continued, as IWM opened near the close of the day prior, tested higher but couldn’t reach the $196/share mark, before closing lower on a spinning top candle.
Friday’s session offered a glimmer of hope that was still tainted with uncertainty, as the session opened below Thursday’s close, tested to Thursday’s high but ultimately closed lower thant he day’s open on volume that was not much weaker than Tuesday & Thursday’s.
It will be interesting to see how support levels for IWM hold up in the coming weeks, as they have been the most apt to fluctuate back & forth index compared to the others that mostly have just continued to climb before oscillating around a range near the tops.
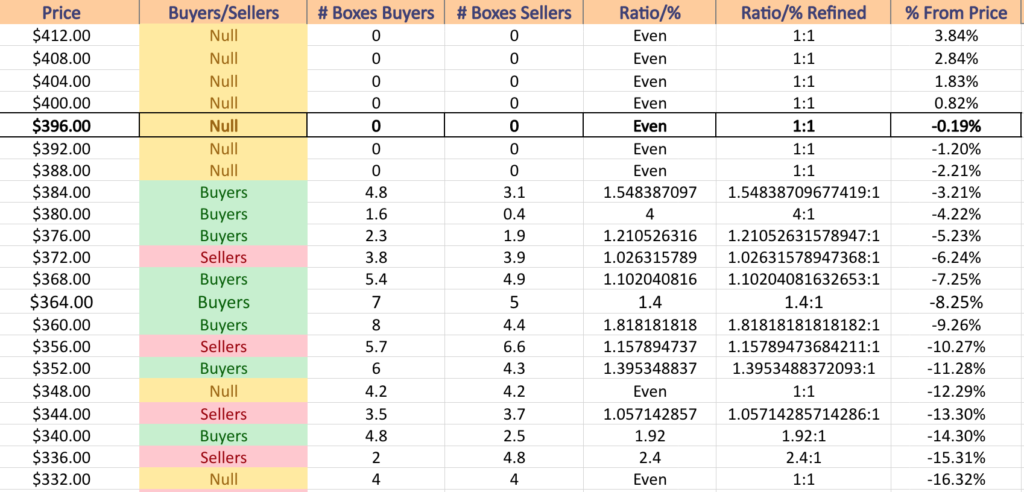
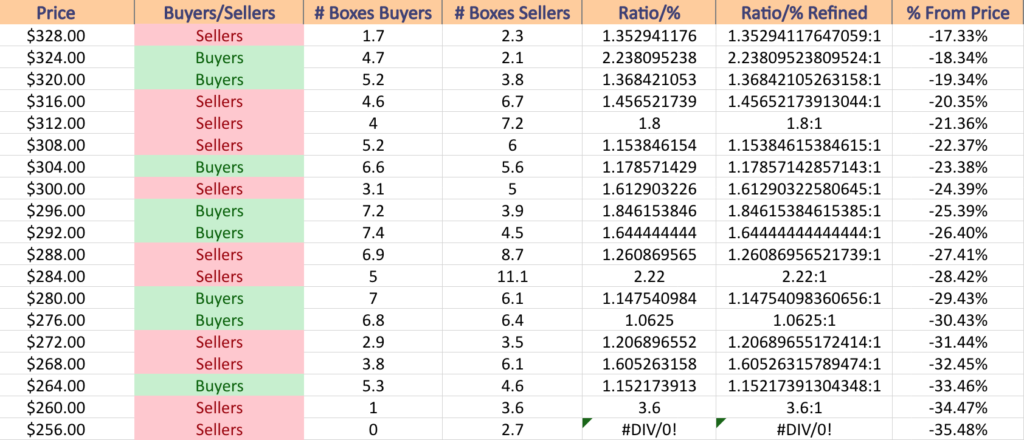
While the next 11% decline is mostly buyer dominated levels by volume, it will be worth consulting this price level:volume sentiment analysis to see the breakdown of their support levels & prior volume sentiments at each level.
Should an 11% decline be on the cards, that hits the $172/share mark, which will test support zones created by prior consolidation ranges, however the sellers takeover there all the way down to the 52-week low, which will make it interesting to see if that low level is tested again & if it holds up or not.
Their Average True Range is near its mean & will be another area of interest to watch in the coming weeks to see whether we get more volatility & a strong trend to one side or the other, or if there is more of a weak ranged consolidation period on the cards for us.
The small cap IWM index has shown on average wider range sessions than the other indexes this past year though & will likely continue this trend.
IWM has support at the $190.27 (Volume Sentiment: Buyers, 5:1), $187.67 (Volume Sentiment: Buyers, 3.5:1), $187.27 (volume Sentiment: Buyers, 3.5:1) & $186.19/share (Volume Sentiment: Buyers, 3.5:1) price levels, with resistance at the $196.34 (Volume Sentiment: Buyers, 2:1), $197.10 (Volume Sentiment: Buyers, 2:1), $199.56 (10 Day Moving Average; Volume Sentiment: NULL, 0:0*) & $205.49/share (Volume Sentiment: NULL, 0:0*) price levels.

DIA, the SPDR Dow Jones Industrial Average ETF had the strongest week of the major indexes, but still slipped down -0.58% for the first week of the new year.
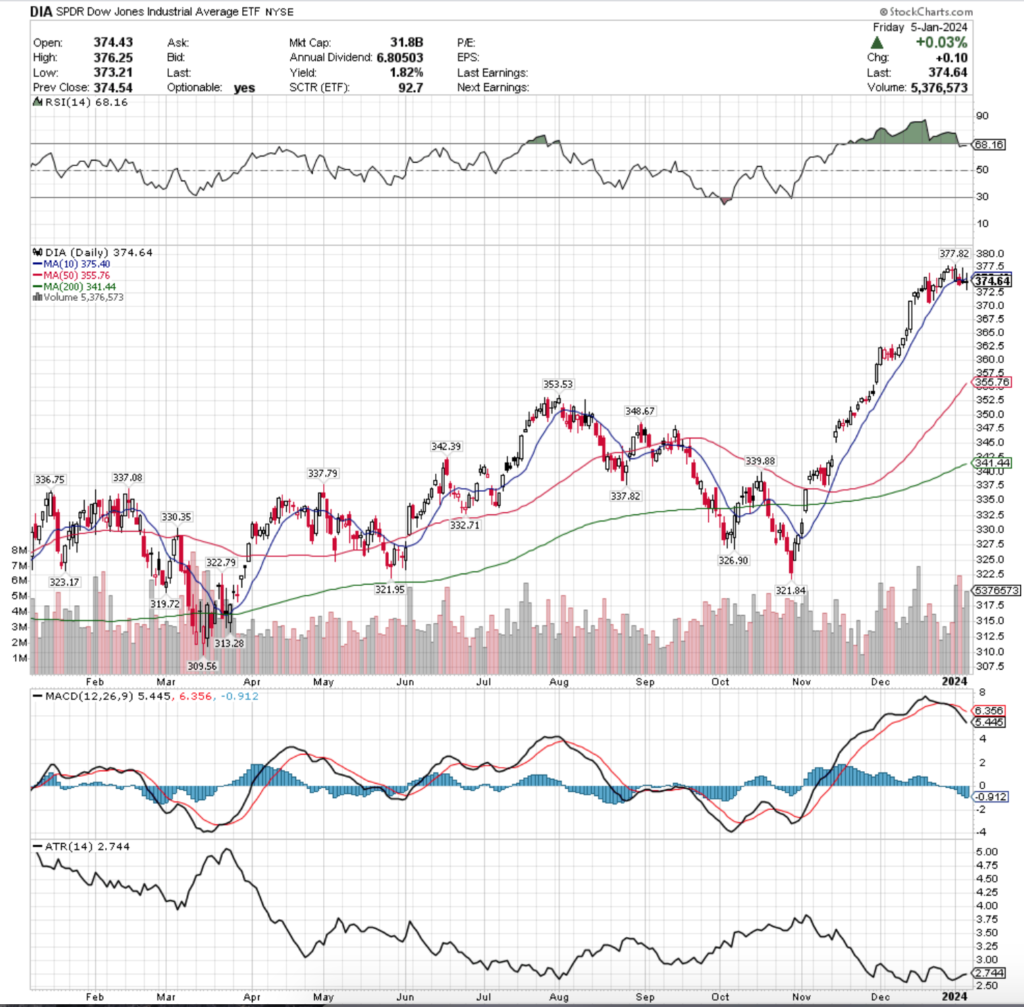
Their RSI is slightly under overbought territory & currently sits at 68.16, after spending most of the prior two months above 70 (overbought).
It is worth noting that a head & shoulders pattern in their RSI developed during that time, signaling that there should be a reversion towards the neutral level in the near-term, particularly after the ascent they took over the past 2 months.
Their MACD is bearish & continuing lower since around the time that they set a new 52-week high at the end of 2023.
Volumes were 55.6% above average this week compared to the year prior (5,449,479 vs. 3,502,129), which is a source of confusion, as it shows investors are still flocking to the larger cap stocks in times of shakeup & 3 of the past 4 sessions were bullish.
However, it is worth noting that the highest volume session of last week was Wednesday’s bearish declining session, which is the second highest volume session of the past 9-10 months.
Their 10 day moving average will also be an area of interest to keep an eye on, as it is now acting as resistance just above Friday’s close.
Last week kicked off on Tuesday with a move up that was supported by the 10 DMA, setting the 52-week high to $337.82/share.
Wednesday saw declines that closed beneath the support of the 10 DMA on the highest volumes of the week.
Thursday resulted in a gravestone doji that opened & closed just beneath the 10 DMA on weak volume, but was an advancing session, indicating that there is extreme uncertainty at these levels.
Friday the indecision continued, with a doji candle that’s real body was also contained by the resistance of the 10 day moving average, which is now curled over & applying more downwards pressure on the share price than it had been earlier in the week.
While Friday’s session had more volume than Thursday’s, it still signals that there is great uncertainty & a lack of confidence in prices at these levels.
12/13’s candle will also be an area to keep an eye on, as the opening level, while not a formal support point, is the gateway to what would be the right hand shoulder should a head & shoulders pattern emerge using the 52-week high as a head.
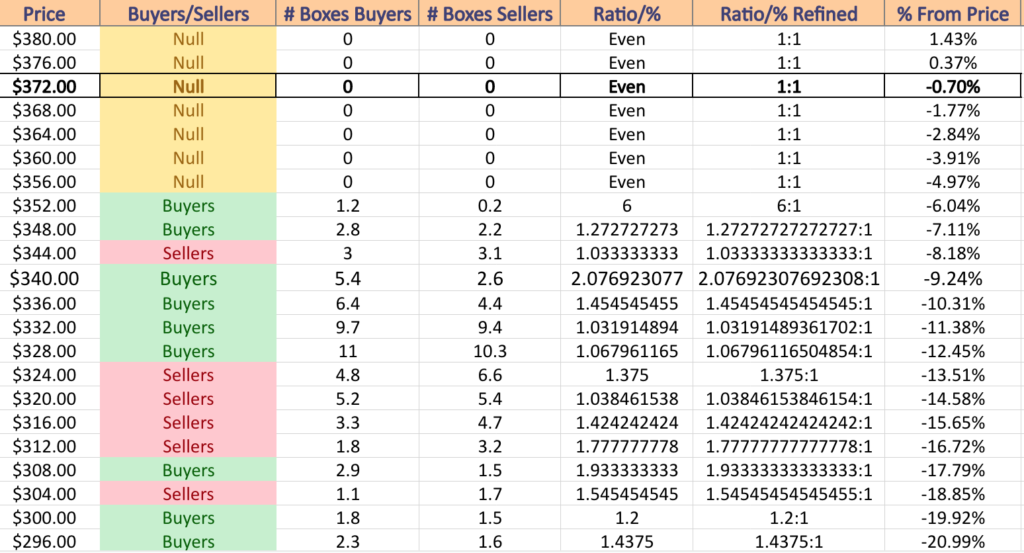
The $336-340 zone will also be a place to keep an eye on should prices dip that low.
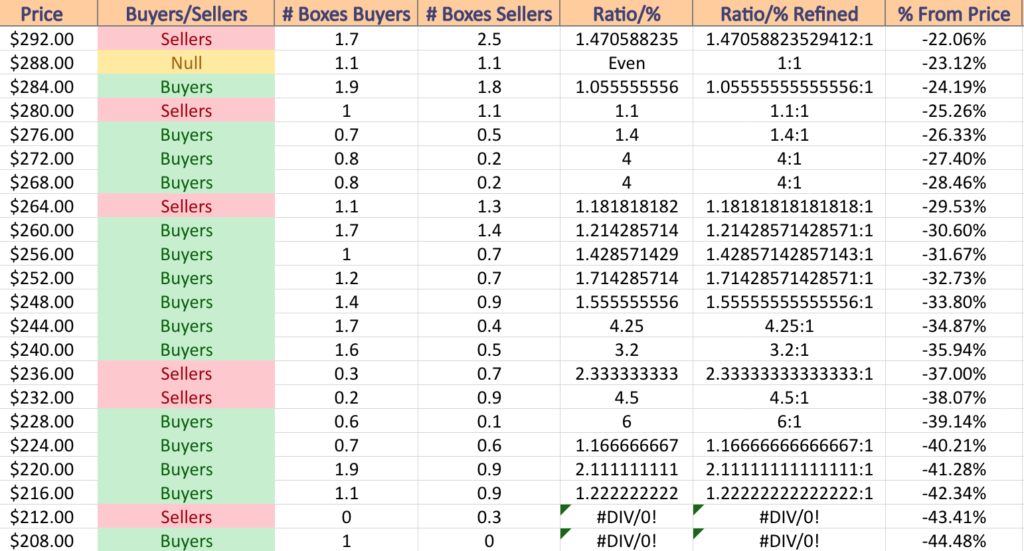
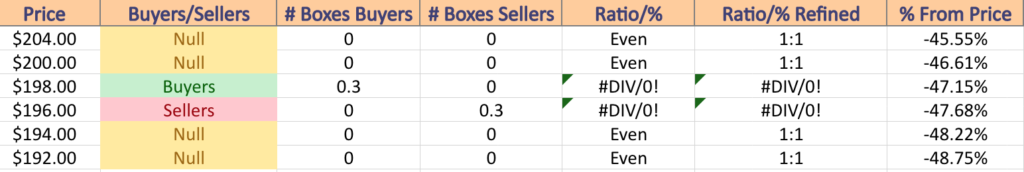
Those are the strongest current buyer dominated zones within -12.5% of the current price & the sellers come out in droves for an additional 4-5% below that, which would pose a challenge to the support of the 52-week low from March of 2023.
Given that this is ~18% below their current price there is time to see how things may go should declines venture that far south, but given the space between the current price & support levels it may come sooner than we think.
DIA has support at the $355.76 (50 Day Moving Average; Volume Sentiment: Buyers, 6:1), $353.53 (Volume Sentiment: Buyers, 6:1), $348.67 (Volume Sentiment: Buyers, 1.27:1) & $342.39/share (Volume Sentiment: Buyers, 2.08:1) price levels, with resistance at the $375.40 (10 Day Moving Average; Volume Sentiment: NULL, 0:0*) & $377.82/share (52-Week High; Volume Sentiment: NULL, 0:0*) price levels.
The Week Ahead
Monday the week kicks off with Consumer Credit data reported at 3pm.
Accolade, Helen of Troy & Jefferies are all scheduled to report earnings on Monday.
Trade Deficit data is scheduled to be released at 8:30 am on Tuesday.
Acuity Brands, Albertsons, AZZ, Neogen, PriceSmart, SMART Global, TD Synnex, Tilray & WD-40 are all scheduled to report earnings on Tuesday.
Wednesday brings us Wholesale Inventories data at 10 am & at 3:15 pm New York Fed President John Williams is scheduled to speak.
KB Home is set to report earnings on Wednesday.
Things heat up on Thursday with Initial Jobless Claims, CPI & Core CPI Year-over-Year data released at 8:30 am, followed by the Budget Statement at 2pm.
Friday the week winds down with PPI & Core PPI Year-over-Year data at 8:30 am.
Delta Airlines, Wells Fargo, Bank of America, BlackRock, BNY Mellon, Citigroup, JPMorgan Chase & United Health are all due to report earnings on Friday.
See you back here next week!
*** I DO NOT OWN SHARES OR OPTIONS CONTRACT POSITIONS IN SPY, QQQ, IWM OR DIA AT THE TIME OF PUBLISHING THIS ARTICLE ***