Triumph Group, Inc. stock trades under the ticker TGI & closed at $15.39/share on 12/8/2020.
TGI stock’s 50 Day Moving-Average recently crossed the 200 Day Moving-Average, showing technical strength that began with a major gap up on 11/9/2020.
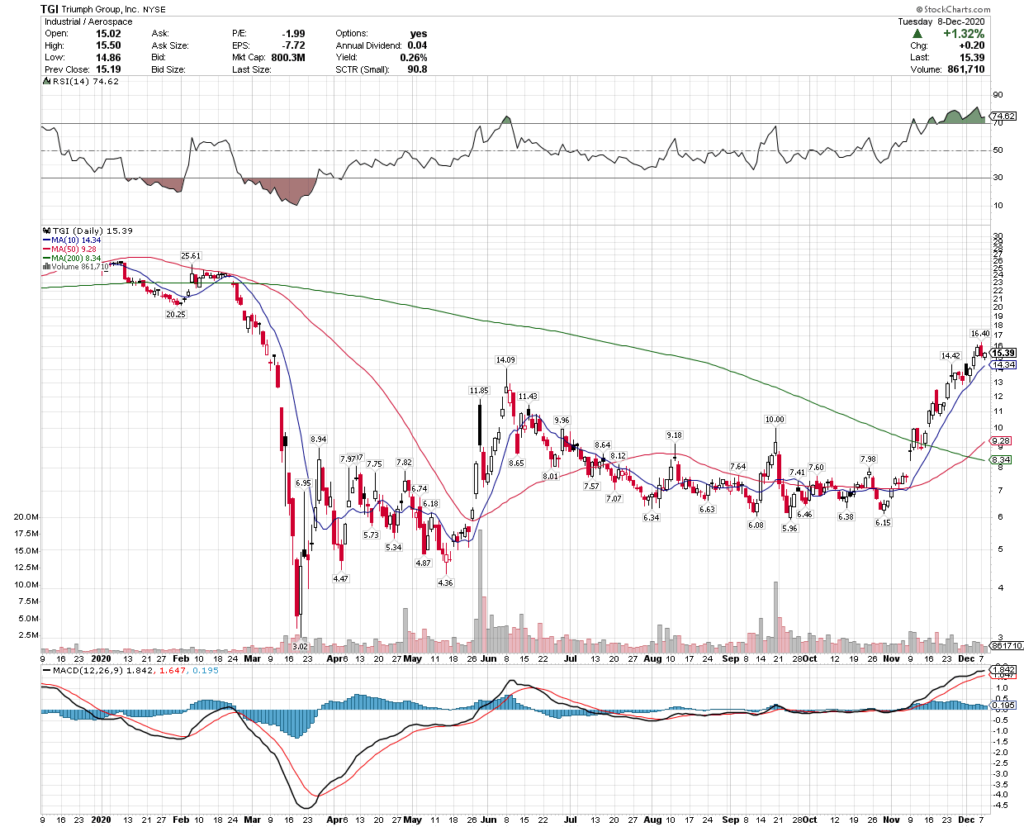
TGI Stock Price: $15.39
10 Day Moving-Average: $14.34
50 Day Moving-Average: $9.28
200 Day Moving-Average: $8.34
RSI: 74
TGI’s RSI is a bit high, and their MACD trend looks like it may be overlapping/running out of steam, so traders who are only interested in the common shares may want to be looking to unload their shares quickly after getting a profit.
A well timed entry will be key in this scenario, as their 10 Day Moving-Average is 6% away from their price/share & will continue creeping higher.
From an options perspective, I would be purchasing calls that are already in-the-money to account for the pullback that may occur – the $15 calls have a delta of 0.59, and the $12.50 calls have a delta of 0.87.
From the puts perspective, I’m looking at the almost at-they-money $15 puts, with a delta of -0.41, and or the in-the-money puts at $17.50, whose delta is -0.77.
*** I DO NOT OWN SHARES OF TGI STOCK ***