Last week the S&P 500 & NASDAQ indexes continued inching lower, with the ETFs that track each index completing bearish MACD crossovers, as their RSI‘s retreated back towards neutral (50).
SPUU, the Direxion Daily S&P 500 Bull 2X Shares ETF fell on about average trading volume compared to the year prior.
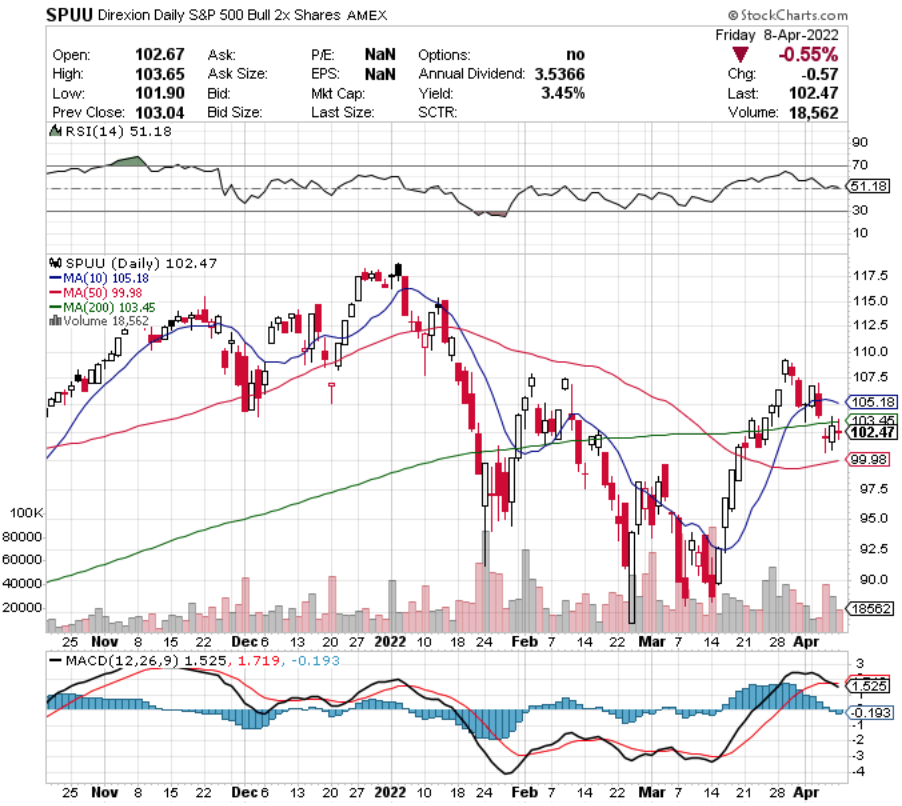
With <2% between the 10 & 50 day moving averages, there looks to be more declines to come this week, possibly stemming from bad news coming from earnings calls.
QLD, the ProShares Ultra QQQ ETF which tracks the NASDAQ’s performance also had a difficult week, with prices dropping even further than SPUU.
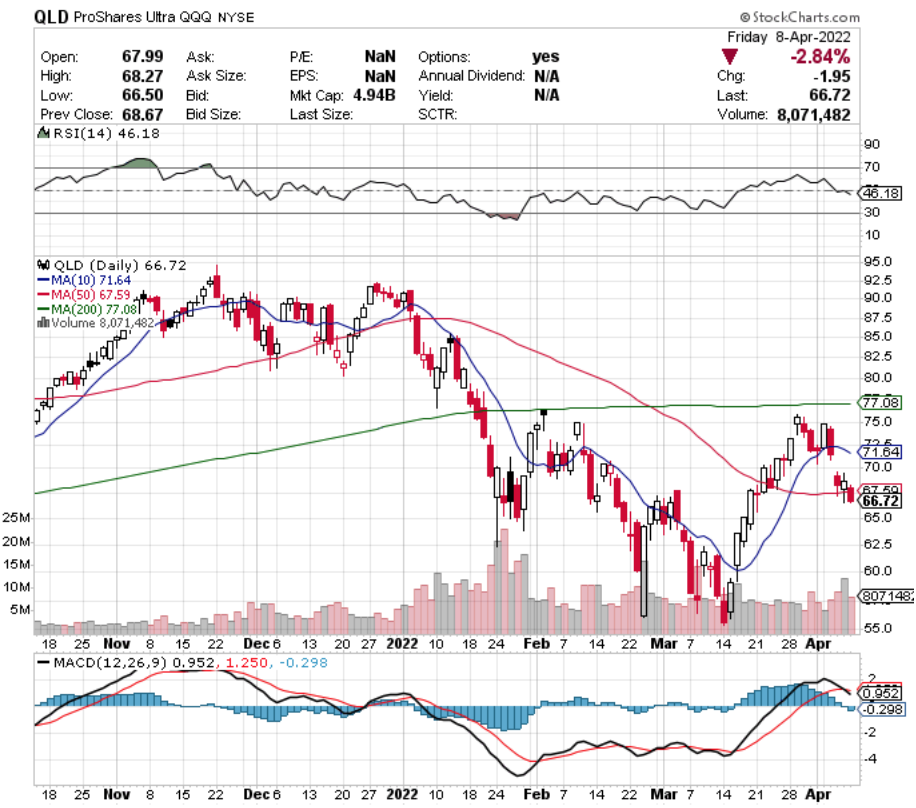
They have been trading on above average volume compared to the year prior, and have an RSI that is below 50, signaling that it is becoming oversold.
There looks to be more downwards room to fall in the near-term for QLD & SPUU, with ~6% between their 10 & 50 day moving averages.
Global Uranium Mining (URNM), Natural Gas (FCG), 20+ Year Treasury Bear (TMV) & Wheat (WEAT) Are All Bullishly Leading The Pack
URNM, the North Shore Global Uranium Mining ETF has been performing well since the end of January 2022 & has just had a bullish MACD crossover.
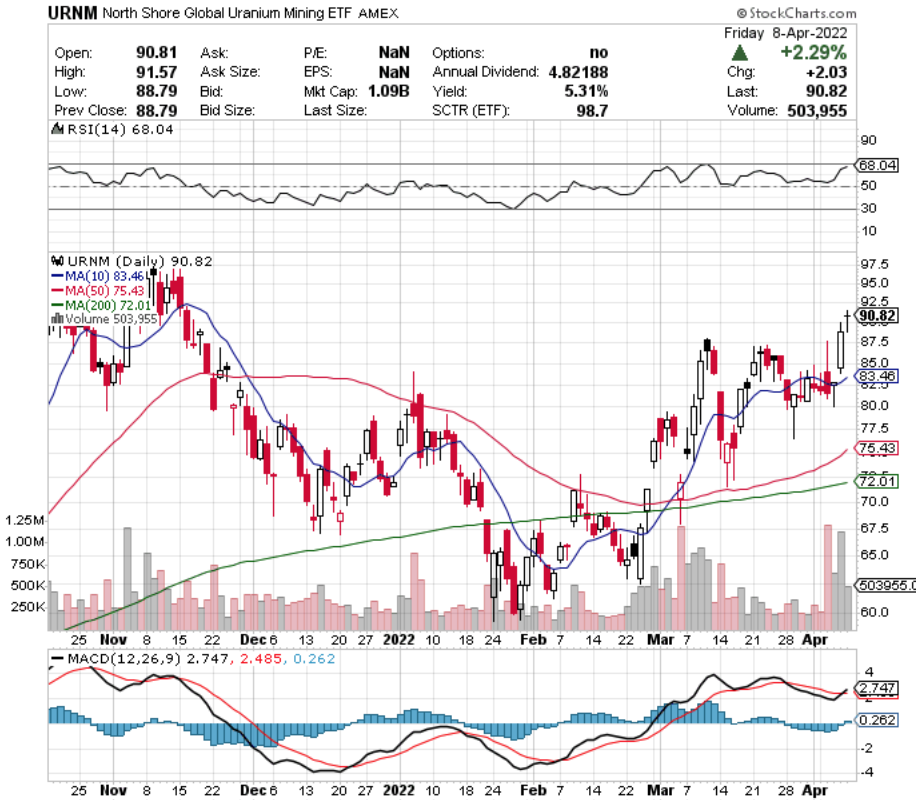
While their RSI is trending into overbought territory in the coming days, their above average trading volume f the past week looks set to continue pushing them higher in the coming days.
URNM does not have options to use for hedging, but they do offer a 5.31% dividend yield which can provide a cushion for returns depending on how long you hold it for.
They look set to establish a new range & continue climbing, which may provide an entry-point for new positions, using the yield as a hedging cushion.
FCG, the First Trust Natural Gas ETF has also been performing strongly since December 2021’s lows, and also recently had a bullish MACD crossover, after a month or so of establishing a new price range in the $24+ range.
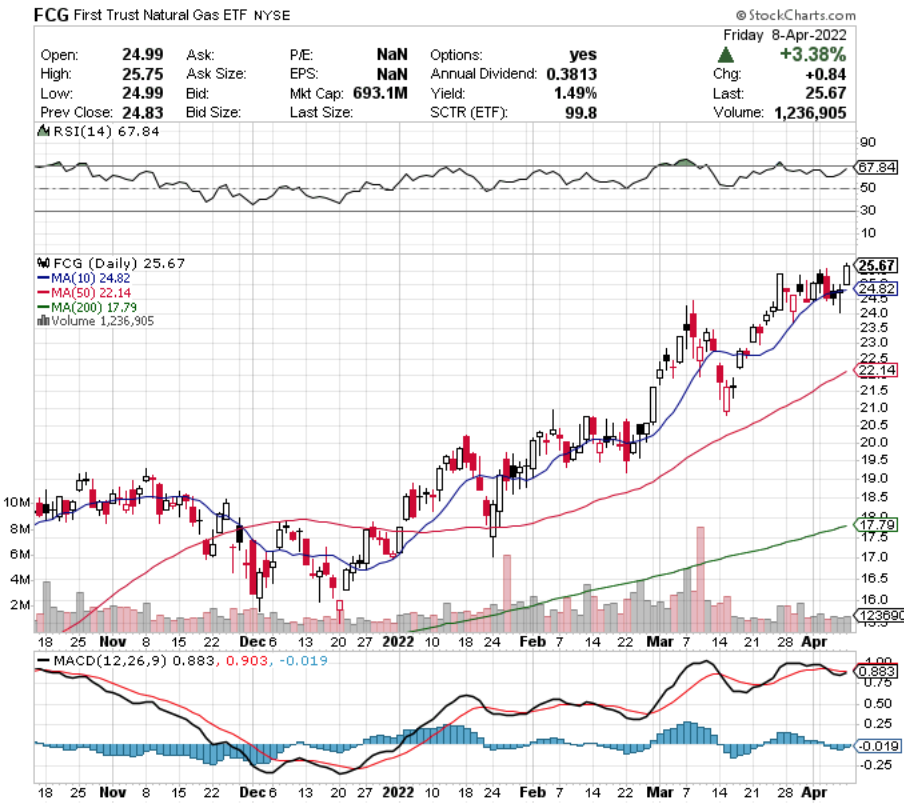
While their RSI is approaching overbought, there looks to be more gains in the near-term as they try to cross over into the $26/share range.
They have options that can be used for hedging against volatility, and for long-only investors they do offer a 1.49% dividend yield, which can act as a small cushion against volatility.
TMV, the Direxion Daily 20+ Year Treasury Bear 3X Shares ETF has been steadily gaining since the beginning of December 2021.
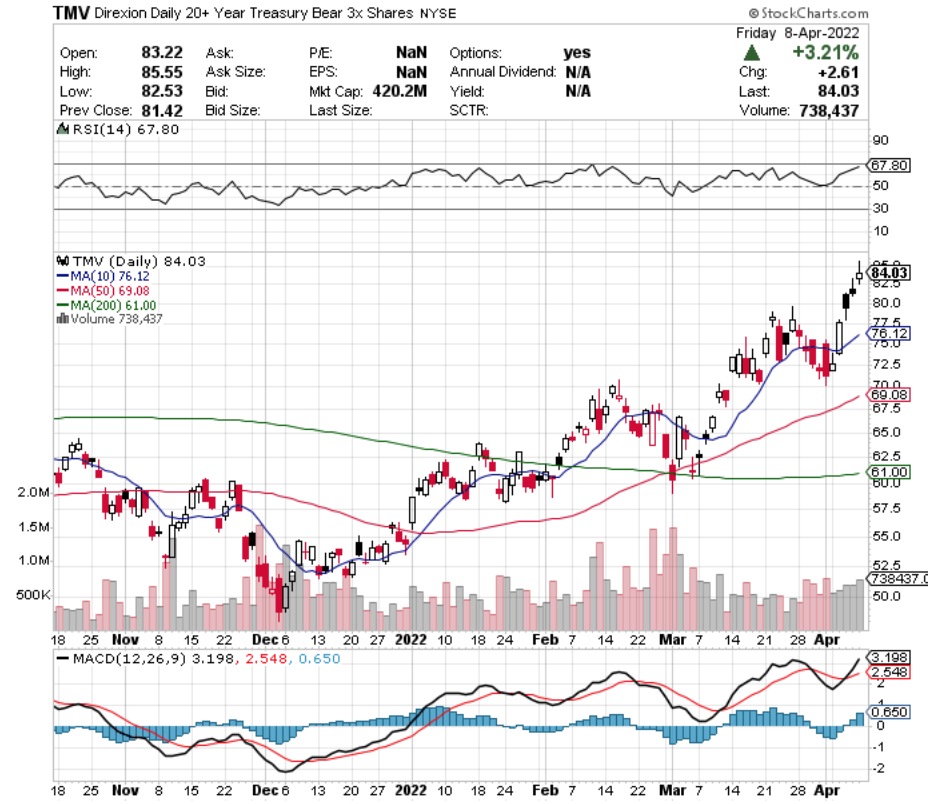
Their recent trading volumes have been above average, their MACD is signaling very bullish, and their RSI is almost 68, signaling that they’re approaching overbought.
TMV may be worth trading some options around as a new price range is established & the profits can then be used to buy in after the technicals signal a better entry-point.
WEAT, the Teucrium Wheat Fund ETF has been steadily rising since October of 2021, although since March of 2022 has held tight in the $10-11/share price range.
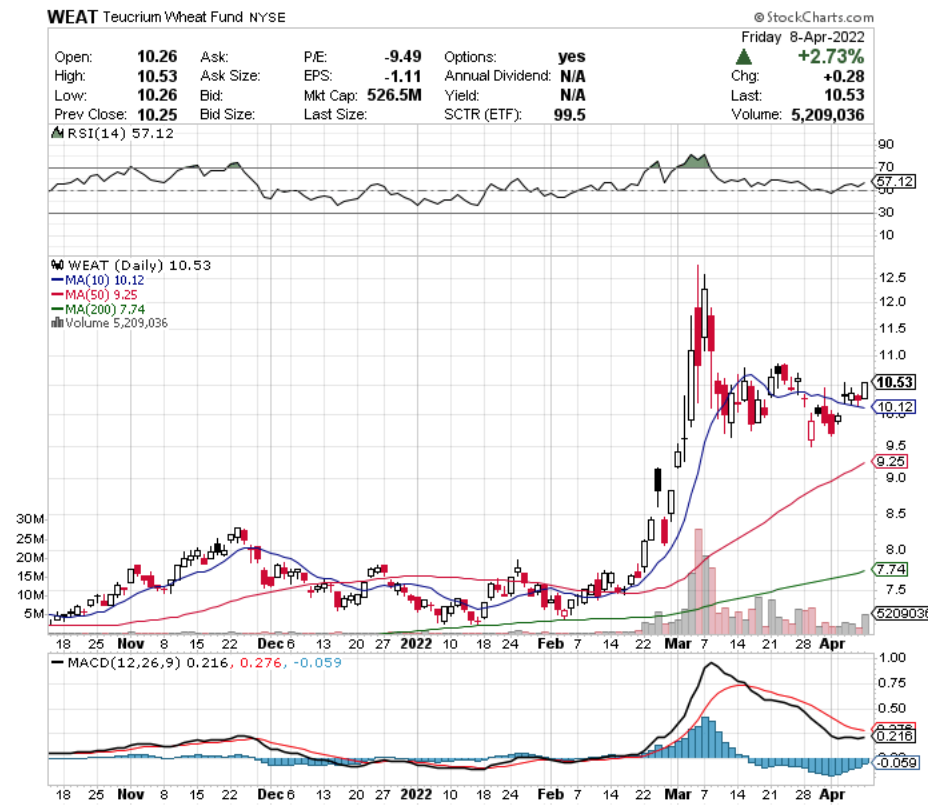
Their trading volume has been perking up, and their MACD is beginning to curl upwards signaling bullishness on the horizon.
With an RSI that is still in the neutral-ish area, WEAT may be ready to run in the near-term & since they have options this can be highly profitable while establishing a new position.
Cannabis (TOKE), Pop Culture Disruption (VPOP), e-Commerce (EBIZ) & Homebuilders (XHB) Are All Bearishly Lagging The Pack
TOKE, the Cambria Cannabis ETF has been having a difficult run since November of 2021.
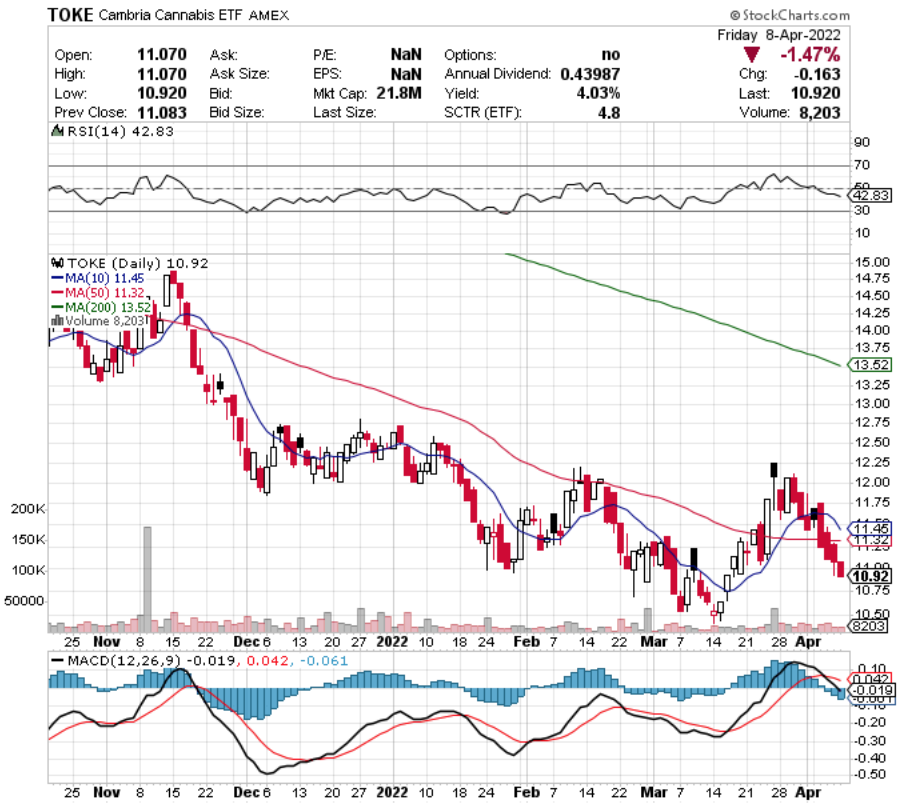
They offer a 4% dividend yield that investors can use as a cushion against volatility, or as additional gains as they hold their position.
TOKE’s MACD is still flashing bearish, but their RSI is about to dip below 40, which is beginning to signal oversold conditions & may warrant a turnaround.
I have a position in TOKE ETF, as disclosed at the bottom of this article.
VPOP, the Simplify Volt Pop Culture Disruption ETF has also been having a tough last year, with their price falling since October of 2021.
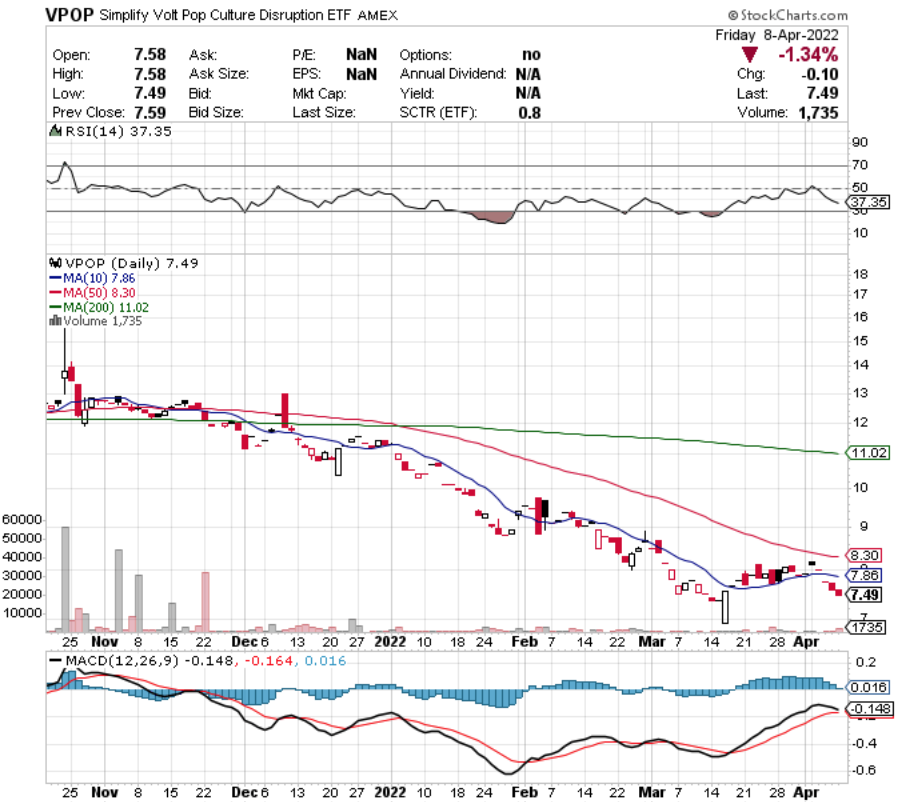
Investors may be disappointed that VPOP does not offer any dividend, and traders will not be pleased that they do not have options, so this is not a name that I would be piling into a new position just yet.
Their MACD & RSI are both signaling that there is more near-term pain to come, and they haven’t had any meaningful trading volume recently, signaling that this is not the time to be looking at them.
EBIZ, the Global X e-Commerce ETF has been in a steady decline since October 2021 as well, although they tried to rebound a bit in March 2021.
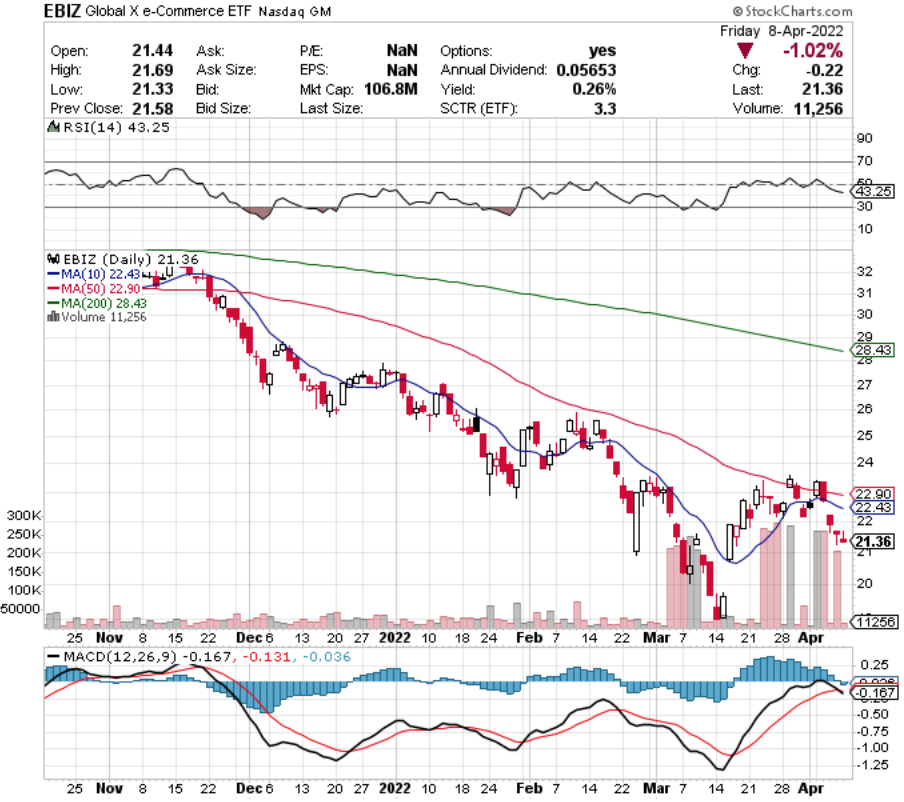
EBIZ has had some higher than average trading volume days recently though, but last week had a bearish MACD crossover, along with an RSI of 43.
With such a minuscule dividend, this doesn’t look like a good time to begin a position, although options can be used to hedge against near-term losses.
XHB, the SPDR S&P Homebuilders ETF has had a difficult 2022, losing almost 26% of their price since the new year began.
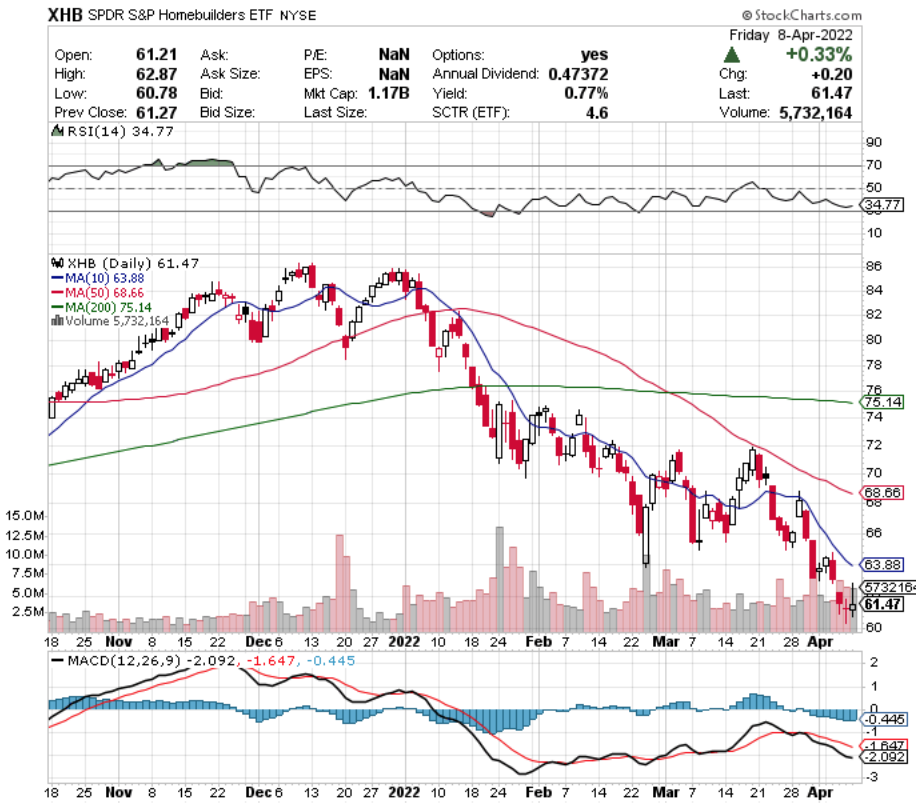
Their volume has been picking up above average though, and their RSI is oversold.
Watch their MACD in the near-term as it is beginning to show signs of turning bullish, which could provide them with the momentum needed to turn it around & begin climbing again.
Tying It All Together
This should be an interesting week, where earnings calls will meet Fed inflation predictions, CPI & unemployment data.
It is also a short trading week, as Friday is a holiday, which may also shake things up heading into a long weekend.
It will be interesting to see how much risk investors & traders are willing to take into the weekend, and with Thursday being an options expiration date, seeing how open interest on contracts changes for May 20th.
*** I DO NOT OWN SHARES OF: SPUU, QLD, URNM, FCG, TMV, WEAT, XHB, EBIZ or VPOP. ***
***I HAVE A LONG POSITION IN TOKE ***