SPY, the SPDR S&P 500 ETF gained +1.87% over the past week, having the second strongest week out of the major indexes.
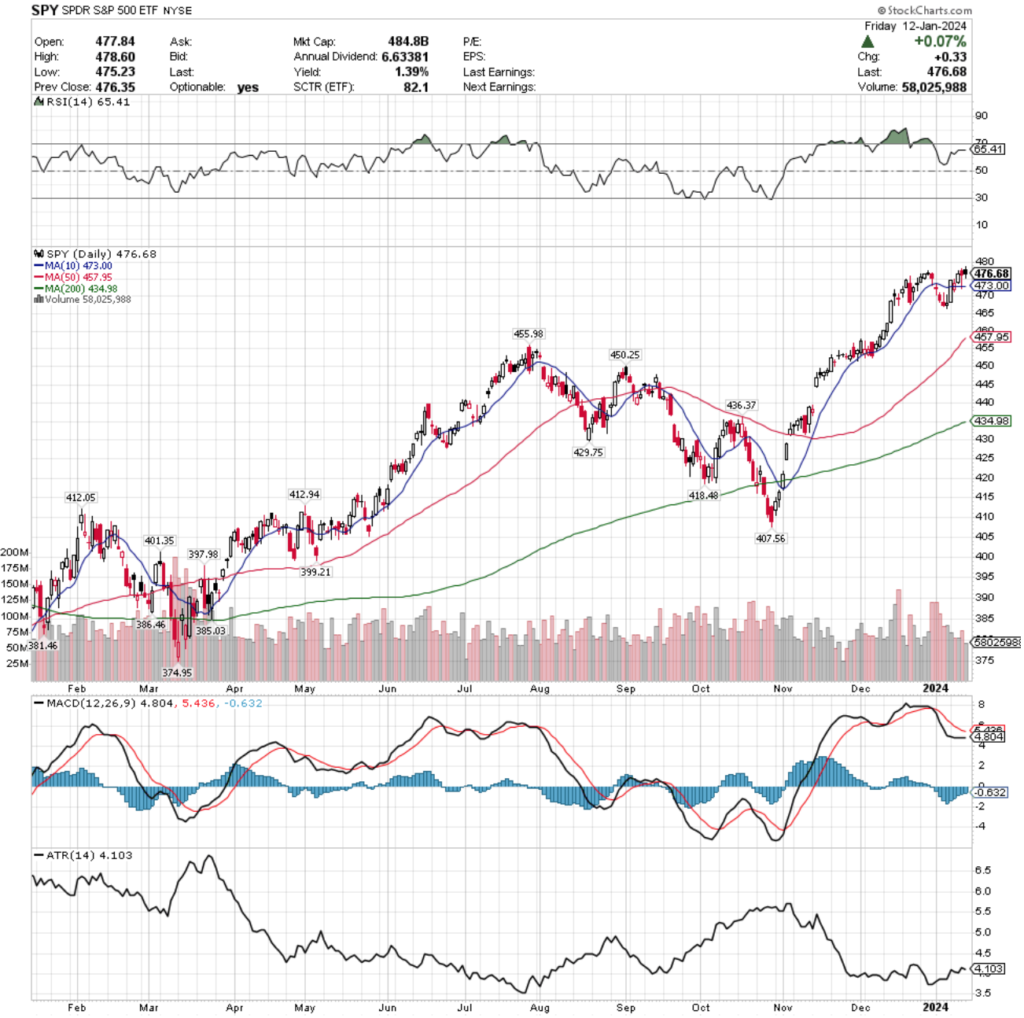
Their RSI is currently moving flatly near the overbought mark of 70 & currently sits at 65.41, while their MACD is bearish but also moving relatively flat towards the signal line, which often is an indication that there are further declines on the near-term horizon.
Volumes were -16.1% below average this week compared to the year prior (68,801,160 vs. 82,000,643), which signals a lack of enthusiasm among investors as they take a “wait & see” approach heading deeper into earnings season.
This lack of volume supporting the upwards price movement of last week confirms that there RSI & MACD “flattening” trends of the past year are likely to occur again & seem to think that next week will provide SPY with a downward catalyst.
SPY’s week began with a bullish crossover of the resistance level from the 10 day moving average, gaining back what was lost in a week of declines the week prior on a wide-range candle session.
The following day signaled further uncertainty & weakness at these levels with a bearish candle that opened above the 10 DMA, but there was appetite for slightly higher prices as it tested higher than Monday’s high, but ultimately fell through the 10 DMA’s support, as investors took some profits from the day prior’s gains.
Wednesday continued the theme of caution, as the candle’s real body lacks much of a lower shadow but does have an upper shadow, indicating that there could be room for slight advances, but market participants are still on the fence.
Thursday’s session produced a hanging man candle, an ominous signal, particularly as it tested & broke through the 10 day moving average’s support temporarily, despite opening & closing above it.
Friday the week closed out on an uncertain, but not overly bright note, as the session ended in a spinning top candle, that while bullish day-over-day, had a bearish twist to it given that the day closed lower than it opened.
SPY’s Average True Range is also trending downwards after the past week, indicating that there has been a lack of volatility & no strong trend, which typically precedes an uptick at these low levels.
Something that will be worth continuing to keep an eye on is the 50 day moving average, which is now the second support touch-point.
Given that we are at a new 52-week high, there is limited insight into how strong the 10 & 50 DMA support levels will be, which often means that sellers will be itching to take profits off of the table at these levels.
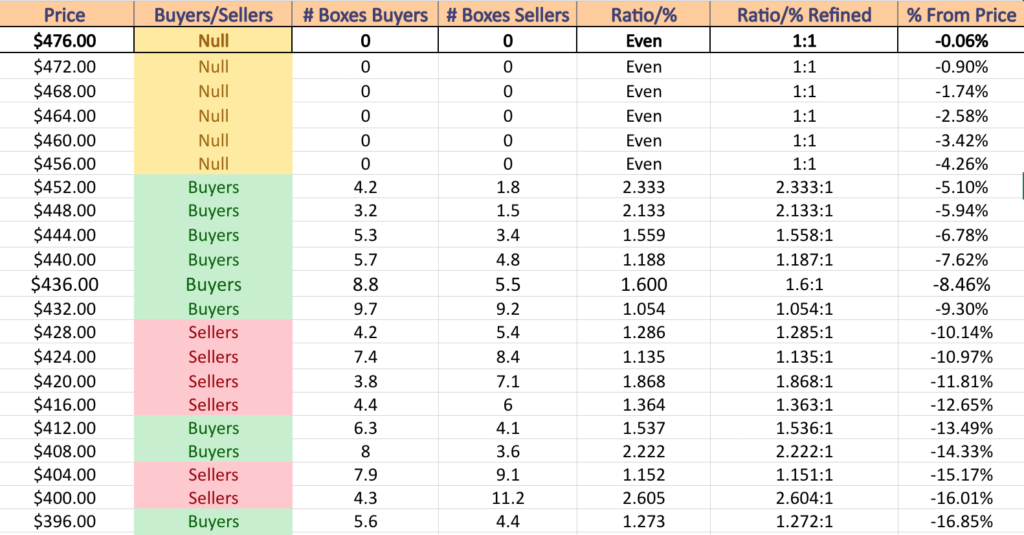
If true, that would mean that there is a risk of a -4.34% move for SPY to the downside before it reaches a support level that has past tendencies to be Buyer oriented ($455.98/share has been 2.33 Buyers to each Seller over the past 1-2 years).
Should that level be tested, it may pave the way for further consolidation, as aside from the $436-439.99/share price zone (-7.62% from current price), the Buyer dominance dilutes until a -9.3% drop in price, at which point a seller dominated price zone is entered at $431.99/share, where the seller influence stays strong until a decline of -12.65% from the current price.
That’s not to say that this will be the case, but based on past buyer & seller behavior it is something to keep an eye on should SPY find itself needing to find support.
SPY has support at the $473 (10 Day Moving Average; Volume Sentiment: NULL, 0:0*), $457.95 (50 Day Moving Average; Volume Sentiment: NULL, 0:0*), $455.98 (Volume Sentiment: Buyers, 2.33:1) & $450.25/share (Volume Sentiment: Buyers, 2.13:1) price levels, with no past year resistance levels as they are at their 52-week high.
QQQ, the Invesco QQQ Trust ETF advanced +3.23% over the past week, having the strongest weekly performance of the major indexes.
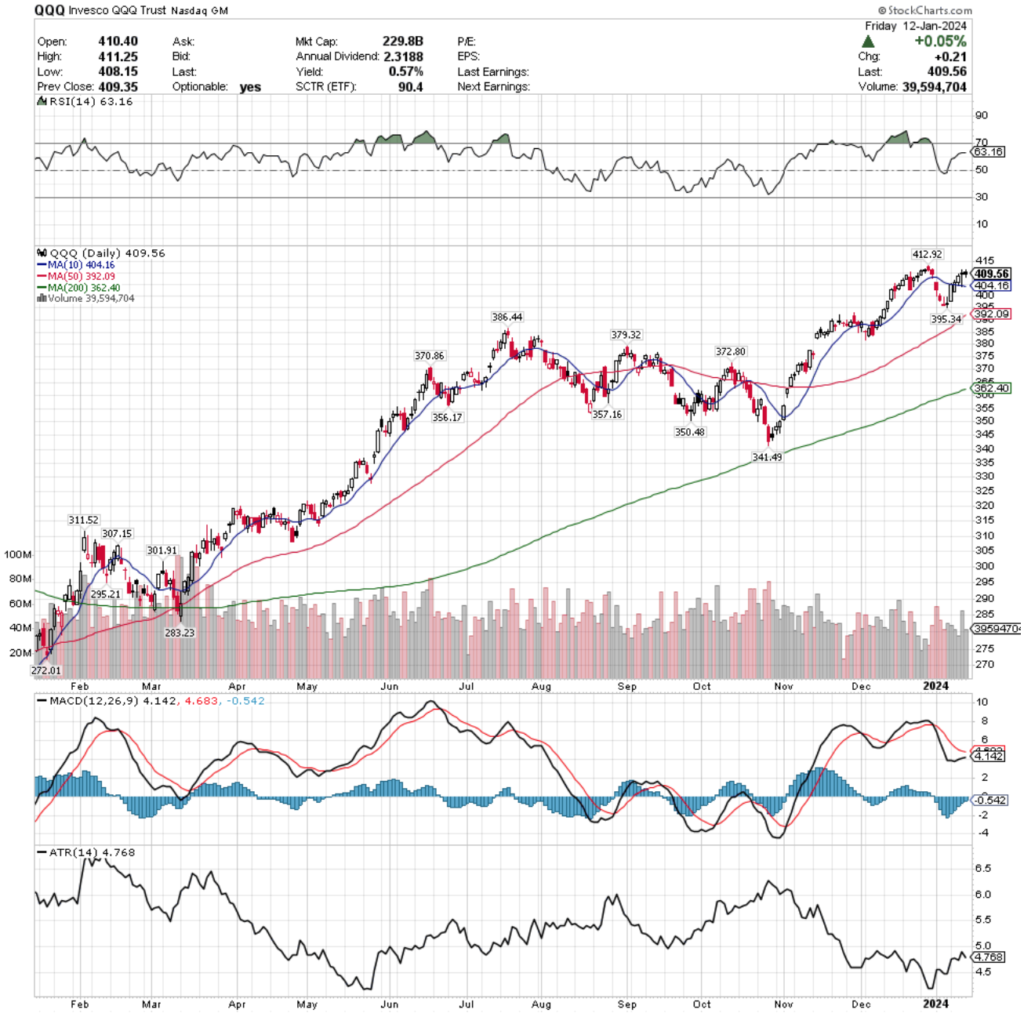
Like SPY, QQQ’s RSI is also relatively flat & currently sits closer to overbought than neutral at 63.16, while their MACD line is also relatively flat, but approaching the signal line.
Volumes were -19.76% lower than average last week compared to the year prior (41,937,420 vs. 52,265,769), which is not a signal of strength following the +3.23% advance of last week.
The previous week & a half had been steady declines, which notably featured the breakdown of the support of the 10 day moving average, so this weak level of volumes on a week of only advancing sessions indicates extreme caution & that folks aren’t eager to jump back into the pool just yet.
Monday opened the week up with a wide range candle that was unable to break the resistance of the 10 day moving average.
Tuesday opened midway through Monday’s candle’s real body & marched higher to close narrowly above the 10 DMA, with a slight upper shadow indicating that there was some slight risk on apetite.
Wednesday the support of the 10 day moving average was maintained as the session moved QQQ higher.
Thursday is when things began to get a bit more dicey & cracks began to show for QQQ’s near-term outlook.
The highest volume session of the week looks to have contained a bit of profit taking by market participants, who ultimately decided that they were uncertain of QQQ’s valuation at its current price level.
The dragonfly doji candle marked the session, but the test to the downside did temporarily break the support of the 10 day moving average, signaling that there is not much conviction behind its strength at these price levels (also indicates the profit taking from the prior sessions of the week).
Friday’s session also resulted in a doji that only budged forward +0.05% from Thursday, which is not a strong indicator of confidence.
Much like SPY, QQQ’s Average True Range is also trending downward, but the price action of the past few sessions looks to have formed an inverse head & shoulders pattern in the ATR line, which would indicate there is volatility on the horizon.
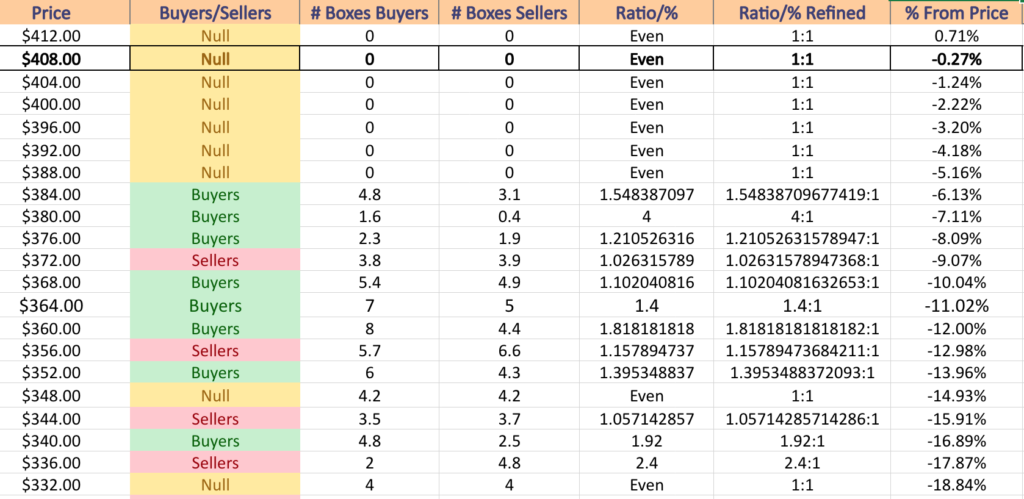
QQQ has more support near the current price than SPY does, which will help some of the near-term volatility, however a -5.65% decline is facilitated by the fact that there is limited volume data for these levels before a support level that is historically 1.55 Buyers to every Seller occurs.
Due to the five & a half month floundering around in the consolidation range of $386.44-341.49 there may be some strength here for support, but sellers will still be coming out at these levels.
There is a -13.96% potential decline that currently has mostly buyer dominated sentiment over the past 1-2 years, but it seems most likely that if there is a downside test that breaks that $386.44 price level that the Buyer zones below will either become more diluted, or become Seller dominated in the near-to-mid term.
QQQ has support at the $404.09 (10 Day Moving Average; Volume Sentiment: NULL, 0:0*), $395.34 (Volume Sentiment: NULL, 0:0*)$392.08 (50 Day Moving Average; Volume Sentiment: NULL, 0:0*) & $386.44/share (Volume Sentiment: Buyers, 1.55:1) price levels, with resistance at the $412.92/share (Volume Sentiment: NULL, 0:0*) price level.
IWM, the iShares Russell 2000 ETF had the weakest week by major index, declining -0.01%.
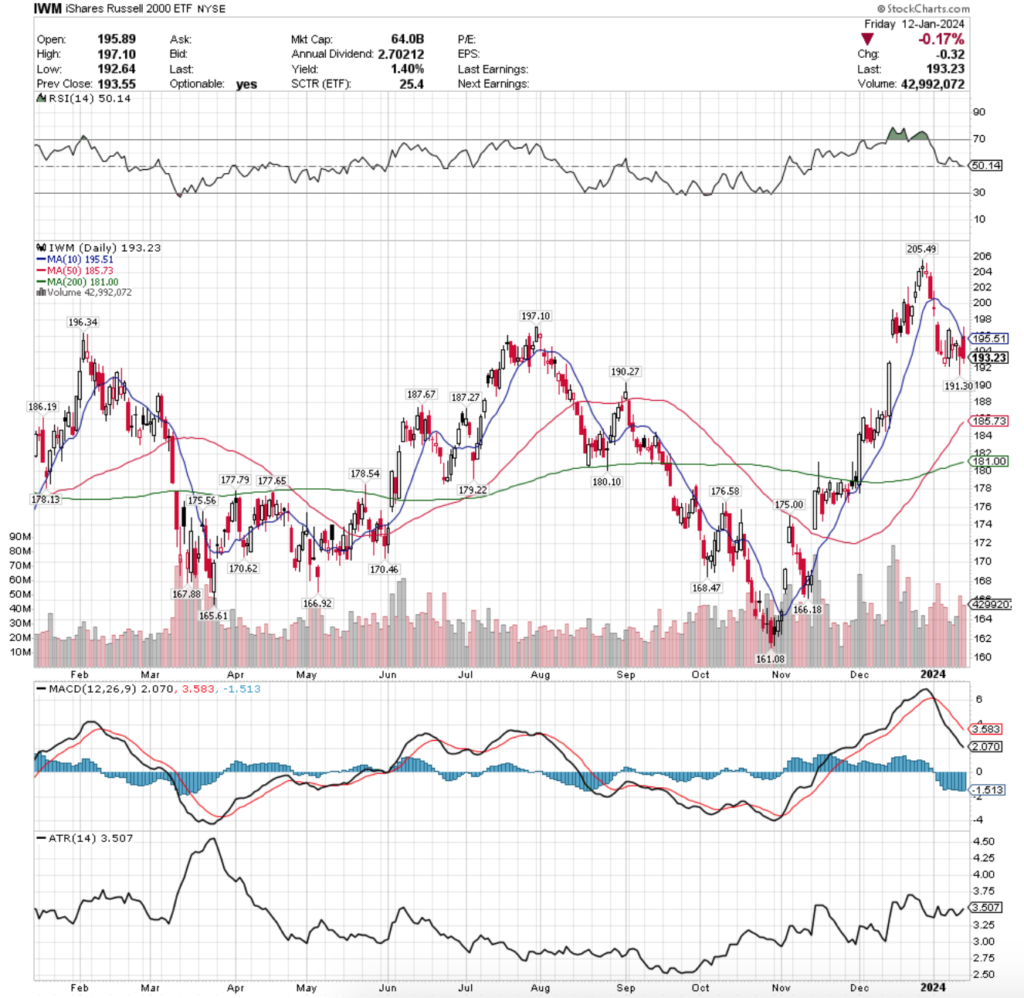
Their RSI is neutral at 50.14, while their MACD is in bearish decline following the declines of the new year.
Volumes were +15.74% above average last week compared to the year prior (37,456,920 vs. 32,362,470), which casts a bearish picture given that the two strongest sessions by volume were Thursday & Friday’s declines.
Monday’s session stopped the bleeding from last week with a wide range candle, however the lower shadow is longer than the upper shadow meaning that there was still a test for more downside & Monday’s session also had the lowest volume of the week, despite having the widest real body (also bearish).
The rest of the week became a consolidation range that filled in the window left by a gap up from early-to-mid December.
Tuesday’s session produced a bearish harami pattern, while Wednesday’s candle was a hanging man, signaling indecision & a probable reversal to the downside.
Thursday confirmed this & gave us a test to the downside, with the very long lower shadow hitting -1.94% lower than the session prior’s close.
Friday opened markedly higher as investors wanted to test the resistance of the very bearish looking 10 day moving average.
While IWM temporarily broke out above it, it was short lived & the day closed lower & tested even lower than where it closed.
Given the high volume of these sessions & their continuance to test to the downside, it appears that the near-term outlook for IWM is also bleak & will feature further consolidation/declines.
Their ATR is currently trending upwards, meaning that we may begin to see some even larger, more volatile moves in the coming week.
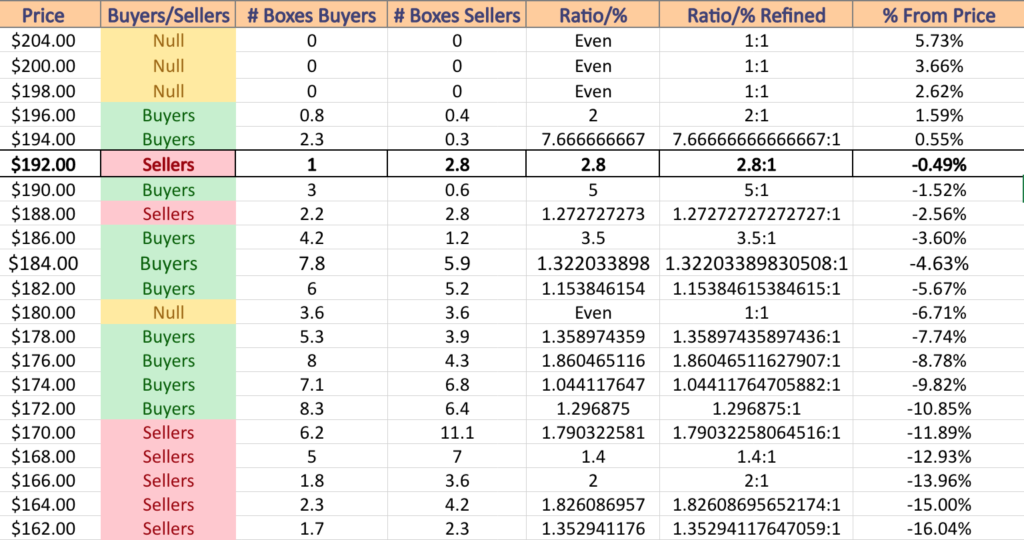
There is a lot of historic Buyer sentiment for IWM at their next support levels from the past 1-2 years, which is mostly all Buyer dominated for the next -10.85% minus the $188-189.99 zone that the sellers dominated & the $180-181.99/share zone which has been even Buyers:Sellers 1:1.
Given the way IWM tends to oscillate around a more centralized zone of prices compared to the aggressive growth of other indexes this may hold up, but if it breaks down there is nothing but Seller sentiment all the way down to their 52-week low.
IWM has support at the $191.30 (Volume Sentiment: Buyers, 5:1), $190.27 (Volume Sentiment: Buyers, 5:1), $187.67 (Volume Sentiment: Buyers, 3.5:1) & $187.27/share (Volume Sentiment: Buyers, 3.5:1) price levels, with resistance at the $195.49 (10 Day Moving Average; Volume Sentiment: Buyers, 7.67:1), $196.34 (Volume Sentiment: Buyers, 2:1), $197.10 (Volume Sentiment: Buyers, 2:1) & $205.49/share (Volume Sentiment: NULL, 0:0*) price levels.
DIA, the SPDR Dow Jones Industrial Average ETF edged forward +0.34% last week, as they have slowed down over the past two weeks after a couple of months of explosive growth & being an investor favorite.
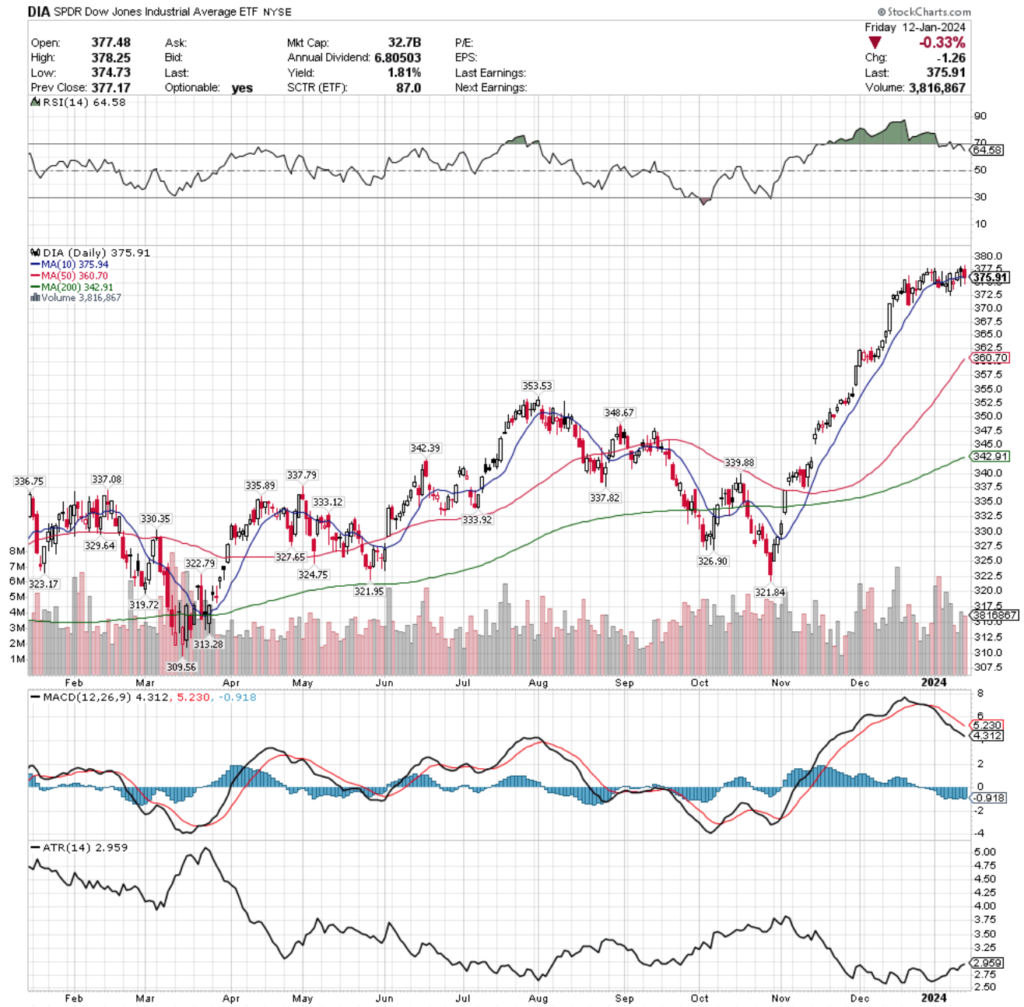
Their RSI is trending back towards neutral from overbought, but still sits high at 64.58, while their MACD is declining.
Volumes were +5.57% above average last week compared to the year prior (3,693,380 vs. 3,498,473), indicating that there is a great deal of indecision among investors at this price level, given how small their week’s advance was.
Monday kicked the week off on a bullish note, with a wide range session that briefly tested lower before powering through the resistance of the 10 day moving average.
Tuesday thought began to indicate that there is weakness in the current price sentiment, as the day closed with a spinning top candle that completed a bearish harami that opened & closed below the 10 DMA & was unable to break through it to the upside during the day’s session.
Wednesday opened below the 10 DMA, but was able to break through the resistance, but it should be noted that this move was done on the weakest volume of the week, which is not a signal of confidence.
Thursday confirmed this, when a hanging man candle closed the session indicating that there is far more interest in prices being lower than their current mark (as noted by the lower shadow, which broke deep below the 10 DMA’s support) & the candle itself’s real body closed lower than it opened, indicating weakness & uncertainty.
The risk-off theme continued on Friday, with a declining session that broke through the support of the 10 day moving average, tested much lower, before closing just beneath it.
The 10 DMA is also beginning to curl over bearishly, which would mean that its resistance level would be applying downward pressure on DIA’s share price.
This is troubling, as like SPY & QQQ, DIA’s 50 DMA is the next highest level of support, but currently does not have meaningful enough data to gauge whether it is a buyer or seller dominated zone over the past 3-4 years.
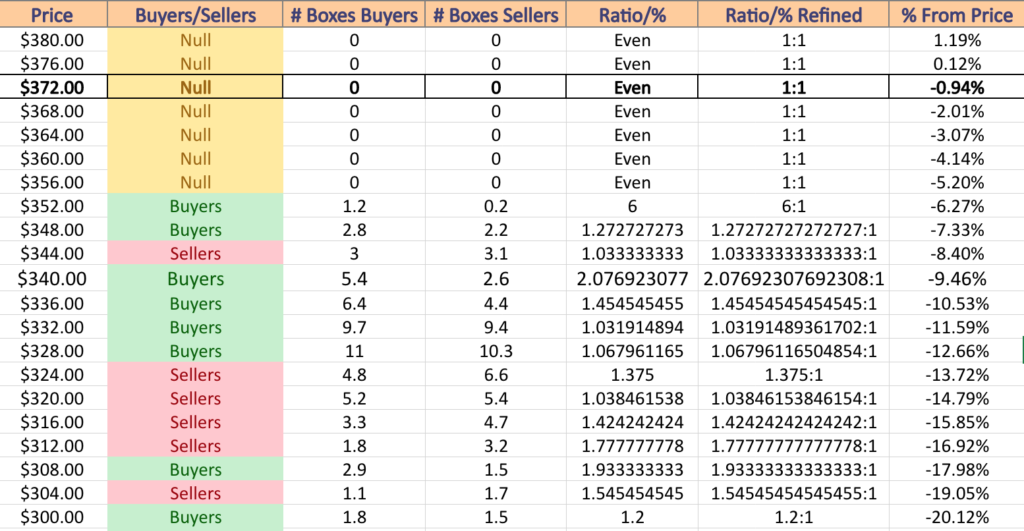
The next support level is -5.95% below the current price, which while it is Buyer dominated 6:1, it has not faced any downside pressure over the past 3-4 years, so it will likely not hold up particularly strongly (at least as strongly as the 6:1 ratio implies).
The $319-321 support zone will be an interesting area to keep an eye on should prices decline towards there, as it is seller dominated, but has not been tested much to the upside.
In the event that it does not hold up, there is likely going to be a re-test of the 52-week low based on the Seller Sentiment at those price levels.
Their ATR is beginning to perk higher, indicating that there is slightly more volatility in DIA’s trading, which will likely continue into earnings season as investors begin to take chips off of the table in the beginning of the new year.
DIA has support at the $360.70 (50 Day Moving Average; Volume Sentiment: NULL, 0:0*), $353.53 (Volume Sentiment: Buyers, 6:1), $348.67 (Volume Sentiment: Buyers, 1.27:1) & $342.91/share (200 Day Moving Average; Volume Sentiment: Buyers, 2.08:1) price levels, with resistance at the $375.91/share (10 Day Moving Average; Volume Sentiment: NULL, 0:0*) price level.
The Week Ahead
Monday there are no major data announcements or earnings reports as the markets will be closed for Martin Luther King day.
Tuesday Fed Governor Christopher Waller is scheduled to speak at 11 am.
Goldman Sachs, Calavo Growers, Fulton Financial, Hancock Whitney, Interactive Brokers, Morgan Stanley, Pinnacle Financial Partners, PNC & Progress Software are all scheduled to report earnings on Tuesday.
Wednesday kicks off with Import Price Index, Import Price Index minus Fuel, U.S. Retail Sales & Retail Sales minus Autos at 8:30 am, Fed Vice Chair for Supervision Michael Barr & Fed Governor Michelle Bowman speak at 9 am, before Industrial Production & Capacity Utilization data are released at 9:15 am.
After that on Wednesday, the Fed’s Beige Book is released at 2pm, followed by New York Fed President John Williams speaking at 3pm.
Kinder Morgan, Alcoa, Charles Schwab, Citizens Financial Group, Discover Financial Services, H.B. Fuller, Prologis, Synovus, U.S. Bancorp & Wintrust Financial all report earnings on Wednesday.
Atlanta Fed President Raphael Bostic speaks at 7:30 am & 12:05 pm on Thursday, in addition to Initial Jobless Claims, the Philadelphia Fed Manufacturing Survey, Housing Starts & Building Permits data being released at 8:30 am.
Bank OZK, F.N.B. Corp, Fastenal, First Horizon, Home Bancshares, J.B. Hunt Transport, KeyCorp, M&T Bank, Northern Trust, PPG Industries, Texas Capital Bancshares & WNS are all reporting earnings on Thursday.
Friday the week winds down with Consumer Sentiment (prelim) & Existing Home Sales at 10 am, Fed Vice Chair for Supervision Michael Barr speaking at 1om & San Francisco Fed President Mary Daly speaking at 4:15pm.
Travelers, Ally Financial, Comerica, Fifth Third, Huntington Banc, Regions Financial, SLB & State Street are all scheduled to report earnings on Friday.
See you back here next week!
*** I DO NOT OWN SHARES OR OPTIONS CONTRACT POSITIONS IN SPY, QQQ, IWM OR DIA AT THE TIME OF PUBLISHING THIS ARTICLE ***