SPY, the SPDR S&P 500 ETF gained +1.21% this past week, having the second strongest week of the major indexes.
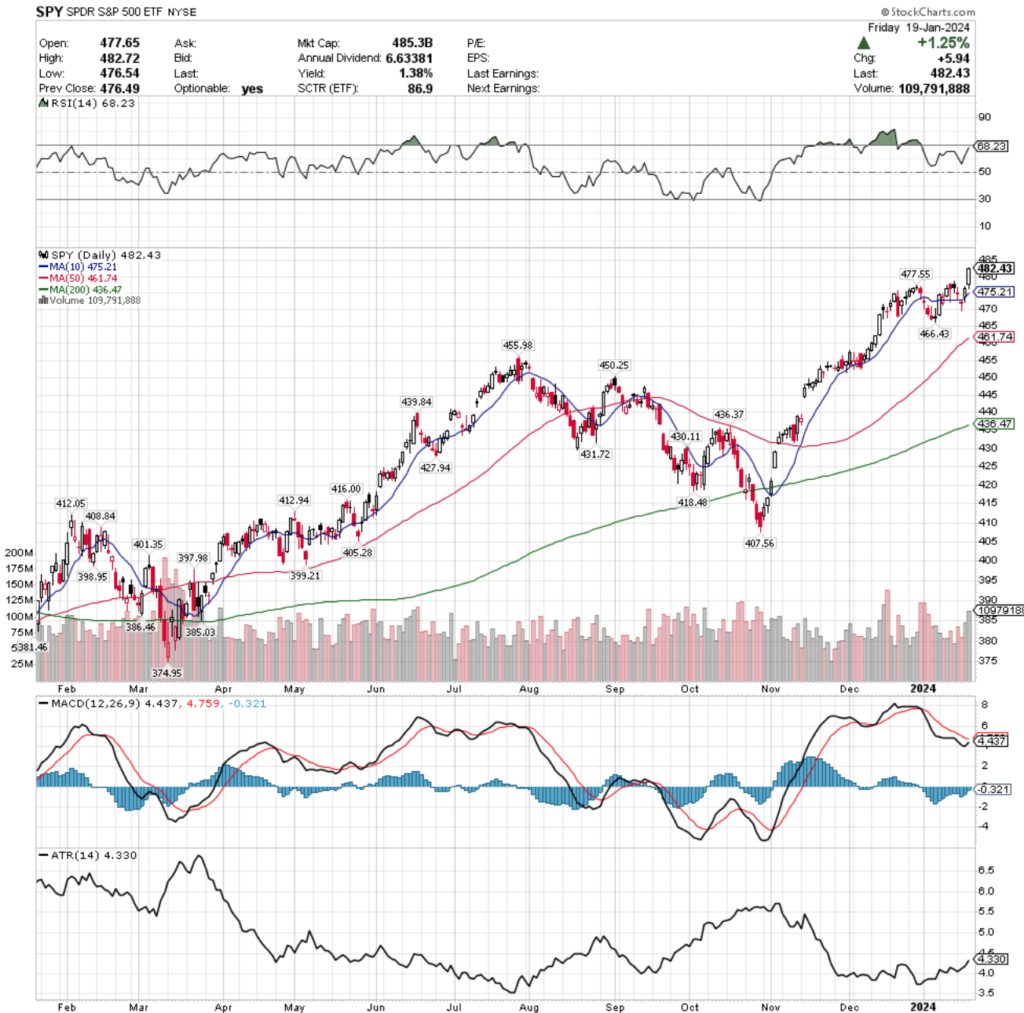
Their RSI is trending towards overbought levels again & is currently 68.23, while their MACD line is currently bearish, but trending upwards towards the signal line following the past two sessions.
Volumes were +4.46% above average this past week compared to the year prior (85,804,734 vs. 82,139,551), which emphasizes the squeezes set for 1/19 options contract expirations of Thursday & Friday’s sessions, as the three prior sessions in the week were on weak volumes.
Monday the week kicked off on a cautious & uncertain note, as the candle’s real body was near exactly the same as Friday’s & despite the session opening slightly above Friday’s close, the close was lower than the open, indicating weakness.
Tuesday continued that theme, as the day resulted in a doji candle whose upper shadow tested the closing price of Monday’s session to the upside, while also testing the support of the 10 day moving average before closing right in the middle of the day’s range.
The declines continued into Wednesday with a more bearish tone, as the day opened on a gap down below the 10 DMA, tested lower, but ultimately closed near the open at the top of the day’s range, creating a dragonfly doji & setting the stage for the reversal of fortune going into the end of the week.
Thursday opened at the 10 DMA support level, tested lower to Wednesday’s open/close area, but trudged higher & signaled that there may be some more appetite to go higher based on their small upper shadow, indicating that the squeeze was going to continue.
Sure enough, Friday showed the strongest volume of the week as shorts were covered & SPY rallied +1.25% heading into the weekend.
While a new 52-week high was set Friday, unless earnings go exceptionally well moving into next week, yesterday’s session is a candidate to be the head of the bearish head & shoulders pattern that has been emerging & mentioned in our other posts over the past few weeks.
There now is a better chance of a consolidation range appearing moving into the near future, as the support of the 10 & 50 day moving averages are now both within -4.29% of the current price.
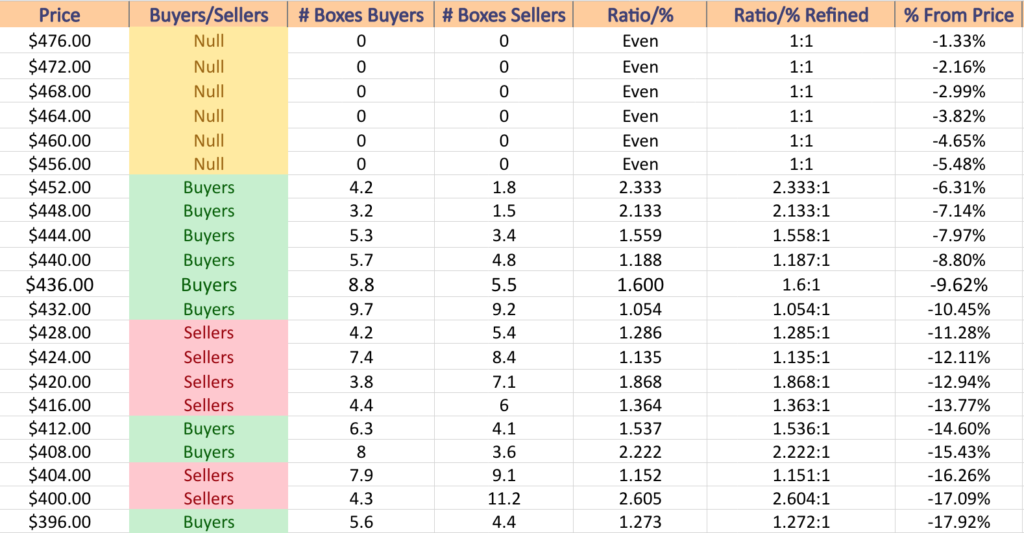
On a note of caution though, in the event of a larger decline those moving averages will begin putting downwards pressure on SPY’s price & force them to retest the $455.98 & $450.25 support levels, which if they are unable to hold up will lead it down to the $436-437 zone where there are currently two support levels.
Currently the $440-443.99 price zone is weak in terms of support, as you can see in the chart below & there are no support levels in the $440-450 price zone.
There is currently not enough meaningful volume data for the closest levels of support for SPY due to them being at an all-time high.
Their Average True Range is moving higher slowly, indicating that volatility has begun to uptick from the quieter sessions of the month leading into the new year.
SPY has support at the $477.55 (Volume Sentiment: NULL, 0:0*), $475.21 (10 Day Moving Average; Volume Sentiment: NULL, 0:0*), $466.43 (Volume Sentiment: NULL, 0:0*) & $461.74/share (50 Day Moving Average; Volume Sentiment: NULL, 0:0*) price levels, with no resistance levels from the past year as they reached a new 52-week high on Friday.
QQQ, the Invesco QQQ Trust ETF advanced +2.84%, as investors favored the technology-heavy NASDAQ 100 names over other major indexes.
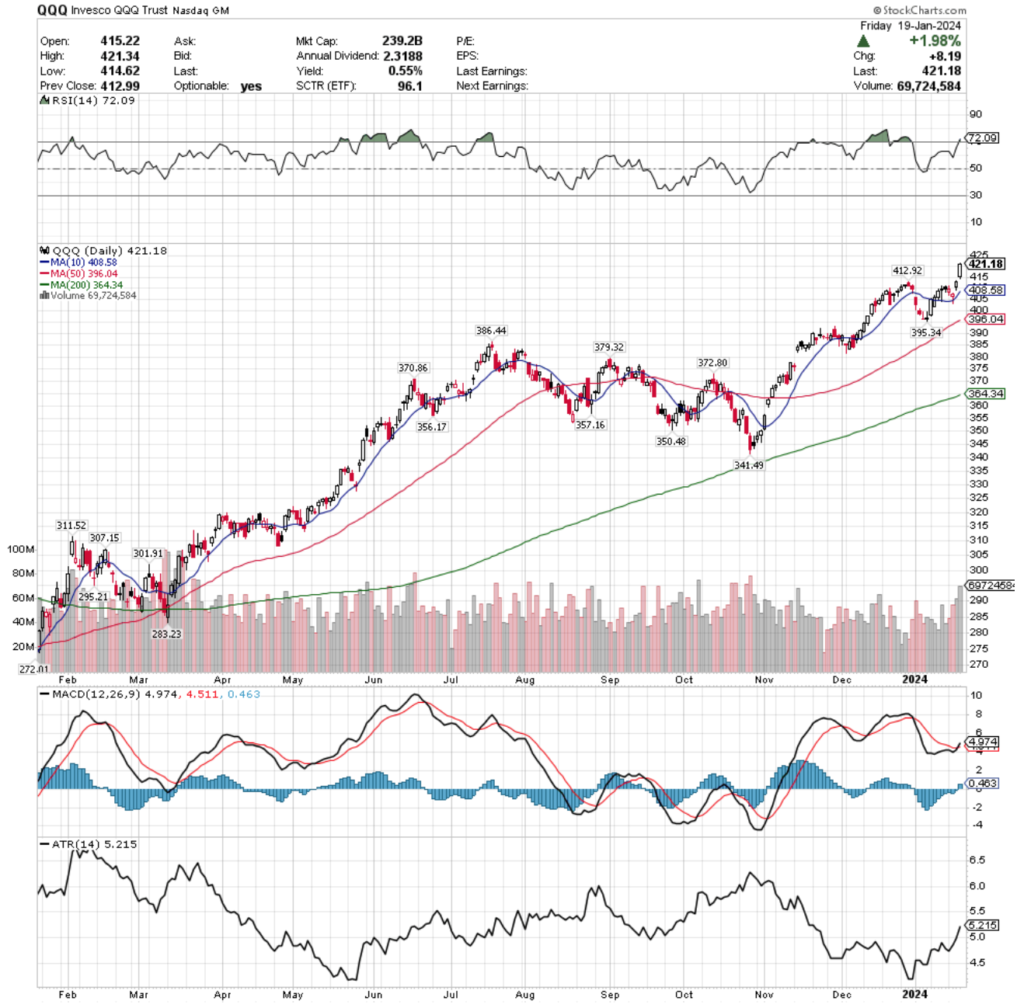
Their RSI is overbought at 72.09 following Thursday & Friday’s back-to-back gap up sessions.
Volumes were +8.45% above average last week compared to the year prior (56,881,446 vs. 52,450,027), like SPY most of which occurred on Thursday & Friday, although the risk off Wednesday session also saw volumes that were notably higher than Monday & Tuesday.
Monday set the stage for the declines into midweek, opening above Friday’s candle’s body, but declining to about Friday’s open, resulting in a hanging man candle, signaling further declines on the horizon.
Tuesday’s spinning top candle indicated that there was uncertainty, but the movement was to the downside, setting up Wednesday’s hammer candle, where the price temporarily broke below the 10 day moving average’s support, but ultimately closed higher than it opened, despite the open being a gap down.
This set the stage for the two following days’ gap up sessions, as price action was primarily focused higher & there was a good deal of volume.
All eyes this week will be on how the $412.92/share support level holds up, as well as how the gaps of last week hold up as well, which will receive some aid from the 10 DMA’s support.
Much like SPY, QQQ has also been signaling that a bearish head & shoulders pattern may be emerging in the medium-term, with Friday’s session currently primed to be the head & the left shoulder being the $412.92/share support level that occurred about one month ago (12/28/2023).
The 50 day moving average’s support would also aid in this, as it currently is creating a support zone in the $395-396 price level.
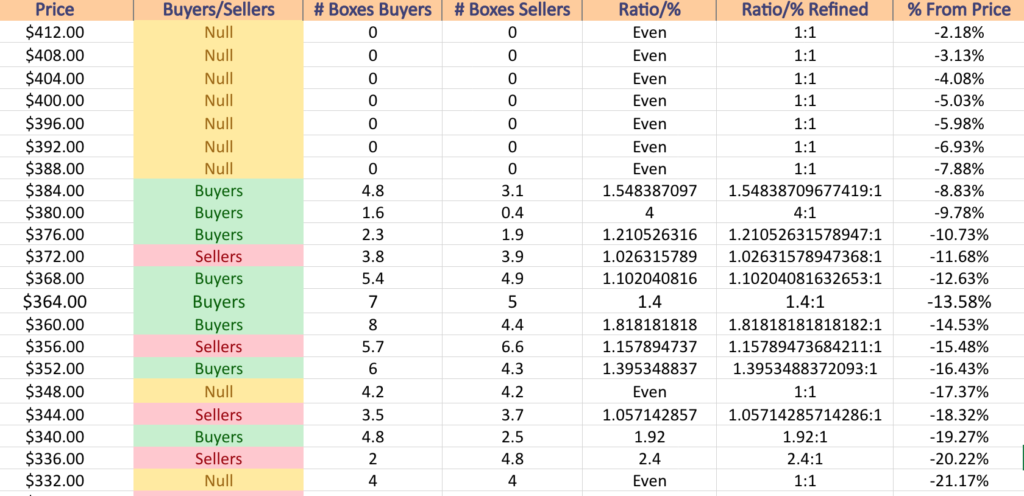
Should it test lower though, all eyes will be on whether or not a consolidation range is established in the $386.44-341.49/share level, like the one that QQQ traded in from June of 2023 until a mid-November gap up session that led to the most recent run up.
Due to QQQ being at an all-time high, there is too little data to assess the historic strength & weakness of buyers:sellers at their current support levels.
Their Average True Range is advancing higher, signaling that there has been a recent increase in volatility, which is expected to continue moving into this week.
QQQ has support at the $412.92 (Volume Sentiment: NULL, 0:0*), $408.58 (10 Day Moving Average; Volume Sentiment: NULL, 0:0*), $396.04 (50 Day Moving Average; Volume Sentiment: NULL, 0:0*) & $395.34/share (Volume Sentiment: NULL, 0:0*) price levels, with no resistance levels for the past year after reaching a new 52-week high on Friday.
IWM, the iShares Russell 2000 ETF lost -0.41% this past week, as investors shunned the small cap stocks in favor of larger names.
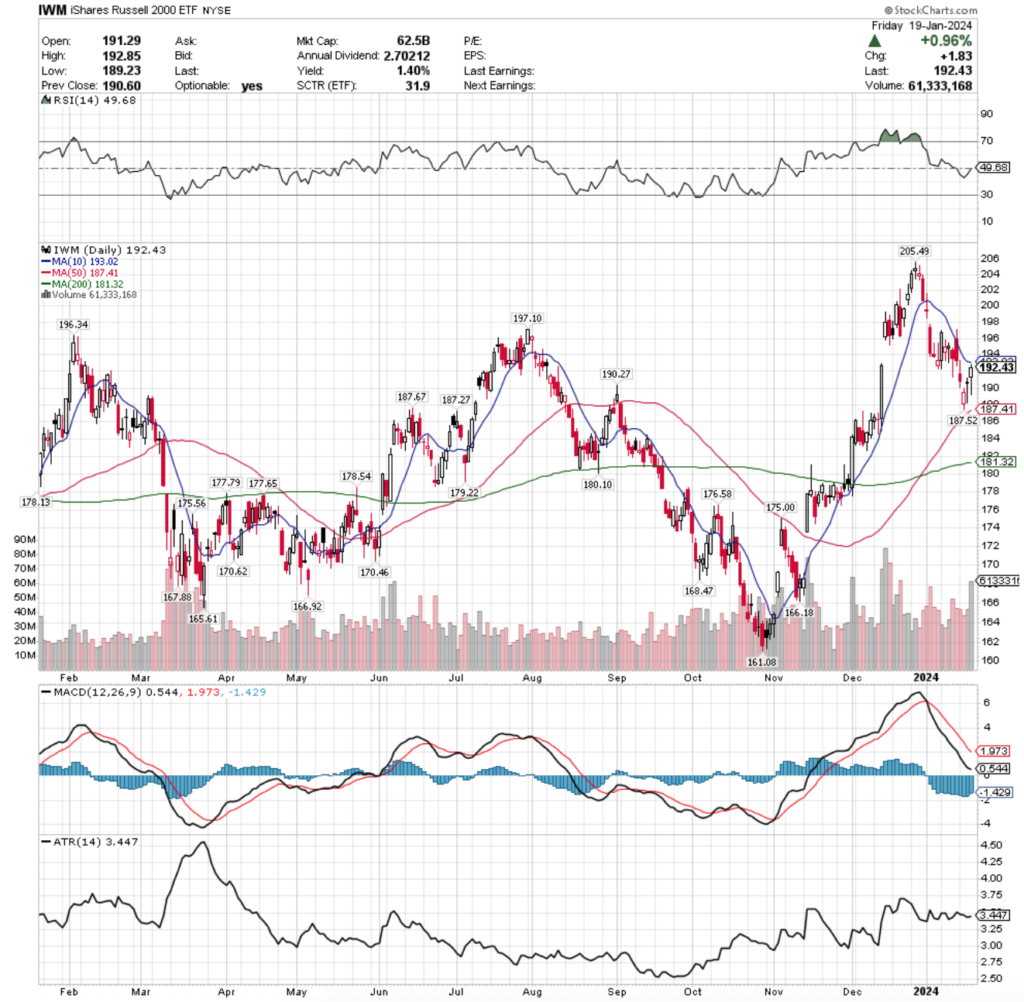
Their RSI is trending back to neutral & currently sits at 49.68, while their MACD is bearish still in the wake of the declines that they suffered since mid-December 2023.
Volumes were +38.71% above average last week compared to the year prior (45,336,017 vs. 32,683,625), driven primarily from Friday’s squeeze rally & some early week declining sessions, which is not an indicator of strength.
Monday’s session kicked off the bearish week opening at the 10 day moving average, testing higher, but ultimately diving beneath the support of the 10 DMA & testing lower on the second strongest volume of the week.
The weakness continued Tuesday, as the session gapped down, tried to recover, but could not even make it up to the 10 DMA’s resistance & continued its bearish descent, with the lower shadow signaling that there was appetite for IWM to move even lower.
Wednesday it gapped down again, almost testing the 50 day moving average’s support level, but pushed higher & wound up closing higher than it opened, but still nowhere near the day prior’s close.
Thursday opened on a gap up in the wake of Wednesday’s price recovery & movement higher & despite testing much lower (almost down to Wednesday’s opening price) resulted in a dragonfly doji, which led to Friday’s gap up.
While there was heavy volume on Friday & average volume Thursday, the 10 day moving average’s resistance will be a key area to watch this week, particularly as the lower shadows on the past two bullish day’s candles show that there was still a great deal of bearish sentiment at these price levels.
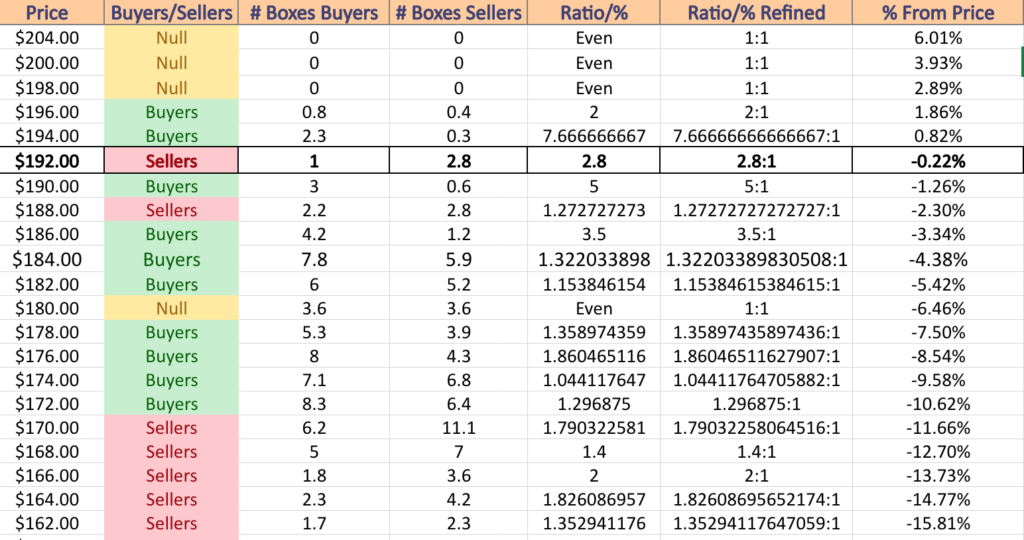
There have been a number of consolidation ranges in the past year that may act as support zones should IWM continue its slide downward, but it will be interesting to see how historic volume sentiments hold up for this name, as IWM has many gaps on their chart, leading to skewed data.
Their Average True Range is at the midway level & flat, indicating that there is some volatility.
The price’s interactions with the constricting 10 DMA (resistance applying downward pressure) & 50 DMAs (support applying upward pressure) will prove important in the coming week, as it will dictate which way IWM moves in the near-term.
IWM has support at the $190.27 (Volume Sentiment: Buyers, 5:1), $187.67 (Volume Sentiment: Buyers, 3.5:1), $187.52 (Volume Sentiment: Buyers, 3.5:1) & $187.41/share (50 Day Moving Average; Volume Sentiment: Buyers, 3.5:1) price levels, with resistance at the $193.02 (10 Day Moving Average; Volume Sentiment: Sellers, 2.8:1), $196.34 (Volume Sentiment: Buyers, 2:1), $197.10 (Volume Sentiment: Buyers, 2:1) & $205.49/share (52-Week High; Volume Sentiment: NULL, 0:0*) price levels.
DIA, the SPDR Dow Jones Industrial Average ETF inched forward +0.72% this past week, as investor sentiment for the large cap components of the index seem to have halted after a months-long run up in price.
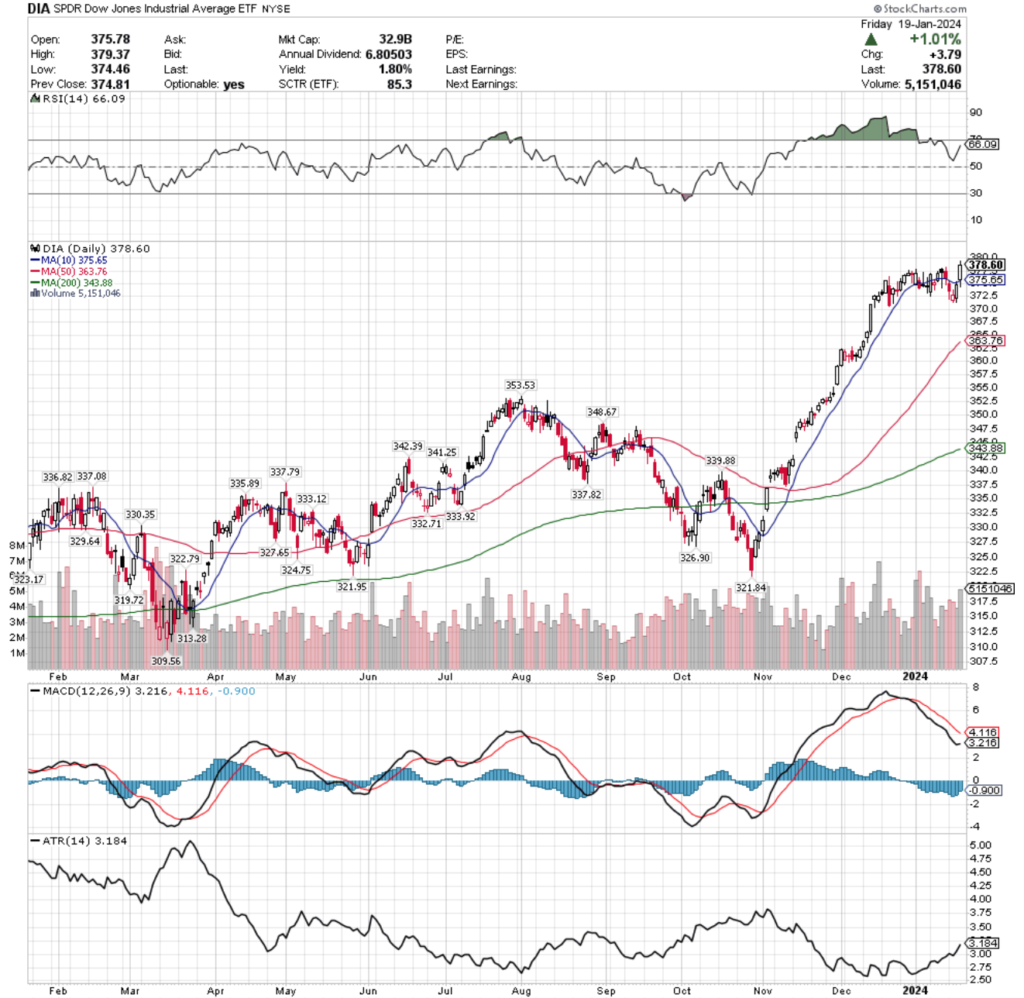
Their RSI is trending towards overbought & currently is at 66.09, while their MACD line is currently bearish, but moving closer to the signal line for a potential crossover.
Volumes were +27.69% above average this past week compared to the year prior (4,476,521 vs. 3,505,776), which like IWM, were mostly on account of Friday’s squeeze session & some selling pressure early on in the week.
Monday opened just below Friday’s close, tested much lower, but retreated back to the support of the 10 day moving average in time for the close.
Tuesday followed in the bearish sentiment, not being able to break the 10 DMAs resistance & trudged lower, with the candle’s lower shadow indicating more moves to the downside were coming.
Wednesday’s inverse hammer candle signaled that there would be near-term moves higher, particularly after it opened on a gap down, tested higher & closed above the open.
Thursday was a wide range session that was unable to beat the strength of the seller sentiment at the 10 DMAs resistance level, but Friday gapped up to open above it, briefly tested below it, before charging onwards higher to reach the new 52-week high.
Much like SPY & QQQ, DIA forming a bearish head & shoulders has also been a topic of discussion in previous articles & we will be watching to see if the head was established during Friday’s session.
Another area to watch will be the 10 DMA’s ability to remain a support level after last week’s falling apart, and once it does break down how the downwards pressure moves DIA in the coming weeks.
Should the downward pressure be applied & the 10 DMA be broken downward, the 50 DMA will become a critical support level, as it is the only support between the current price & the next support level which is a -6.6% decline from the current price.
Their Average True Range is moving higher, indicating that volatility is picking up after a month & a half of relative calm trading for DIA.
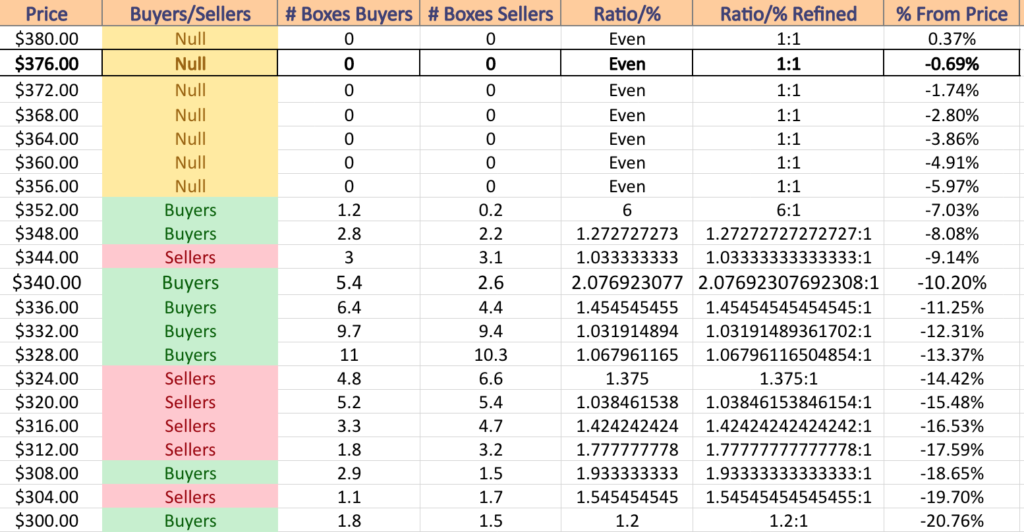
DIA has support at the $375.65 (10 Day Moving Average; Volume Sentiment: NULL, 0:0*), $363.76 (50 Day Moving Average; Volume Sentiment: NULL, 0:0*), $353.53 (Volume Sentiment: Buyers, 6:1) & $348.67/share (Volume Sentiment: Buyers, 1.27:1) price levels, with no resistance levels in the past year after reaching a new 52-week high on Friday.
The Week Ahead
The week ahead will be relatively quiet in terms of economic reports & data, but promises to be busy on the earnings report front.
Both Monday & Tuesday there are no major economic reports scheduled.
Agilysys, AGNC Investment, Brown & Brown, Independent Bank Group, TFI International (TFII), United Airlines & Zions Bancorp are all scheduled to report earnings on Monday.
On Tuesday Netflix, 3M, Baker Hughes, Canadian National Railway, D.R. Horton, General Electric, Halliburton, Intuitive Surgical, Invesco, Johnson & Johnson, Lockheed Martin, Old National Bancorp, PACCAR, Procter & Gamble, RTX, Synchrony Financial, Steel Dynamics, Stride, Teck Resources, Texas Instruments, Trustmark, Veritex Holdings, Verizon Communications & WesBanco all report earnings.
Wednesday brings us S&P Flash Services PMI & S&P Flash U.S. Manufacturing PMI data at 9:45 am.
Tesla, Abbott Labs, Agnico-Eagle Mines, Alamos, Ameriprise Financial, Amphenol, ASML, AT&T, Canadian Pacific, Cohen & Steers, Columbia Banking, Crown Castle, CSX, Elevance Health, Ethan Allen, Freeport-McMoRan, General Dynamics, International Business Machines, Kimberly-Clark, Knight-Swift, Lam Research, Monro Muffler, Packaging Corp, Plexus, Raymond James, ResMed, Sallie Mae, SAP, Seagate Technology, ServiceNow, SL Green Realty, TE Connectivity, Teledyne Tech, Textron, United Rentals, W.R. Berkley & West Fraser all are scheduled to report earnings data on Wednesday.
Q4 GDP (prelim), Initial Jobless Claims, Durable-Goods Orders, Durable-Goods Minus Transportaton, Advanced U.S. Trade Balance In Goods, Advanced Retail Inventories & Advanced Wholesale Inventories data will all be announced on Thursday at 8:30 am.
Thursday’s earnings reports include Intel, Alaska Air, American Airlines, Arthur J. Gallagher, Blackstone, Capital One, CNX Resources, Comcast, Cullen/Frost, Dow, Eagle Materials, Fair Isaac, Federated Hermes, KLA Corp, L3Harris, Marsh & McLennan, McCormick, Mobileye Global, Murphy Oil, NextEra Energy, NextEra Energy Partners, Northrop Grumman, Olin, Precision Drilling, RPC, Sherwin-Williams, STMicroelectronics, T-Mobile US, Union Pacific, Valero Energy, Virtu Financial, Visa, Western Alliance Bancorp, Western Digital, Weyerhaeuser & Xcel Energy.
All eyes will be on the American consumer to wind the week down on Friday, with Personal Income, Personal Spending, PCE Index, Core PCE Index, PCE (Year-over-Year) & Core PCE (Year-over-Year) all being reported at 8:30 am.
American Express, Autoliv, Badger Meter, Booz Allen Hamilton, Colgate-Palmolive, First Hawaiian, Fortis, Gentex, Imperial Oil, Norfolk Southern, Southside Banc & Stellar Bank wind the week down on the earnings report front on Friday.
See you back here next week!
*** I DO NOT OWN SHARES OR OPTIONS CONTRACT POSITIONS IN SPY, QQQ, IWM OR DIA AT THE TIME OF PUBLISHING THIS ARTICLE ***