SPY, the SPDR S&P 500 ETF gained +1.39% last week, mostly attributed to a gap up session on Wednesday, as the 10 day moving average continued to show strong support (last week’s note discussed this here).
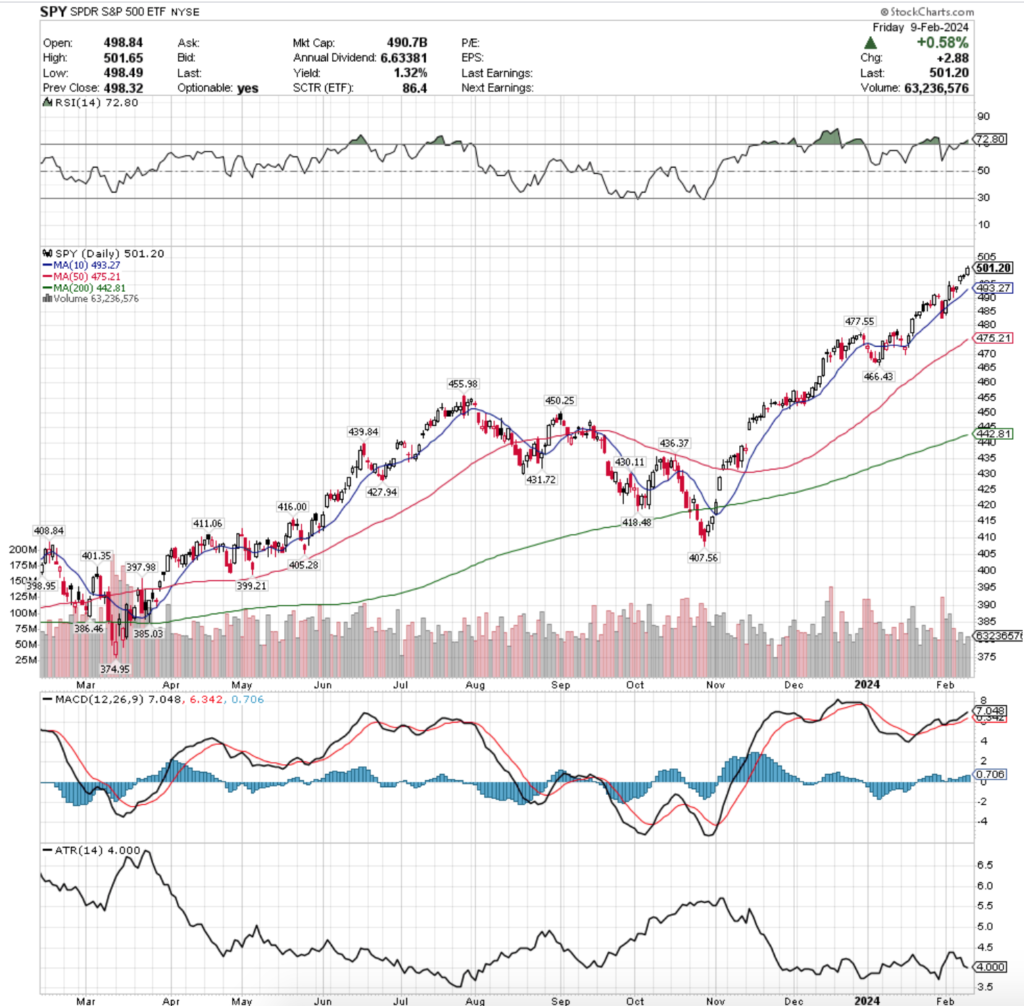
Their RSI has trended into overbought territory following the midweek gap up & currently sits at 72.8, while their MACD is currently still bullish.
Volumes were -22.21% below average last week compared to the year prior (63,559,973 vs. 81,704,876), as market participants have become anxious as the S&P 500 sits at all-time highs.
SPY kicked the week off on Monday with a declining session on the heaviest volume of the week,a and despite testing lower than they opened, the 10 day moving average was able to hold up as support & the candle’s real body set the stage for the advances of the rest of the week.
Tuesday showed some hesitancy, but ultimately marched slightly higher on low volume, with the candle’s real body concentrated on the upper end of the candlestick, signaling that there was still a muted appetite for higher prices.
SPY gapped up on Wednesday, for the second highest volume session of the week & continued to be supported by the 10 day moving average, but Thursday’s spinning top candle began to show that uncertainty had begun creeping into investors’ minds.
Friday closed the week out on a +0.58% advancing session, however much like the rest of the week, volumes were low & the session’s upper shadow is taller than the lower shadow, signaling that market participants are beginning to lose steam & pump the brakes.
Their Average True Range has cooled off in February, as there has not been much volatility, but it is beginning to flatten out, which may indicate that there is some volatility on the horizon in the near-term.
Much like last week, all eyes this week will be on the strength of the support from the 10 DMA, as well as the high of Friday’s session as it marks the new all-time high.
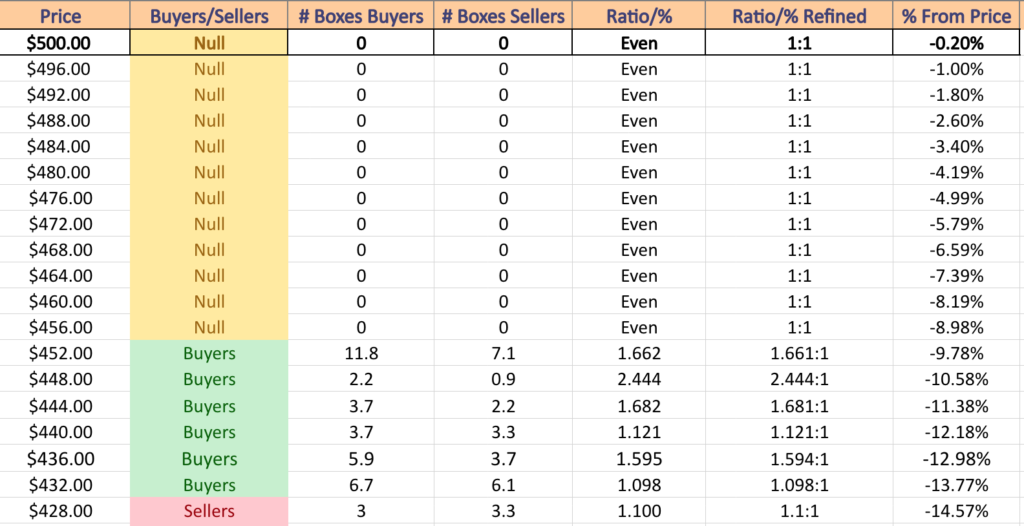
SPY has support at the $493.24 (10 Day Moving Average; Volume Sentiment: NULL, 0:0*), $477.55 (Volume Sentiment: NULL, 0:0*), $475.20 (50 Day Moving Average; Volume Sentiment: NULL, 0:0*) & $466.43/share (Volume Sentiment: NULL, 0:0*) price levels, with no current resistance levels as they are at all-time highs.
QQQ, the Invesco QQQ Trust ETF climbed +1.87% last week, as Wednesday’s session spurred strength that would last into the end of Friday’s session.
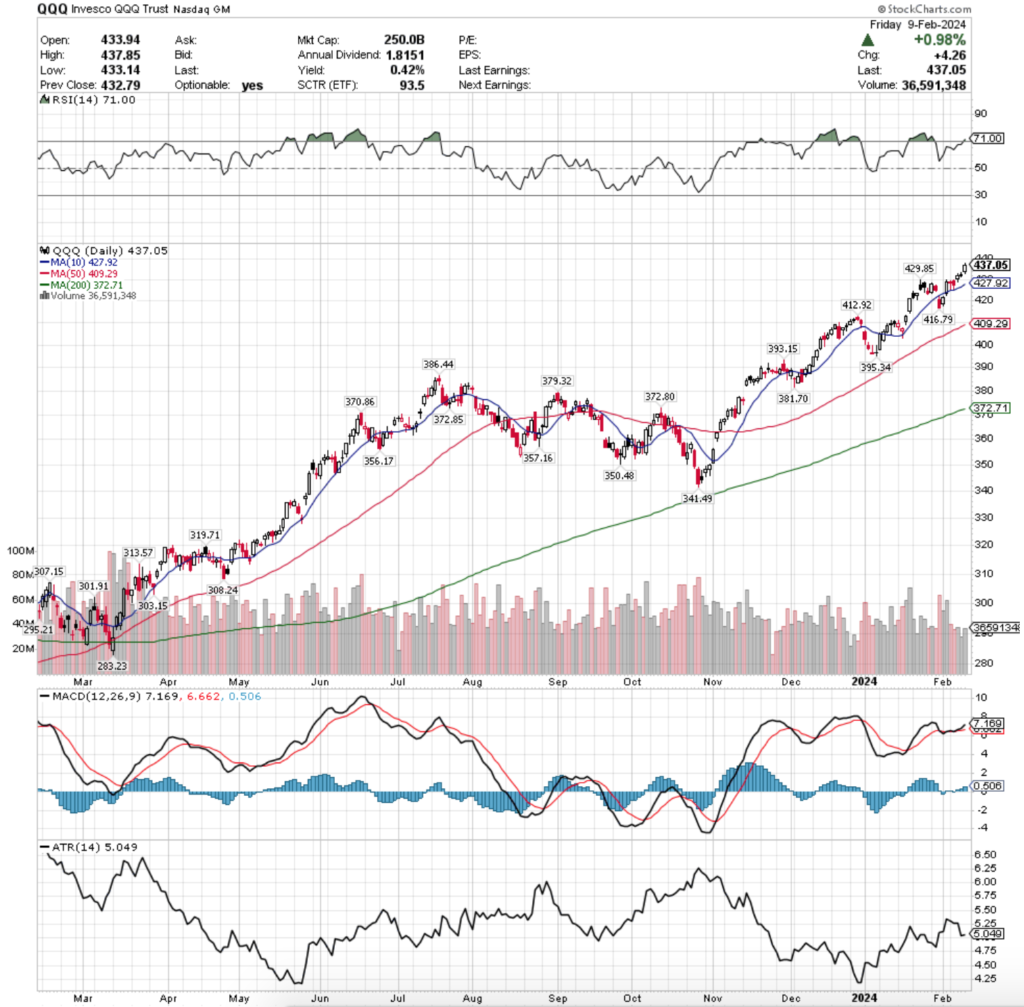
Their RSI is overbought at 71, and their MACD is still bullish following the week’s advances.
Volumes were -30.27% below average compared to the year prior (35,983,751 vs. 51,606,828), which gives cause for concern as the highest volume session of last week was Monday’s decline.
Monday kicked the week off in line with where Friday left off, with the support of the 10 day moving average being tested, but the close was ultimately just below Friday’s close, resulting in a dragonfly doji, which set the stage for the moves higher later in the week.
Tuesday followed in the same range as the prior two sessions, with the 10 DMA’s support held up before a gap up open on Wednesday kick started the rally into the end of the week, but the spinning top candle implies that there is a bit of uncertainty still as we sit near all-time highs.
Thursday continued the theme of uncertainty, with a doji candle whose real body was concentrated near the lower end of the candlestick on the weakest volume session of the day.
It is also of note that the sentiment was ultimately bearish on Thursday, as the day opened higher than Wednesday, but closed below where it opened, signaling that there was some profit taking taking place.
Friday saw investors eager to take risk into the weekend with a gap up session that resulted in +0.98% on the day, with volume similar to Wednesday’s level.
QQQ’s Average True Range has flattened out after the small range sessions of the past week, signaling that volatility has quieted down recently, which will be something to watch for when it begins to climb again & the markets see an increase in v0latility.
Another area to watch again this week is how strong the 10 DMA holds up as support, as well as if there are any new all-time highs hit, which seems probable given that investors are anticipating NVDA’s earnings call a week from Wednesday.
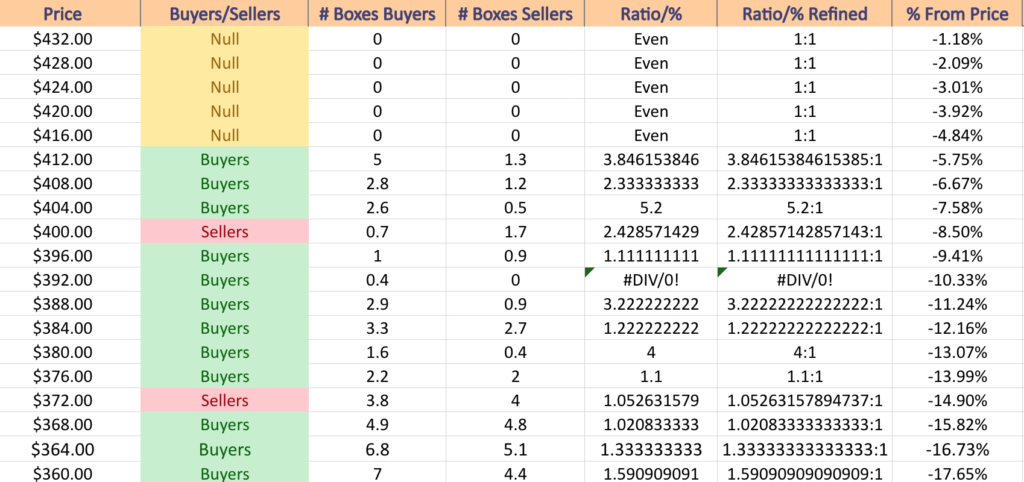
QQQ has support at the $429.85 (Volume Sentiment: NULL, 0:0*), $427.92 (10 Day Moving Average; Volume Sentiment: NULL, 0:0*), $416.79 (Volume Sentiment: NULL, 0:0*) & $412.92/share (Volume Sentiment: Buyers, 3.85:1) price levels, with no current resistance levels as they are at all-time highs.
IWM, the iShares Russell 2000 ETF advanced +2.54% last week, the most of the major indexes as investors favored the small-cap names over large.
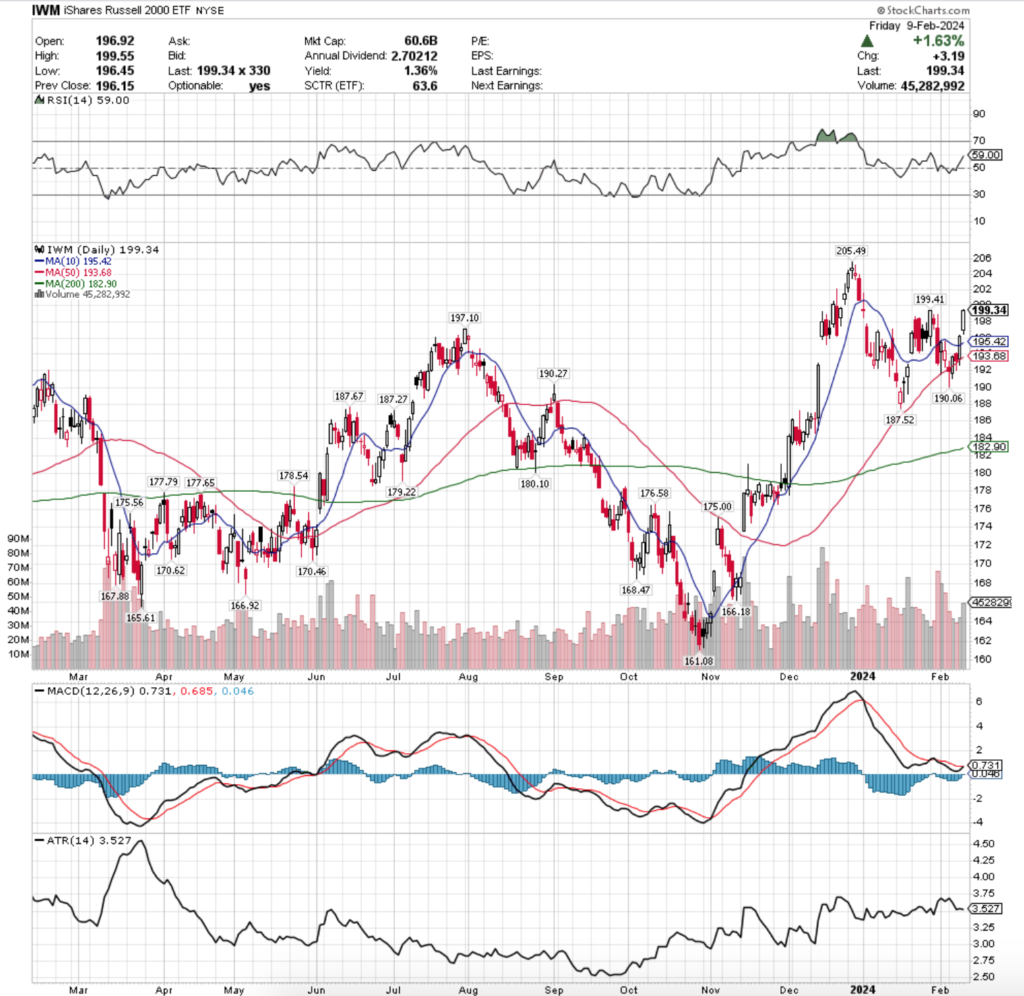
Their RSI is trending higher but currently sits at 59, while their MACD has just completed a bullish crossover following today’s gap up session.
Volumes were +10.46% above average last week compared to the year prior (37,361,510 vs. 33,824,176), primarily driven by Monday’s declining session & Friday’s advance into the weekend.
Monday tested the support of the 50 day moving average, breaking lower but settling around the level on a spinning top, signaling uncertainty, but with the highest volume of the week it showed that there was some eagerness to both take profits from late last week & to also hop into the pool.
Tuesday opened below the 50 DMA, but was able to climb above its resistance throughout the day & close higher, but the low volumes of the session did not inspire much confidence in the strength of the move.
Wednesday saw IWM open higher on a gap, test lower all the way to below the 50 DMA, but recover during the day’s session to end on a decline, but with the 50 DMA acting as support.
On Thursday IWM opened above the 50 DMA, tested below it briefly before roaring back & advancing on the day to close above the resistance of the 10 day moving average.
IWM gapped higher on Friday, leaving both the 10 & 50 DMA’s in its wake, on the second highest volume of the week, signaling an increased appetite for risk heading into the weekend.
Their Average True Range has flattened out & currently sits in the middle of its range, indicating that there has been an average amount of volatility for IWM recently.
In the coming week it will be interesting to keep an eye on how volumes fluctuate in relation to this past week’s movements, as well as how strong the support/resistance levels of the 10 & 50 day moving averages hold up.
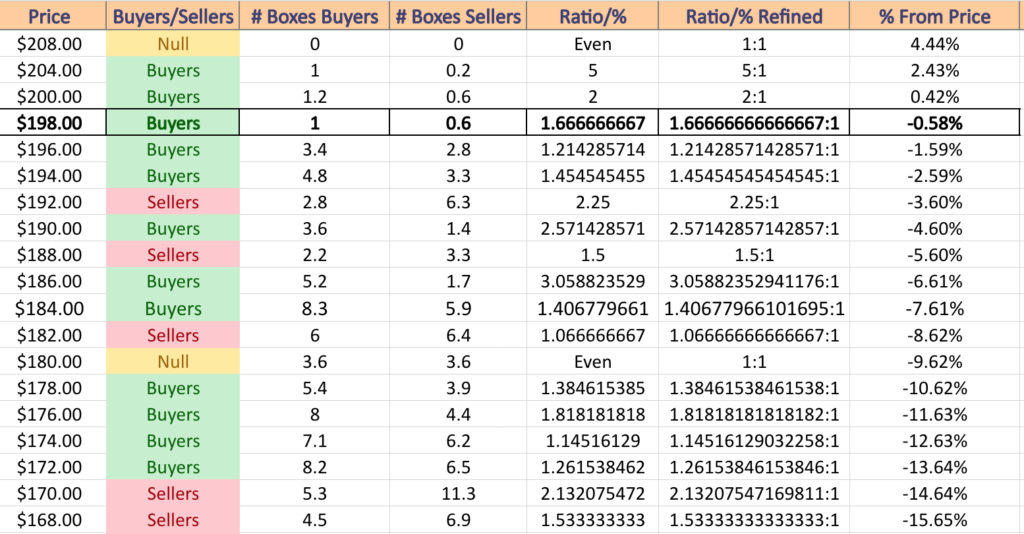
IWM has support at the $197.10 (Volume Sentiment: Buyers, 1.21:1), $195.40 (10 Day Moving Average; Volume Sentiment: Buyers, 1.46:1), $193.67 (50 Day Moving Average; Volume Sentiment: Sellers, 2.25:1) & $190.27/share (Volume Sentiment: Buyers, 2.57:1) price levels, with resistance at the $199.41 (Volume Sentiment: Buyers, 1.67:1) & $205.49/share (Volume Sentiment: Buyers, 5:1) price levels.
DIA, the SPDR Dow Jones Industrial Average ETF stumbled forward +0.08% this past week, faring the worst of the major indexes, as it looks that investors have run out of appetite for the larger cap names.
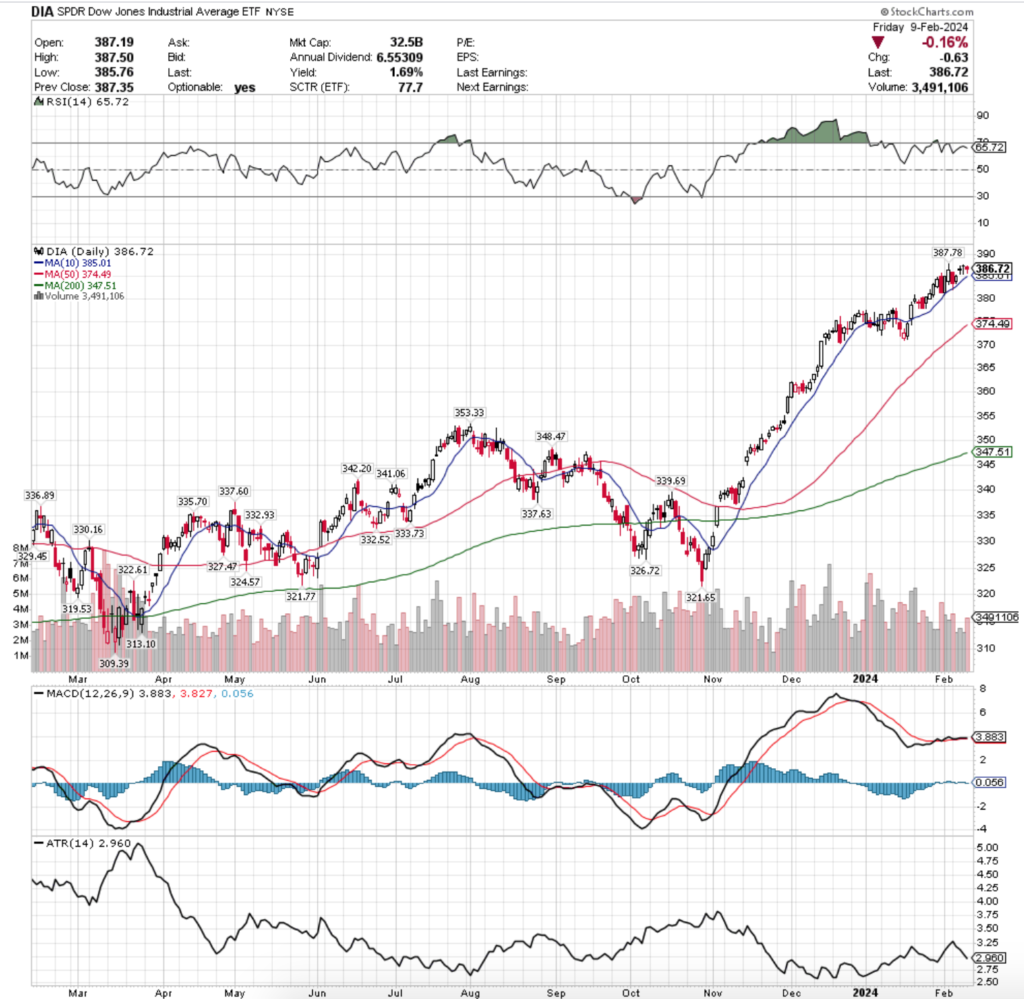
Their RSI is trending towards neutral following the recent price consolidation & currently sits at 65.72, while their MACD is currently bullish, but laying relatively flat, which is not an indicator of strength.
Volumes were -12.92% below average last week compared to the year prior (3,026,681 vs. 3,475,833), as enthusiasm was put on hold near these all-time high levels, and it should be noted that Monday & Friday had the highest volumes of the week by a significant amount, which shows bearishness is beginning to creep into one of the most consistent indexes.
Monday started off with declining session that tested the 10 day moving average, with Tuesday advancing from Monday’s close & forming a bullish harami pattern that set the stage for Wednesday’s gap up session.
Wednesday & Thursday were both doji candle’s indicating indecision, although Thursday’s was a dragonfly doji which can often lead to more advances following it.
However, the mood became risk off on Friday, but the day resulted in a spinning top candle, indicating that there is still a great deal of uncertainty around DIA’s near-term prospects.
Their ATR has begun to fall indicating that there has been a lack of volatility & that most days have had small ranges in the past couple of weeks, and it will be important to keep an eye out to see if there are any upticks in volatility in the coming weeks, as that will spur greater profit taking following the recent ascent of the past 3-4 months.
The 10 day moving average will also be something to watch, as should its support be broken the next true support level will become the 50 DMA, which is still advancing towards the price.
There may not be much sturdy footing for DIA in the event of a decline, which would make sense should market participants want to begin taking profits from the past 3-4 months.
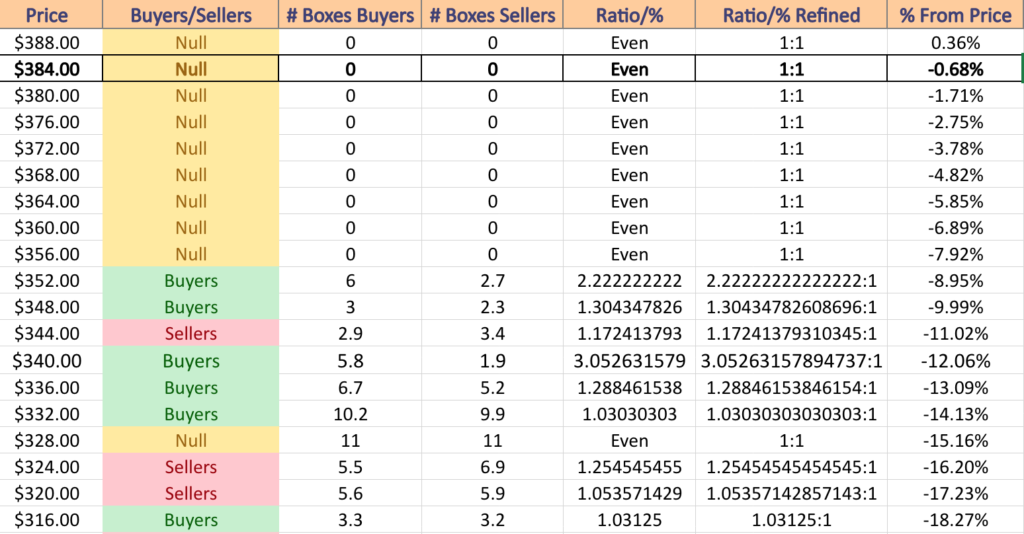
DIA has support at the $384.98 (10 Day Moving Average; Volume Sentiment: NULL, 0:0*), $374.48 (50-Day Moving Average; Volume Sentiment: NULL, 0:0*), $353.33 (Volume Sentiment: Buyers, 2.22:1) & $348.47/share (Volume Sentiment: Buyers, 1.3:1) price levels, with resistance at the $387.78/share (52-Week High; Volume Sentiment: NULL, 0:0*) price level.
The Week Ahead
Monday kicks the week off with the Monthly US Federal Budget at 2 pm.
Arista Networks, Avis Budget, Blackbaud, Brighthouse Financial, Cadence Design Systems, Federal Realty, Goodyear Tire, Hudson Pacific Properties, Lattice Semiconductor, Monday.com, Medpace, Otter Tail Power, Principal Financial Group, Service Co, Teradata, Trimble, Vornado Realty Trust, Waste Management, Watts Water Technologies & ZoomInfo are all scheduled to report earnings on Monday.
Consumer Price Index, Core CPI, CPI Year-over-Year & Core CPI Year-over-Year will all be reported on Tuesday at 8:30 am.
Tuesday’s earnings calls include Airbnb, Akamai Technologies, Alcon, American International Group, Angi, AutoNation, Biogen, Coca-Cola, Comstock, Corsair Gaming, Datadog, DaVita, Denny’s, Ecolab, Encore Wire, Entegris, EQT Corp., Franklin Electric, GlobalFoundries, GoDaddy, GXO Logistics, Hasbro, Hawaiian Electric, Herc Holdings, Howmet Aerospace, IAC Inc., Incyte, Instacart, Invitation Homes, Kratos Defense and Security, Krispy Kreme, Leidos, Lyft, Marriott, MGM Resorts, Molson Coors Brewing, Moody’s, Pan Am Silver, Primerica, Restaurant Brands International, Robinhood Markets, SiTime, STAG Industrial, Topgolf Callaway Brands, TPG Inc., TransUnion, Upstart, Watsco, Welltower, Wesco, WK Kellogg, Zillow & Zoetis.
Wednesday has no major economic data reports.
Cisco, Albemarle, Altice USA, American Water Works, Antero Midstream, Antero Resources, AppLovin, Arch Capital, Avient, Canadian Natural Resources, Cenovus Energy, Ceva, CF Industries, Charles River, Chefs’ Warehouse, Chemours, Chefs’ Warehouse, CME Group, CNH Industrial, Conduent, Energy Transfer, Equinix, Fastly, First Majestic Silver, Four Corners Property Trust, Franco-Nevada, Generac Holdings, Global Payments, Hecla Mining, Herbalife Nutrition, HubSpot, Informatica, IQVIA, JFrog, Kinross Gold, Kornit Digital, Kraft Heinz, Lithia Motors, Louisiana-Pacific, Magnolia Oil & Gas, Manitowoc, Manulife Financial, Martin Marietta Materials, NerdWallet, Nu Skin, Occidental Petroleum, Owens Corning, Paramount Group, Parsons, Patterson-UTI, QuantumScape, Royal Gold, Ryder System, SAGE Therapeutics, Suncor Energy, Sunoco, Taylor Morrison Home, Tower Semiconductor, TripAdvisor, Twilio, Upwork, Veeco Instruments, Waste Connections, Williams Cos & Wyndham Hotels & Resorts are all scheduled to report earnings on Wednesday.
Thursday will be busy on the data front, starting at 8:30 am when we get Initial Jobless Claims, Empire State Manufacturing Survey data, Philadelphia Fed Manufacturing Survey data, Import Price Index, Import Price Index Minus Fuel, U.S. Retail Sales & Retail Sales minus Autos, followed by Industrial Production & Capacity Utilization data at 9:15 am & Home Builder Confidence Index data at 10 am.
Thursday’s earnings calls include Coinbase Global, DraftKings, Agnico-Eagle Mines, Applied Materials, Arch Coal, BJ Restaurants, Bloom Energy, CBRE Group, Cohu, Con Edison, Crocs, Deere, Digital Realty Trust, DoorDash, Dropbox, Genuine Parts, Globant, Hanesbrands, Hyatt Hotels, IdaCorp, Ingersoll-Rand, Insight Enterprises, InterDigital, Ironwood Pharma, Laboratory Corp, Lincoln Electric, LTC Properties, LXP Industrial Trust, Mercer International, Organon, PENN Entertainment, Reliance Steel, Roku, Sabre, Shake Shack, SharkNinja, ShockWave Medical, Southern, SunPower, Tanger Factory, Texas Roadhouse, The Trade Desk, Toast, TriNet Group, US Foods, Vontier, Walker & Dunlop, Wendy’s, West Fraser, Yelp, YETI Holdings & Zebra Technologies.
Housing Starts, Building Permits, Producer Price Index, Core PPI, PPI Year-over-Year & Core PPI Year-over-Year are released on Friday at 8:30 am, followed by Consumer Sentiment (prelim) at 10 am.
Friday’s earnings reports include American Axle, Barnes Group, Cinemark, DT Midstream, Healthcare Realty, Portland General Electric, PPL Corp, TC Energy, TreeHouse Foods & Vulcan Materials.
See you back here next week!
*** I DO NOT OWN SHARES OR OPTIONS CONTRACT POSITIONS IN SPY, QQQ, IWM OR DIA AT THE TIME OF PUBLISHING THIS ARTICLE ***