SPY, the SPDR S&P 500 ETF advanced +1.42% last week, faring the best of all of the major indexes for the week.
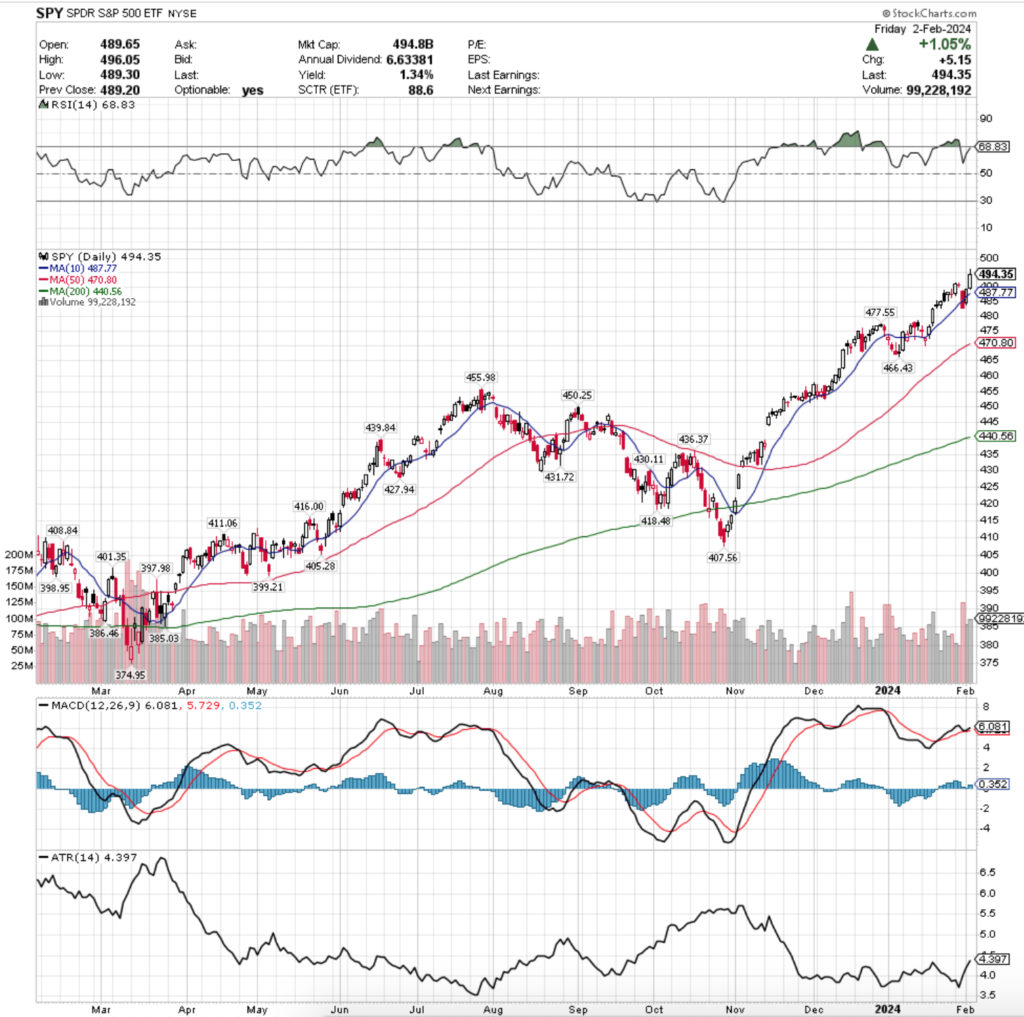
Their RSI is 68.83 (per Friday’s close) & approaching overbought conditions, while their MACD is still bullish, but lost some steam following last Tuesday & Wednesday’s sessions.
Volumes were +6.52% above average last week compared to the year prior (87,398,320 vs. 82,048,124), led by Wednesday’s gap down session that broke through the support of the 10 day moving average.
Friday’s session featured the second highest volumes of the week on a day with a +1.05% gain going into the weekend, but that isn’t convincing enough that a bullish sentiment has returned to markets.
Monday the week kicked off with an advancing session following the Friday before’s doji close signaling uncertainty heading into the weekend.
Tuesday’s session returned to the theme of uncertainty, with a doji candle marking the session that was contained near the top of Monday’s candle’s real body & upper shadow.
Wednesday featured a gap down that broke through the support of the 10 day moving average, indicating that investor sentiment is waning, particularly as it had the strongest volumes of the week, mostly due to Chairman Powell’s press conference following the interest rate decision.
Thursday opened higher & climbed back through the 10 DMA, closing the day slightly above the real body of Wednesday’s candle & leading to Friday’s advancing session heading into the weekend.
SPY’s Average True Range has been steadily climbing since the last week of January, signaling that volatility in the index is heating up.
Two areas to watch in the week ahead are the upper shadow on Friday’s candle, as it may be the head to the bearish head & shoulders pattern that we have written about over the past few weeks, but the markets have continued to defy, as well as the 10 DMA.
Should the support of the 10 day moving average give way, there is -3.4% from the current price to the next lowest level of support.
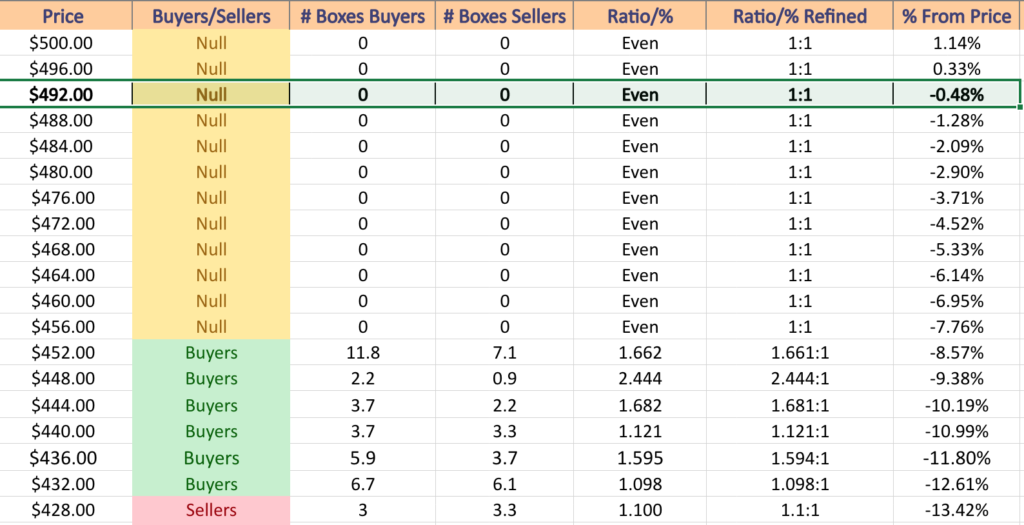
Given that we have been setting new 52-week & all-time highs recently, there is limited volume data for the price levels below that are within a 7.76% range of the Friday’s closing price.
However, as time passes & more trades take place in these price ranges there will be more meaningful data to replace the NULL values.
Also note that due to the recent setting of 52-week highs the higher levels with data will be skewed towards buyers until a consolidation has taken place, which may make them appear stronger than they actually are.
SPY has support at the $487.77 (10 Day Moving Average; Volume Sentiment: NULL, 0:0*), $477.55 (Volume Sentiment: NULL, 0:0*), $470.80 (50 Day Moving Average; Volume Sentiment: NULL, 0:0*) & $466.43/share (Volume Sentiment: NULL, 0:0*), with no resistance levels over the past year as they are at a new 52-week high.
QQQ, the Invesco QQQ Trust ETF added +1.23% over the past week, weathering through the losses of Wednesday & Thursday’s sessions.
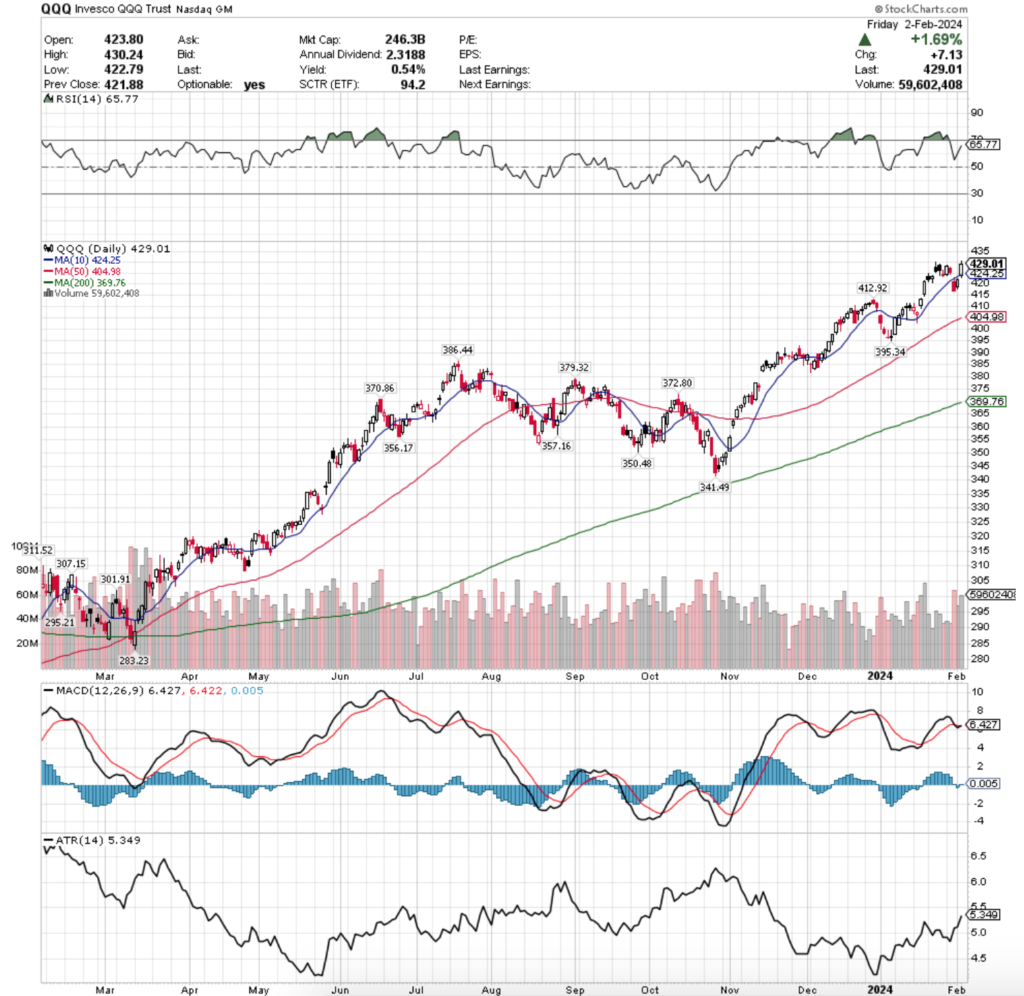
Their RSI is trending back towards overbought levels & currently sits at 65.77 after Friday’s close, while their MACD is hanging on bullishly but approaching the signal line for a bearish crossover.
Volumes were -3.94% below average last week compared to the year prior (50,007,040 vs. 52,056,892), looking similar to SPY’s in terms of Wednesday’s bearish session being the week’s heaviest volume, followed by Friday’s advancing session.
Monday kicked the week off on a bullish note, advancing following the Friday prior’s risk off into the weekend move.
Tuesday’s candles created a bearish harami pattern with Monday’s, which was confirmed by Wednesday’s declines on a gap down that broke the support of the 10 day moving average.
Thursday nudged higher, but was still contained by the resistance of the 10 DMA, which Friday’s session used as a support level on a gap up open, briefly tested below (lower shadow) & resulted in a +1.65% gain on the day.
Given that lack of volume & the way volumes were dispersed throughout the week Friday’s session does not look like a signal of strength, nor a green light for prices to begin going higher from here.
QQQ’s Average True Range has also been steadily climbing since late January, indicating that volatility has been increasing & will likely continue to do so in the coming weeks.
Much like SPY, the same two variables will be something to keep a close eye on.
If the support of the 10 DMA is able to hold up, there is increased likelihood of setting a new 52-week high & creating a new potential head in the bearish head & shoulders situation mentioned prior.
Else, Friday’s upper shadow will be the ultimate resistance line in the weeks that move forward.
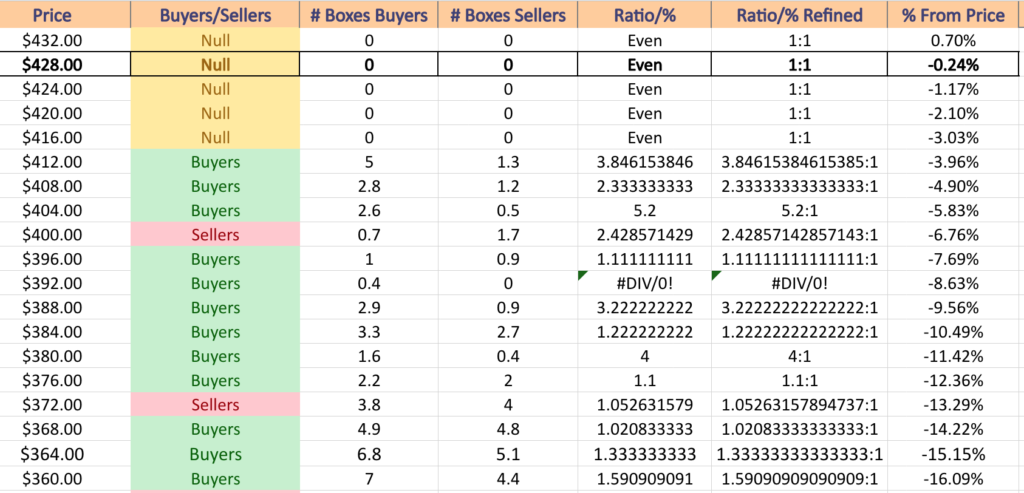
Like SPY, QQQ’s price levels near the 52-week high have limited data to work with, leaving the table below filled with NULL values until there is a 3% decline.
Recall that the data on the outskirts of highs/lows is often skewed & it will be interesting to see how the Sellers:Buyers data changes the table below in the event of consolidation.
QQQ has support at the $424.25 (10 Day Moving Average; Volume Sentiment: NULL, 0:0*), $412.92 (Volume Sentiment: Buyers, 3.85:1), $404.98 (50 Day Moving Average; Volume Sentiment: Buyers, 5.2:1) & $395.34/share (Volume Sentiment: Buyers, 0.4:0*), with no past year resistance levels as they are currently at a 52-week high.
IWM, the iShares Russell 2000 ETF declined -0.8%, as investors were less enthused with the small cap names than larger market cap stocks this past week.
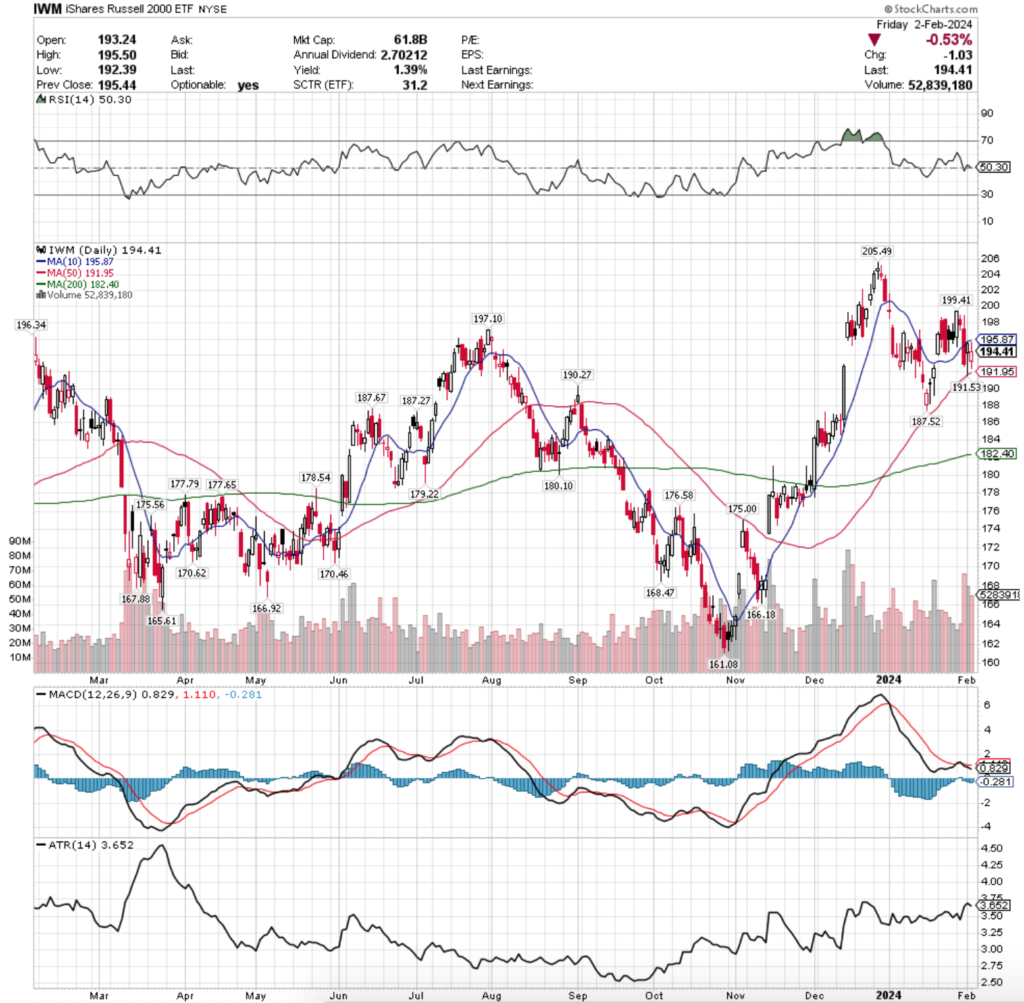
Their RSI is currently trending downwards, but remains neutral at 50.30, while their MACD is bearish & trending downwards.
Volumes were +44.66% above average last week compared to the year prior (48,557,260 vs. 33,565,873), led by Wednesday’s wide range bearish session, followed by Thursday’s advancing session that also tested down further but was supported by the 50 day moving average & Friday’s profit taking & risk off behavior moving into the weekend.
Monday kicked IWM’s week off on a bullish note, setting a new resistance level at $199.41, but Tuesday’s session resulted in a bearish harami pattern, setting the stage for the rest of the week’s declines.
The low volumes of Monday & Tuesday should be noted & taken as a sign of weakness.
Wednesday was a wide-range session downward, which led the week in volume & broke through the support of the 10 day moving average.
Thursday opened midway through Wednesday’s candle’s real body, tested below to the 50 day moving average which held up support, before rallying higher & closing just beneath the resistance of the 10 day moving average.
Friday wound the week down on an uncertain note, as the day’s candle opened lower than Thursday’s close, tested lower before rallying to test higher & closing above the open but with a large upper shadow.
This is showing that the direction of IWM will likely be determined by whether the resistance of the 10 day moving average or the support of the 50 day moving average gives out first.
Interestingly, their Average True Range has been declining after spiking up a bit in late-January, signaling a slowdown in volatility recently, and marking uncertainty as we get deeper into earnings season.
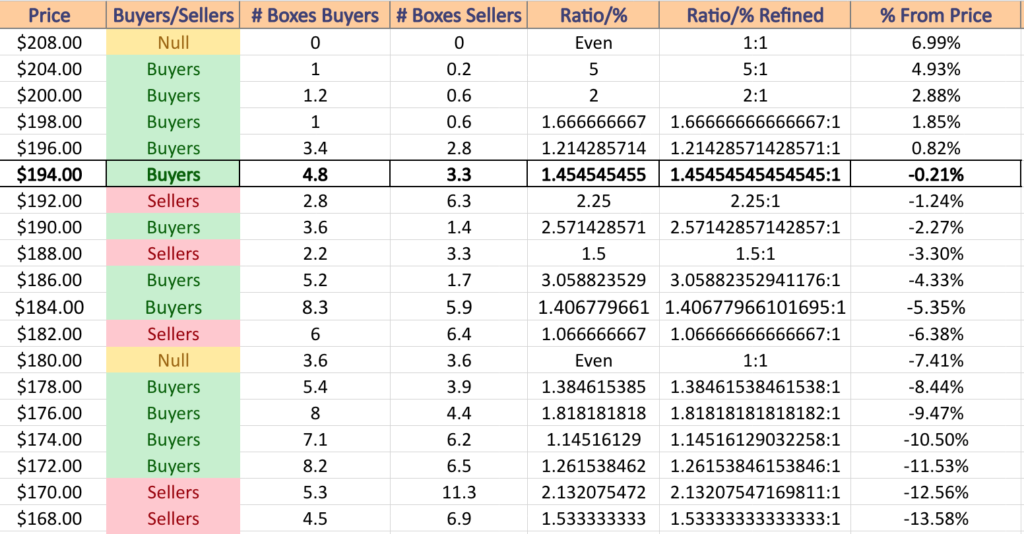
IWM has support at the $191.95 (50-Day Moving Average; Volume Sentiment: Buyers, 2.57:1), $191.53 (Volume Sentiment: Buyers, 2.57:1), $190.27 (Volume Sentiment: Buyers, 2.57:1) & $187.67/share (Volume Sentiment: Buyers, 3.06:1), with resistance at the $195.87 (10-Day Moving Average; Volume Sentiment: Buyers, 1.46:1), $196.34 (Volume Sentiment: Buyers, 1.21:1), $197.10 (Volume Sentiment: Buyers, 1.21:1) & $199.41/share (Volume Sentiment: Buyers, 1.67:1) price levels.
DIA, the SPDR Dow Jones Industrial Average ETF gained +1.4% over the past week, just shy of SPY showing investor appetite was favoring larger cap stocks last week, mostly on account of earnings reports.
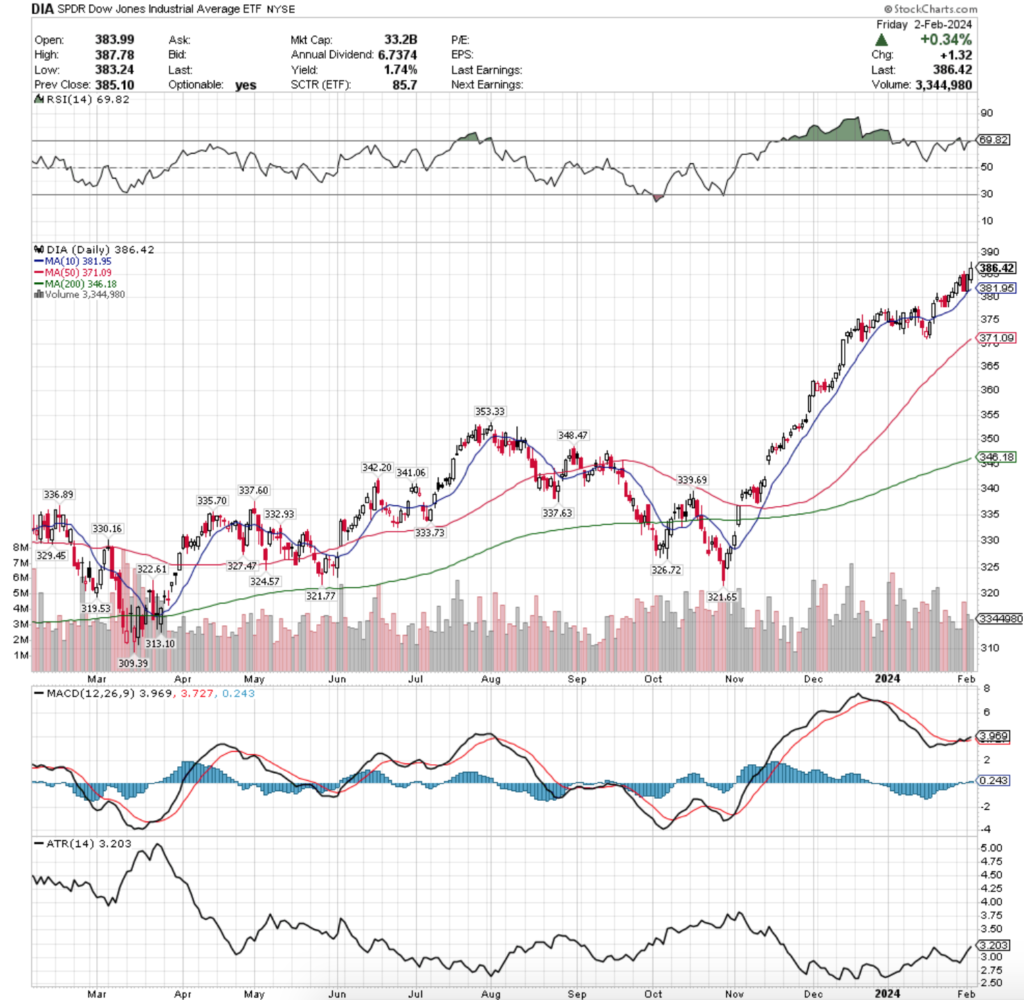
Their RSI is trending back towards overbought levels & is at 69.82 per Friday’s close, while their MACD is still slightly bullish, but not signaling strength.
Volumes were -3.04% below average last week compared to the year prior (3,390,540 vs. 3,496,925), as investors were not overly eager to jump into the pool near 52-week highs.
One thing to note though s that the support of DIA’s 10 day moving average held up, which shows that investors do feel more safe investing in the larger cap components of the Dow Jones Industrial Average than the other major indexes.
Monday’s session for DIA was a conservative advance, as was Tuesday’s.
Wednesday saw a declining session where the 10 day moving average held strong & kept the index afloat, while Thursday flashed signals of uncertainty with an advancing session whose real body was almost the exact same size as that of Wednesday’s candle.
Friday nudged higher 0.34%, leaving mixed signals about how market participants feel about the valuations of DIA’s components & their valuations relative to the interest rate decision that was announced on Wednesday.
As with SPY & QQQ, the 10 day moving average & how strong its support remains & the upper shadow on Friday’s session’s candle will be the main areas of focus in the coming weeks for clues into whether there will be a cool down & consolidation period, or if that resistance level becomes support for an irrational leg higher.
Since late January DIA’s Average True Range has been increasing, signaling that there is increased volatility following months of narrow-range candles in a steady ascent.
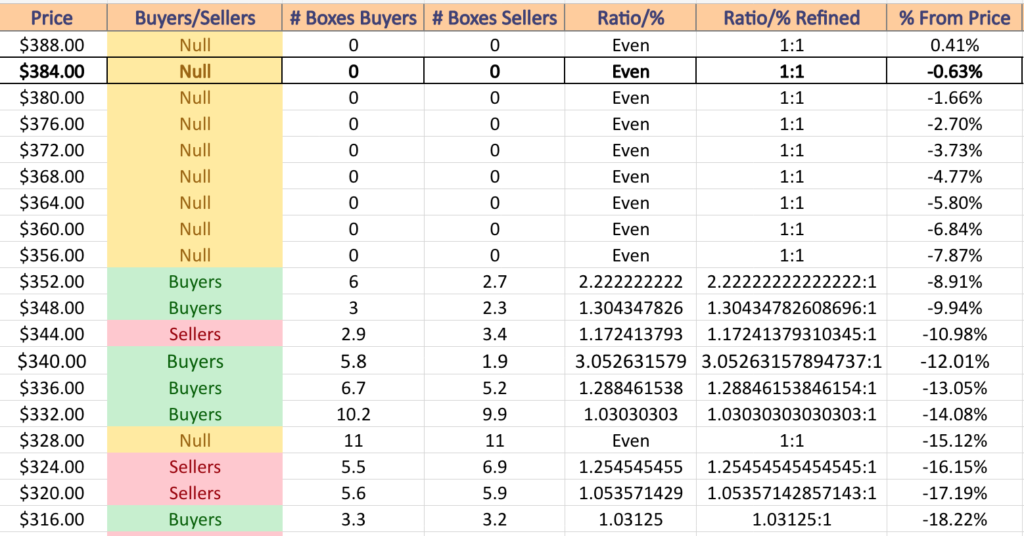
The same notes regarding 52-week highs on price levels from SPY & QQQ’s segments above also applies to the data below for DIA.
DIA has support at the $381.95 (10-Day Moving Average; Volume Sentiment: NULL, 0:0*), $371.09 (50-Day Moving Average; Volume Sentiment: NULL, 0:0*), $353.33 (Volume Sentiment: Buyers, 2.22:1) & $348.47/share (Volume Sentiment: Buyers, 1.34:1), with no one year resistance levels as they are at a 52-week high.
The Week Ahead
Monday the week kicks off with S&P Final U.S. Services PMI at 9:45 am, Chicago Fed President Austan Goolsbee has a TV appearance at 10 am, along with the ISM Services data report & at 2 pm Atlanta Fed President Raphael Bostic gives welcoming remarks.
McDonalds, Affiliated Managers, Air Products, Allegiant Travel, Amkor, BellRing Brands, Cabot, Caterpillar, Chegg, Coherent, Crown Holdings, Estee Lauder, Fabrinet, Golub Capital, Hillenbrand, IDEXX Labs, J&J Snack Foods, Kforce, Kilroy Realty, NXP Semiconductors, ON Semiconductor, Palantir Technologies, Rambus, Simon Property Group, Simpson Manufacturing, Skyline Champion, Tyson Foods, Varonis Systems & Vertex Pharmaceuticals are all scheduled to report earnings on Monday.
Cleveland Fed President Loretta Mester speaks at 12 pm on Tuesday, followed by Minneapolis Fed President Neel Kashkari speaking at 1pm, Boston Fed President Susan Collins speaking at 2pm & Philadelphia Fed President Patrick Harker speaking at 7pm.
Tuesday’s earnings reports include: Eli Lilly, Advanced Energy, AGCO Corp, AllianceBernstein, Amdocs, American Financial Group, Amgen, Aramark, Arrowhead Pharmaceuticals, Assurant, Atmos Energy, Autohome, Carlisle Companies, CAVA Group, Centene, Check Point Software Technologies, Chipotle Mexican Grill, Cincinnati Financial, Cirrus Logic, Cognizant Technology Solutions, Cummins, DHT, Diodes, Douglas Emmett, DuPont, e.l.f. Beauty, Edwards Lifesciences, Energizer, Enphase Energy, Equitable Holdings, Essex Property, Exelixis, FirstService, Fiserv, Ford Motor, Fortinet, Freshworks, Frontier Group Holdings, Gartner, GE HealthCare, Gilead Sciences, H & R Block, Hertz Global, Himax Technologies, Jacobs Engineering, Klaviyo, KKR, Kyndryl, Lear, Linde, Lumen Technologies, Madison Square Garden Entertainment, MSG Sports, MicroStrategy, Nabors Industries, O-I Glass, Omnicom, Pan Am Silver, Precision Drilling, Prudential, Rexford Industrial Realty, Sensata Technologies, Silicon Motion, Snap, Spirit Aerosystems, Spotify Technology, Sonos, Tradeweb Markets, UBS AG, Valvoline, V.F. Corp, Werner Enterprises, Western Union, Willis Towers Watson, Xylem & Yum China.
Wednesday begins with U.S. Trade Deficit data at 8:30 am, followed by Fed Governor Adriana Kugler speaking at 11am, Boston Fed President Susan Collins speaking at 11:30 am, Richmond Fed President Tom Barkin speaking at 12:30 pm, Fed Governor Michelle Bowman speaking at 2pm, Consumer Credit & CBO Briefing on Budget & Economic Outlook data at 3pm.
Walt Disney, Adient, Alibaba Group, Allstate, Ares Capital, Arm Holdings, ASGN, Axcelis Technologies, B2Gold, Black Hills Corp, Bunge, Cameco, Carlyle Group, Confluent, CoreCivic, Coty, CVS Health, Dayforce, Emerson Electric, Encompass Health, Enersys, Envista, Equifax, Everest Group, First American Financial, FleetCor, Fox Corp, Franco-Nevada, Globe Life, GoPro, Green Plains, Griffon, Hain Celestial, Hilton, Kennametal, Kinross Gold, Knowles, Kodiak Gas Services, Manulife Financial, MasterCraft, Mattel, McKesson, MKS Instruments, Molina Healthcare, Monolithic Power, Murphy USA, National Fuel Gas, NETGEAR, New York Times, News Corp., Omega Health, O’Reilly Automotive, Paycom Software, Paycor, PayPal Holdings, Penske Automotive Group, Performance Food Group, Radian Group, Radware, Reynolds Consumer Products, Roblox, Scotts Miracle-Gro, Silicon Labs, TechTarget, Thomson Reuters, TTM Technologies, Vishay Intertechnology, XPO & Yum! Brands will all report earnings on Wednesday.
Initial Jobless Claims data is released Thursday at 8:30 am, followed by Wholesale Inventories at 10 am & Richmond Fed President Tom Barkin Speaking at 12:05pm.
Thursday’s earnings calls feature Affirm, Apollo Global Management, ArcelorMittal, Ares Management, Arrow Electronics, Asbury Automotive, AstraZeneca, Axalta Coating Systems, Baxter, Bill.com, BorgWarner, Boyd Gaming, Canadian Natural Resources, Capri Holdings, Cenovus Energy, Colliers International Group, ConocoPhillips, CyberArk Software, Dexcom, Doximity, Duke Energy, Dynatrace, Expedia Group, First Majestic Silver, FirstEnergy, Flowers Foods, Fortis, Genpact, Gildan Activewear, Harley-Davidson, Hershey Foods, Illumina, Intercontinental Exchange, The Interpublic Group of Companies, ITT, Kellanova, Kenvue, Kimco Realty, Leggett & Platt, Lincoln National, Lions Gate Entertainment, Lumentum, Masco, Mettler-Toledo, Mohawk Industries, Motorola Solutions, NNN REIT, Omnicell, Paylocity, Philip Morris International, Pinterest, PROS Holdings, Ralph Lauren, RBC Bearings, S&P Global, Snap-On, SolarWinds, Spectrum Brands, Spirit Airlines, Synaptics, T. Rowe Price, Take-Two Interactive Software, Tempur Sealy International, Tenet Healthcare, Transdigm Group, Under Armour, VeriSign, Warner Music Group, WEX, Wheaton Precious Metals & Zimmer Biomet.
Friday winds the week down with CPI Seasonal Factor Revisions at 8:30 am & Dallas Fed President Lori Logan speaking at 1:30 pm.
Algonquin Power & Utilities, AMC Networks, Catalent, Enbridge, Essent Group, Magna International, Mr. Cooper Group, Newell Brands, PepsiCo, Plains All American, Restaurant Brands International, TELUS International & W.P. Carey are all scheduled to report earnings on Friday.
See you back here next week!
*** I DO NOT OWN SHARES OR OPTIONS CONTRACT POSITIONS IN SPY, QQQ, IWM OR DIA AT THE TIME OF PUBLISHING THIS ARTICLE ***