Last week’s big word for markets was inflation, with CPI prints & Fed speakers all echoing that more needs to be done to reach their target goals.
SPY, the SPDR S&P 500 ETF dropped -0.19% this past week, floating around the same $407-8 price level that has played critical support & resistance.
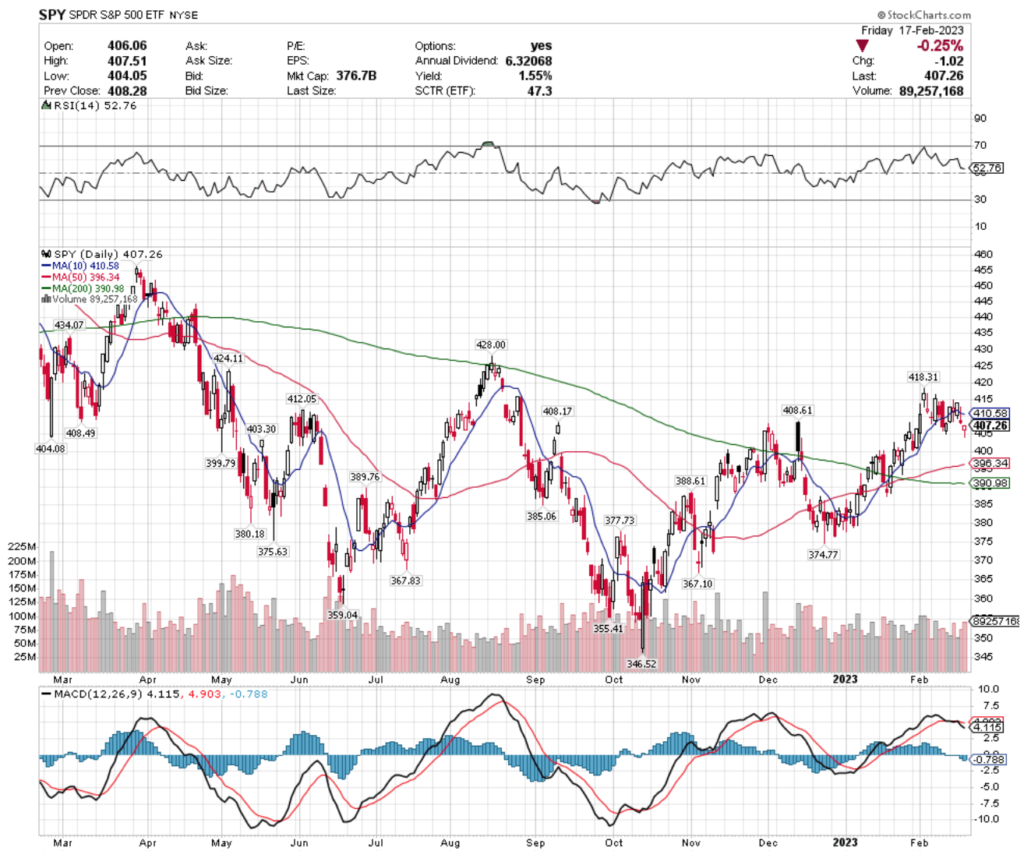
Their overhead resistance levels are $408.17, $406.49 & $408.61, with support at the $404.08, $403.30 & $399.79.
QQQ, the Invesco QQQ Trust ETF finished the week up +0.49%.
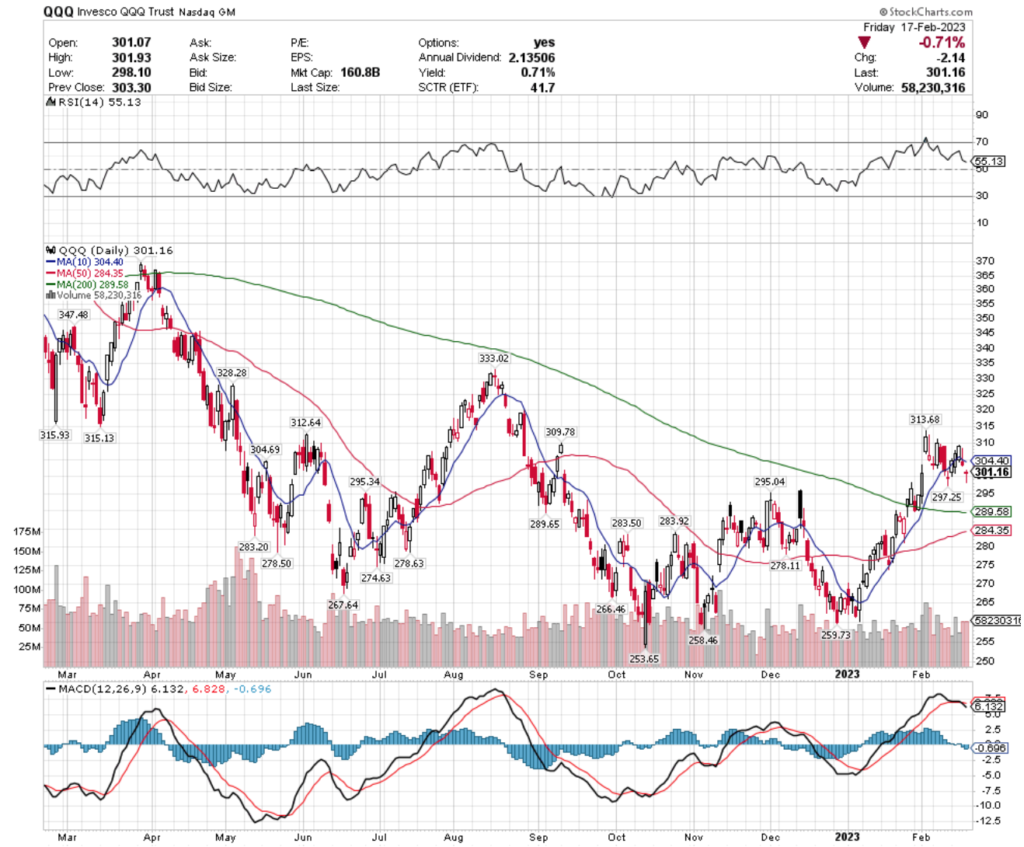
They have support at the $297.25, $295.34 & $295.04, as they look to try to break above their $304.40, $304.69 & $309.78 resistance levels.
IWM, the iShares Russell 2000 ETF finished the week +1.48%, with smaller cap stocks having the strongest week based on the major indexes.
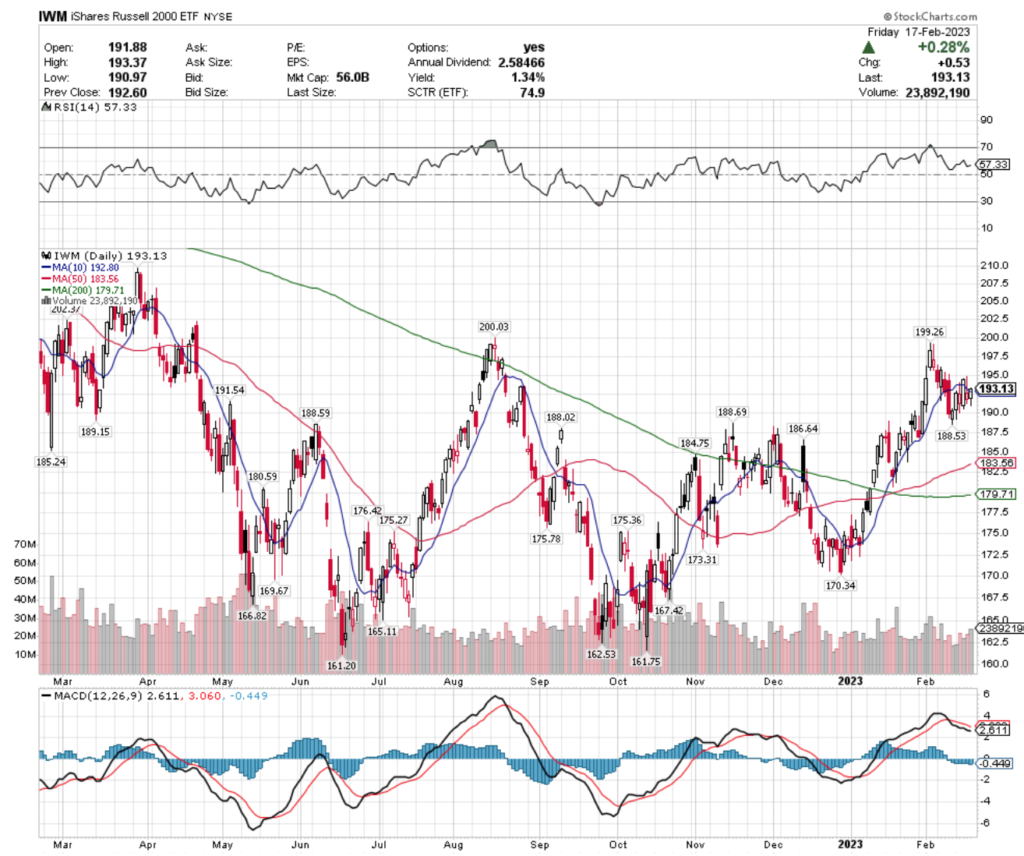
They enter this week with support at the $192.80. $191.54 & $189.15 & their nearest resistance points are $199.26 & $200.03/share.
Let’s dive into this week’s top & bottom performing ETFs that provide dividends & also have tradable options.
Please note as reading this week’s post that due to anticipated volatility, using options strategies is the most effective way to trade the names listed below, but it began to sound redundant during the publishing.
Mexico (EWW), Steel (SLX), US Home Construction (ITB) & The Netherlands (EWN) Are All Bullishly Leading The Market
EWW, the iShares MSCI Mexico Capped ETF has gained +20.53% over the past year, gaining +37.45% since their lows of September 2022.
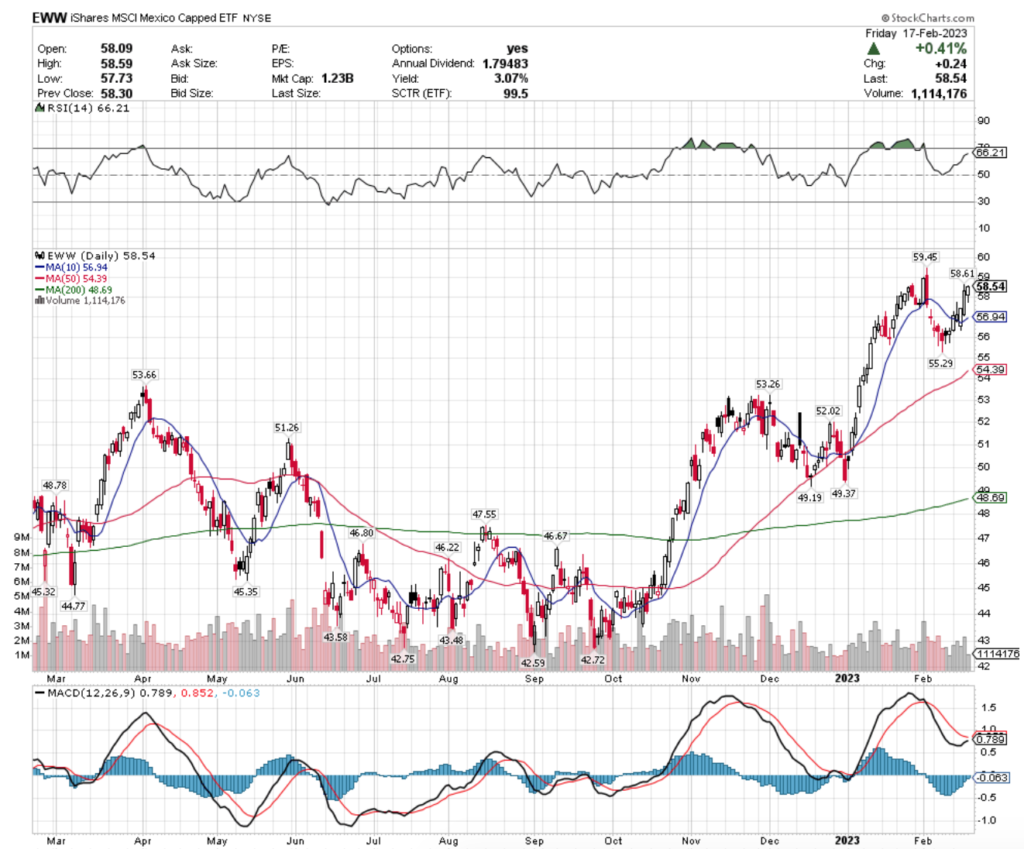
They offer a 3% cushion in the form of a dividend for investors who hold for a year, but their RSI is nearing overbought territory.
While their MACD shows that there could be a bit more momentum in the near-term, current resistance levels are $58.61 & $59.45, near the 52 week high.
It appears best to wait & see how their price behaves around their $56.94, $55.29 & $54.39 support levels before making any moves on EWW.
SLX, the VanEck Vectors Steel ETF has gained +24.21% over the past year, climbing +52.88% since their low in July 2022.
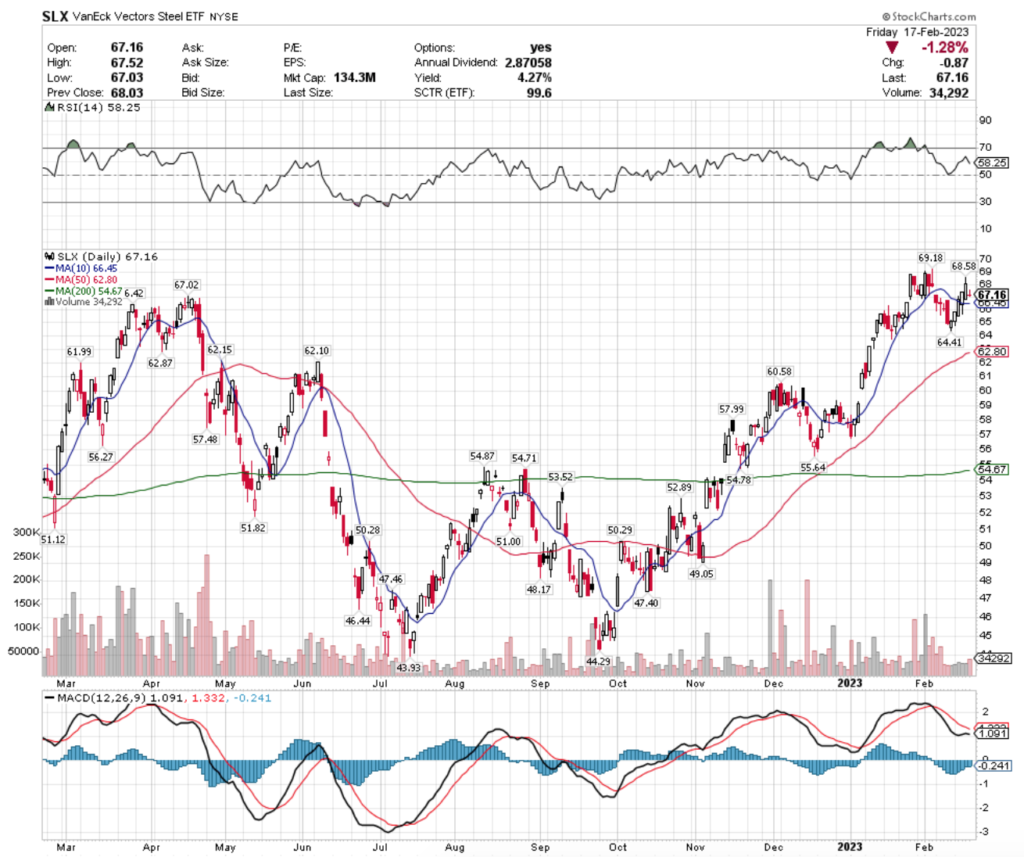
They offer a better cushion for reducing the impact of a price decline in the name of a 4.27% dividend.
However, just like EWW, SLX’s primary resistance levels now are at & near their 52 week high levels, $68.58 & $69.18/share.
Their support levels of $67.02, $66.45 & $66.42 will be interesting to get more insight into where SLX goes next.
ITB, the iShares US Home Construction ETF has gained +3.58% over the past year, with a +43.65% gain from their low of July 2022.
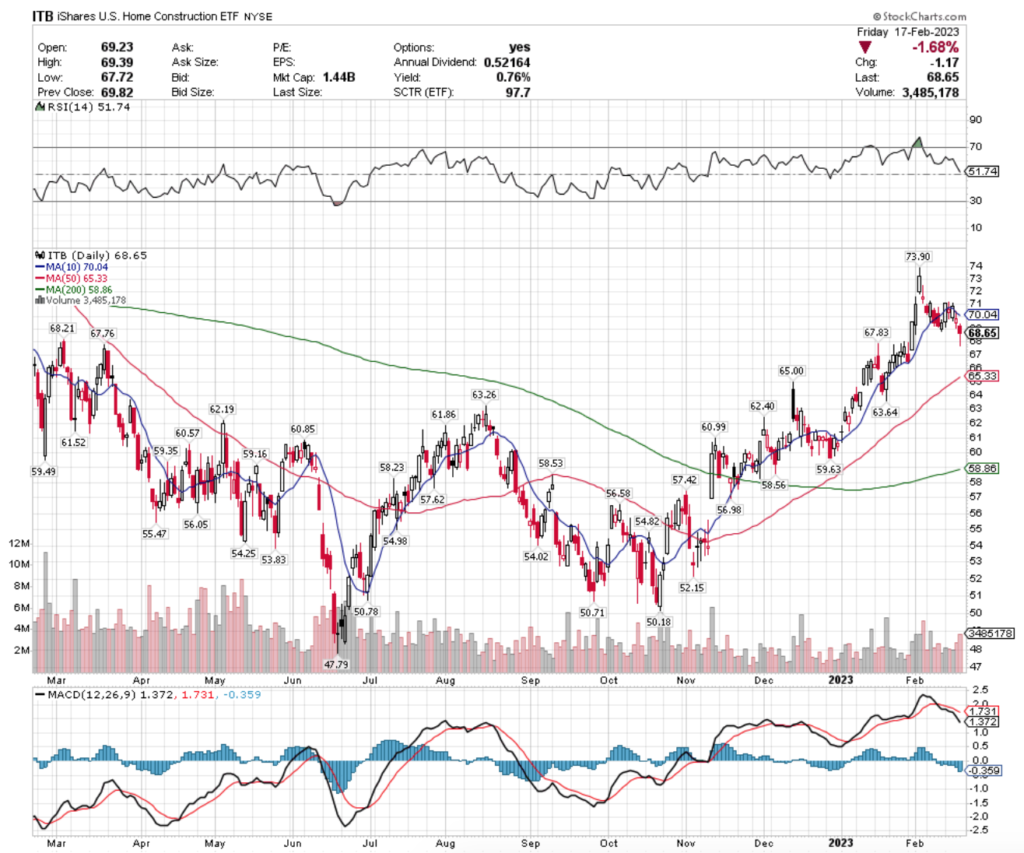
They have less protection from their modest 0.76% dividend, and signal further declines in the near-term based on their bearish MACD & most recent candlesticks.
With overhead resistance also near the 52 week highs at $70.04 & $73.90, it would be best to wait & see how they behave around their $68.21, $67.83 & $67.76 support levels before entering a new position.
EWN, the iShares MSCI Netherlands ETF has dropped -4.8% over the last year, but has bounced back +48.26% since their low of October 2022.
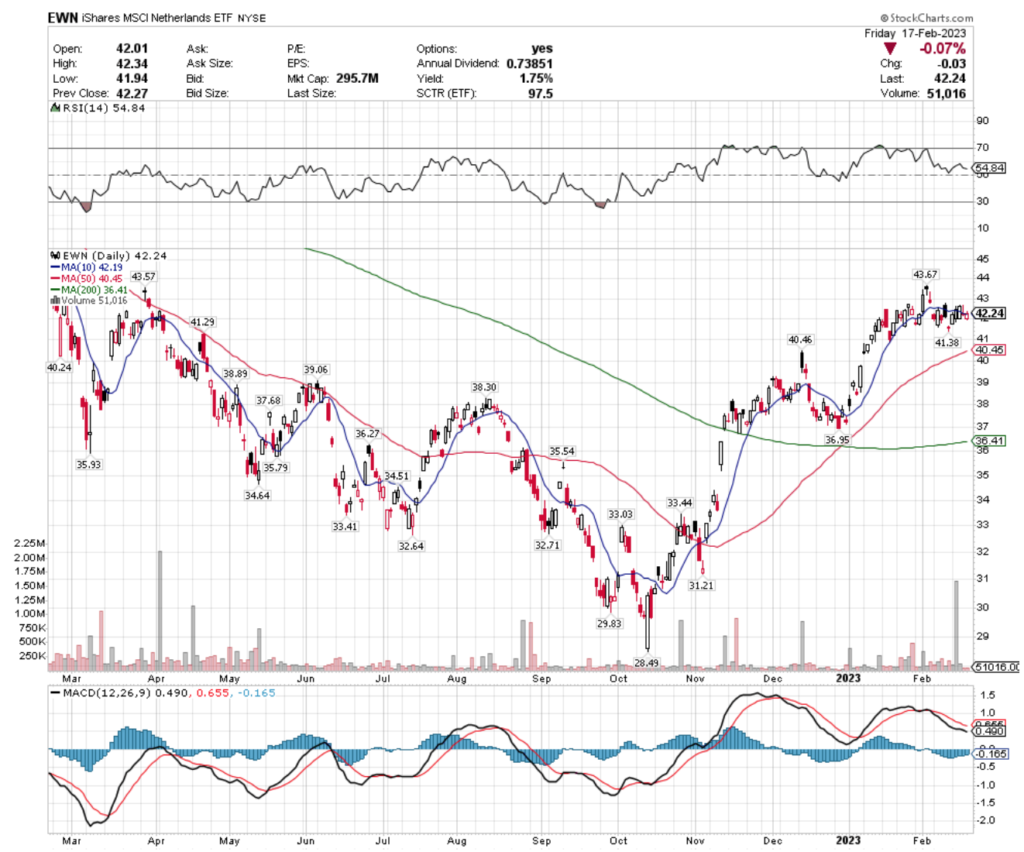
They’ve spent much of 2023 so far consolidating in the $41-43 range & their MACD signals that there is more near-term losses on the horizon.
With only 1.75% in protection from their dividend & resistance at the $43.57 & $43.67/share range, it would be wise to see how they behave at their $42.19, $41.38 & $41.29/share support levels before entering a position.
China (YINN), Utilities (UTSL), Psychedelics (PSIL) & Junior Gold Miners (SGDJ) Are All Bearishly Lagging The Market
YINN, the Direxion Daily FTSE China Bull 3x Shares has dropped -70.34% over the last year.
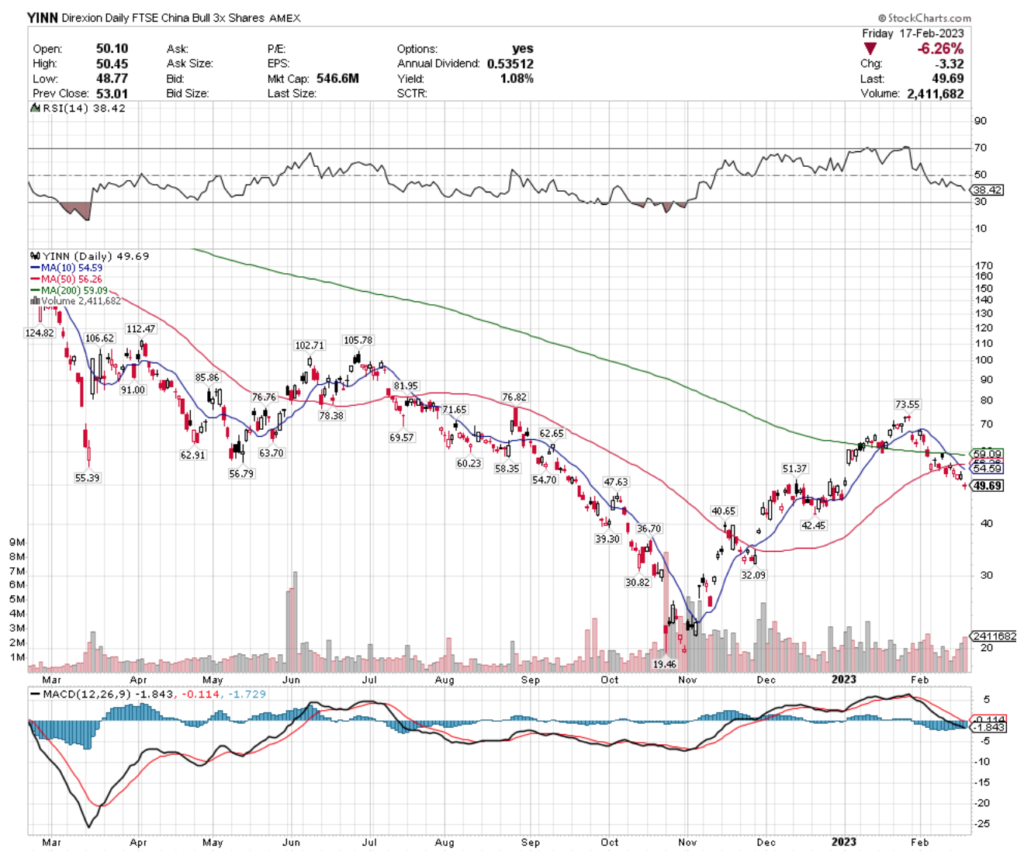
Their MACD is beginning to turn less bearish, with an RSI approaching oversold territory.
Their support level of $47.63 will be critical, as their next support levels from the past 52 weeks are at $42.45 & $40.65 & their 1% dividend does not offer much cushion.
UTSL, the Direxion Daily Utilities Bull 3x Shares has fallen -1.5% over the past year, with a -38.49% decline since their high in April of 2022.
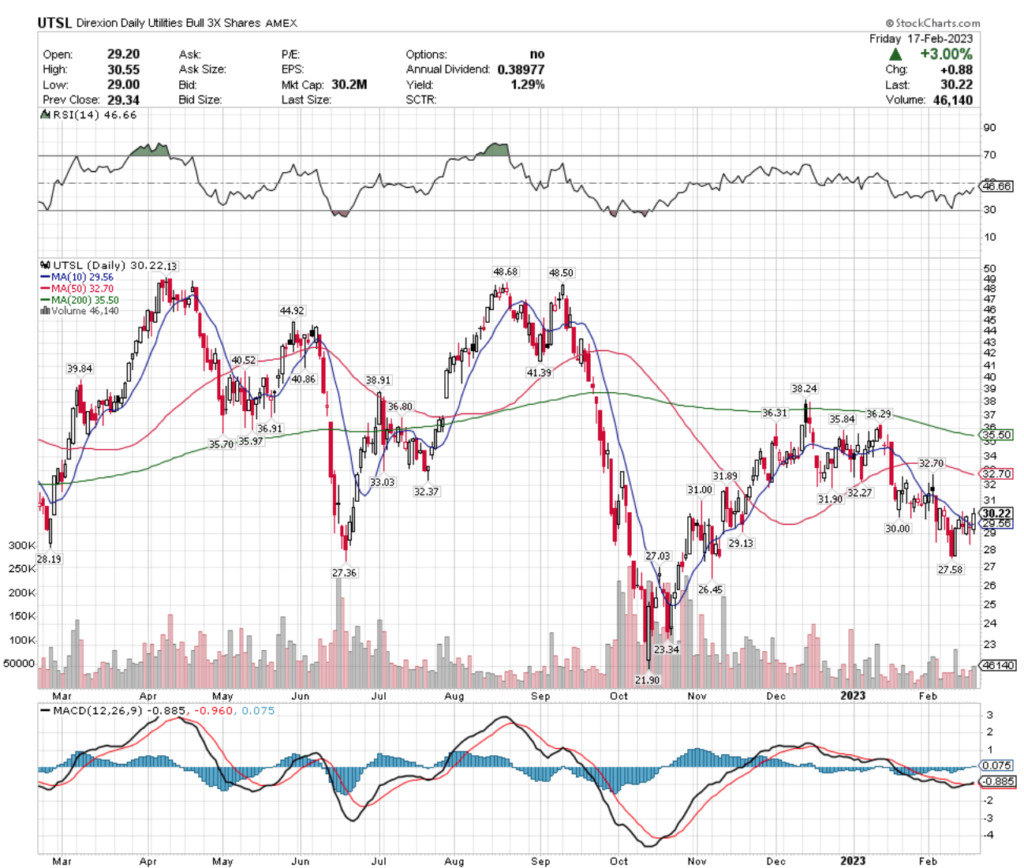
Their MACD recently turned bullish, and their RSI is approaching neutral again, while we wait to see if they pivot upwards from their $27.58 support level they just touched.
UTSL has resistance overhead at the $31 & $31.89/share price levels, with additional support at the $30.22, $30 & $29.56/share (10 Day Moving Average) price points.
PSIL, the AdvisorShares Psychedelics ETF has dropped -1.5% over the past year, but has fallen -38.49% from their high of April 2022.
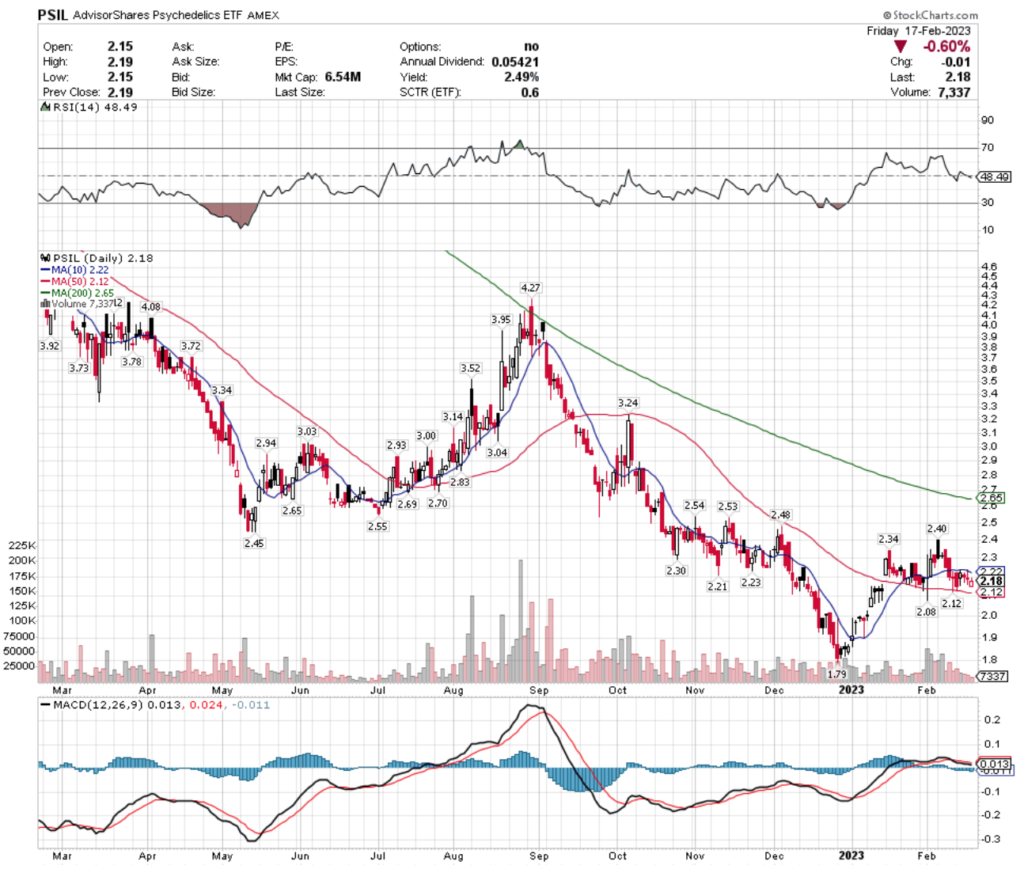
Their recent candlesticks signal that there is additional declines for PSIL in the near-term that their 2.5% dividend can’t protect against.
PSIL has support at the $2.12 (2 points), $2.08 & $1.79/share, while their resistance levels are currently at $2.21, $2.22 & $2.23.
SGDJ, the Sprott Junior Gold Miners ETF has dropped -30.33% over the last year, and decreased -37.78% since their high of April 2022.
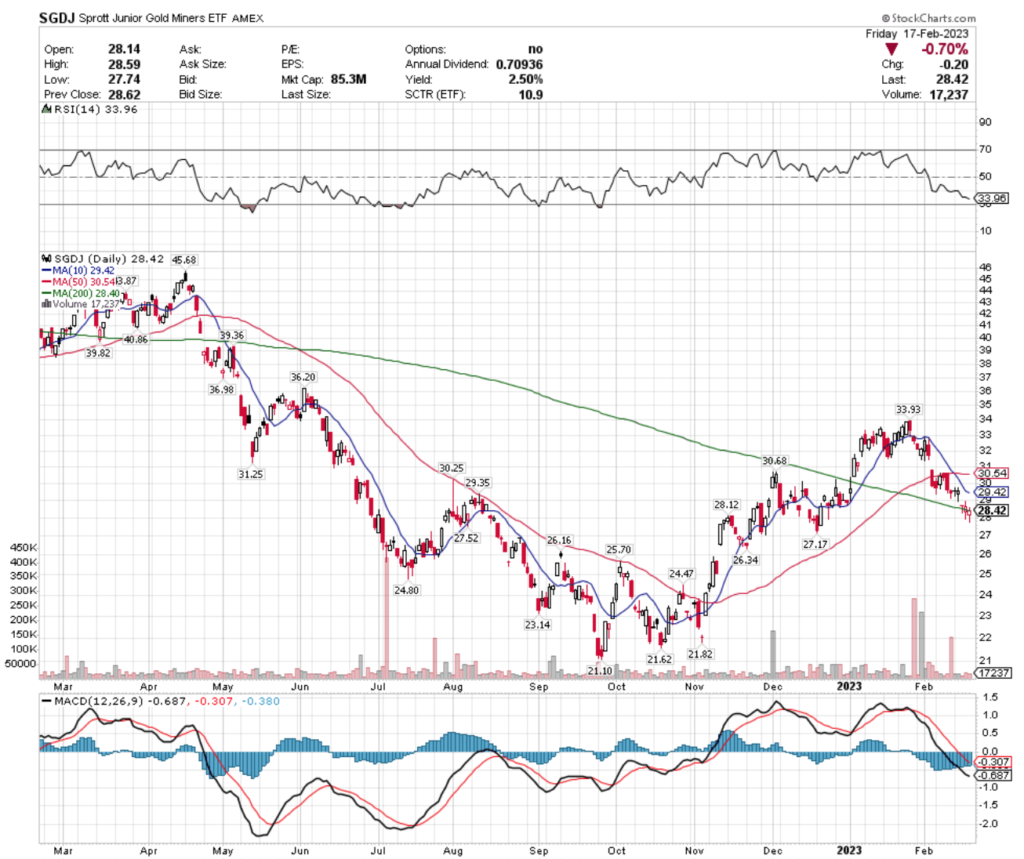
Their $28.12 support level will be important to watch, with the next levels coming in at $27.52 & $27.17.
SGDJ’s MACD is beginning to level out, but it is still too early to tell if it will turn bullish in the near-term or not, although their RSI is fast approaching oversold territory.
SGDJ’s next resistance levels are $29.35, $29.42 & $30.25.
Tying It All Together
This week will kick off slowly, with the markets being closed Monday in observance of President’s Day.
Tuesday we get the S&P Flash US Services PMI, S&P Flash US Manufacturing PMI & Existing Home Sales data.
Wednesday brings us the FOMC Minutes of the February 1st Meeting, followed by Initial Jobless Claims, GDP & Atlanta Fed President Bostic speaking on Thursday.
Friday concludes the week with Consumer Spending, Personal Income (both nominal), PCE Index, Core PCE Index, Core PCE Y-o-Y, New Home Sales & Consumer Sentiment numbers.
Have a great week!
*** I DO NOT OWN SHARES OR OPTIONS CONTRACTS IN SPY, QQQ, IWM, EWW, SLX, ITB, EWN, YINN, UTSL, PSIL or SGDJ AT THE TIME OF PUBLISHING THIS ARTICLE ***