Last week was a volatile week for stocks across the board, fueled mostly by Federal Reserve Chairman Powell’s testimonies to the House & Senate, as well as employment data & the fallout of Silicon Valley Bank’s failure news.
SPY, the SPDR S&P 500 ETF lost -4.52% over the past week, starting the week off with a shooting star candlestick on Monday to initiate the fall.
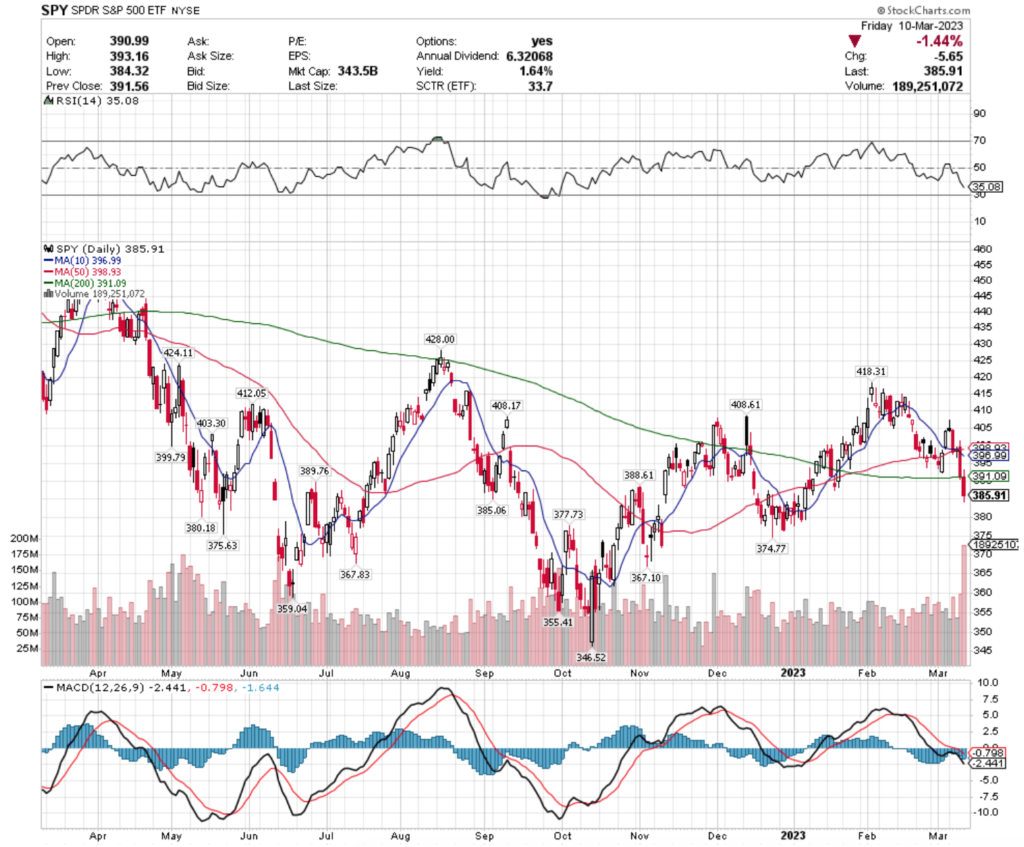
Their RSI is nearing oversold & their MACD is looking very bearish, but Friday’s volume spike that eclipses the rest of the year’s volume readings signals more near-term unrest for investors.
Previously in the year, the nearest volume readings for SPY came in during the large declines of May & June 2022.
Investors & traders need exercise caution in SPY in the near-term, with their current nearest support levels being $385.06, $380.18 & $377.73, leaving room open for new gap downs this week.
QQQ, the Invesco QQQ Trust ETF that tracks the NASDAQ dropped -3.71% last week, faring slightly better than SPY, but still signaling the same technical weakness over the course of the week.
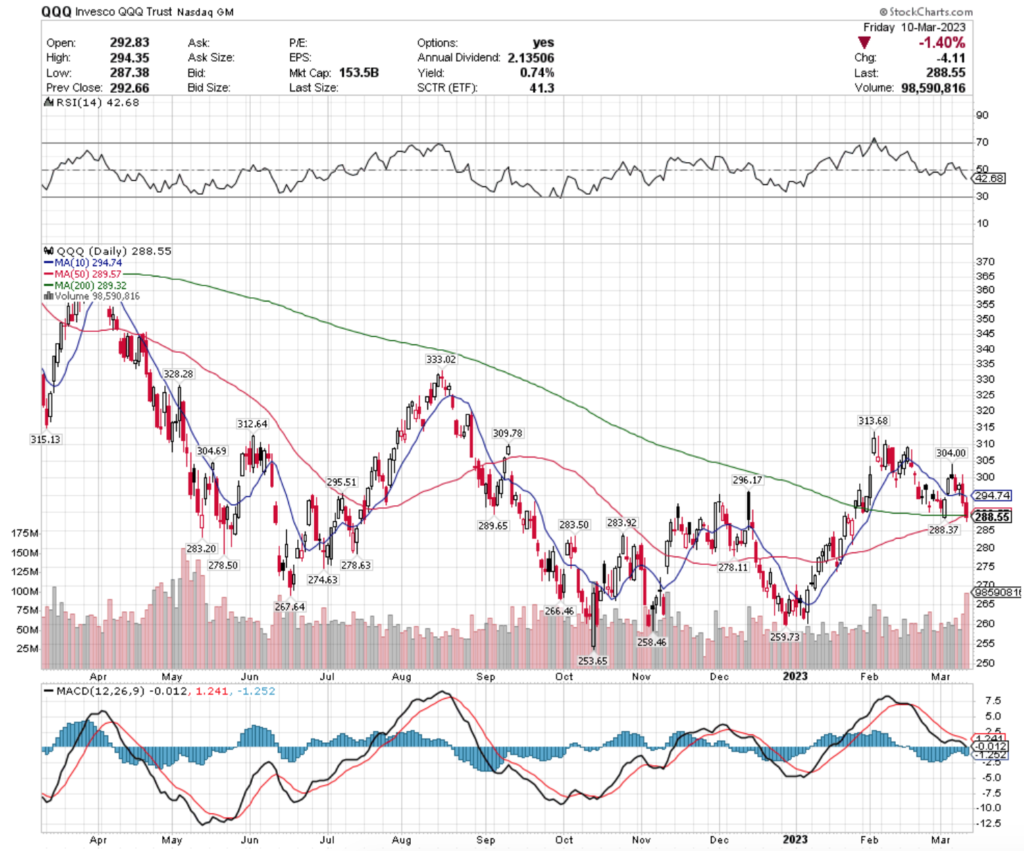
Given the NASDAQ is more susceptible to tremors caused by interest rates than SPY, they will likely see more outflows in the coming week as we get the CPI & PPI data coming in.
Their RSI is a bit closer to neutral, but their MACD is also showing bearishness to continue on the horizon.
With the difference between QQQ & SPY’s RSI, there is more room for QQQ to fall before triggering a technical oversold signal, which may be a factor in this coming week.
QQQ has support at the $288.37, $283.92, $283.50 & $283.20/share price levels, with resistance at the $289.32 (200 day moving average), $289.57 (50 day moving average), $294.74 & $295.51/share price levels.
IWM, the iShares Russell 2000 ETF fell -8% this past week, showing that smaller cap names were hurt the worst by the week’s volatility.
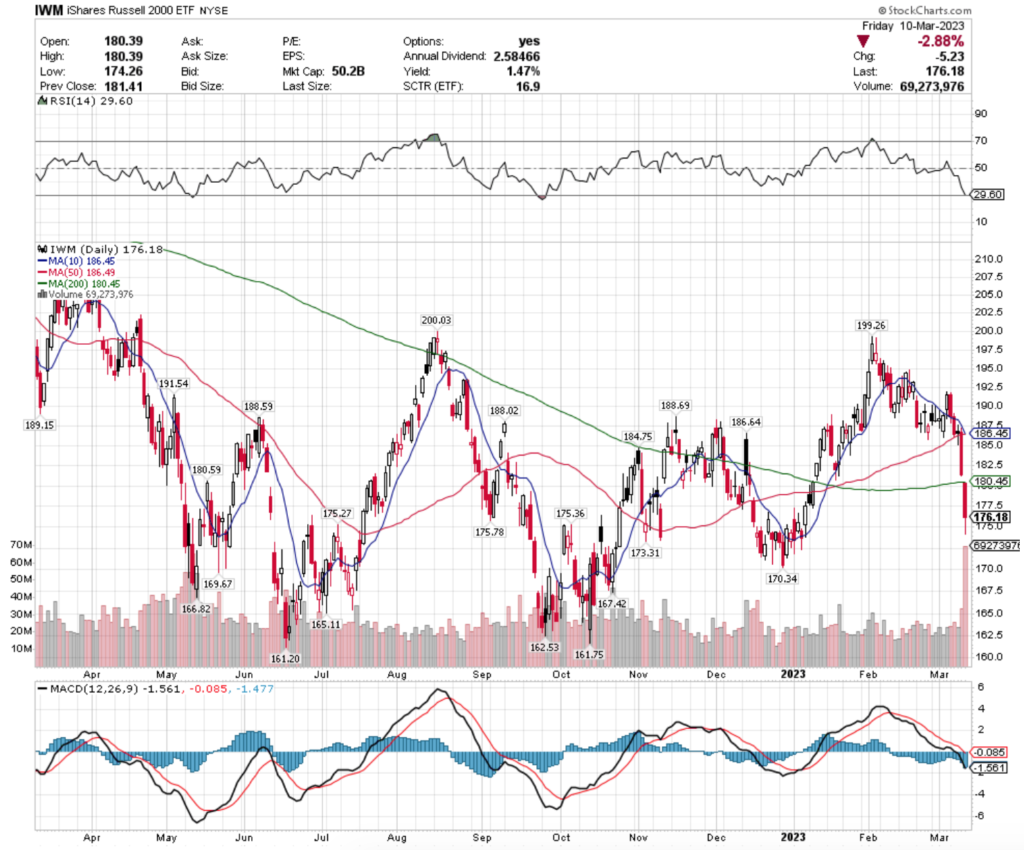
Their volume was much more in line with the larger cap stocks SPY’ compared to the NASDAQ.
However, their RSI is already in oversold territory & their MACD is heading in bearish decline.
IWM has support at the $175.78 $175.36, $175.27 & $173.31/share price levels, with the next resistance points falling at $180.45 (200 day moving average), $180.59, $184.75 & $186.64/share.
Let’s dive into some of this week’s top & bottom performing sectors & geo-locations based on our technical data ratings for ETFs!
Semiconductors (USD), European Hedged Equity (HEDJ), U.S. Infrastructure Development (PAVE) & Precious Metals (DBP) Are All Bullishly Leading The Market
USD, the ProShares Ultra Semiconductors ETF has dropped -33.4% over the past year, but has recovered +98.5% since the lows of October 2022 (excluding distributions collected from their modest 0.21% yield for long-term holders).
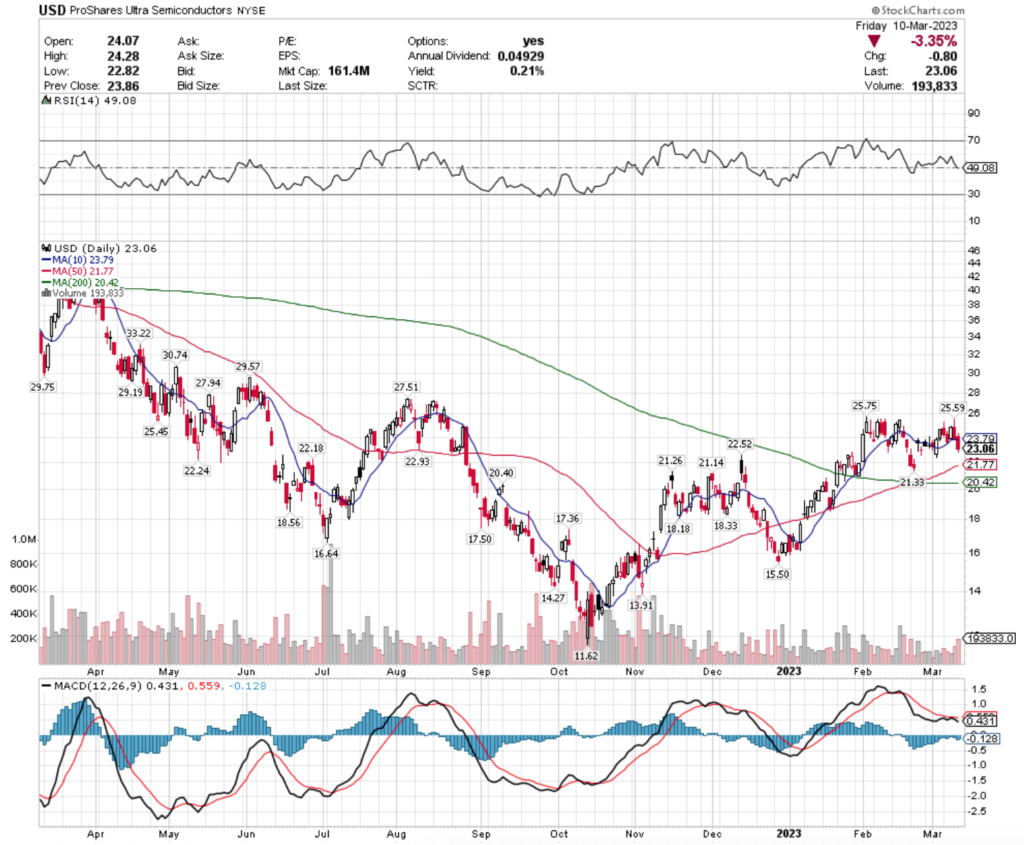
Recent volumes have been below average compared to the year prior, their RSI is neutral & their MACD is slightly bearish after recent consolidation over the last two months.
Their distribution yield doesn’t provide much cushion at 0.21%, making options the most appealing way to play defensively in USD.
USD has support at the $22.93, $22.52, $22.24 & $22.18/share price level (with a zone of decent support in the $21-22 range), with overhead resistance at the $23.79 (10 day moving average), $25.45, $25.59 & $25.75/share price levels.
HEDJ, the WisdomTree Europe Hedged Equity Fund ETF has gained +15.61% over the past year, while climbing +29.3% (ex-distributions) since their lows in September of 2022.
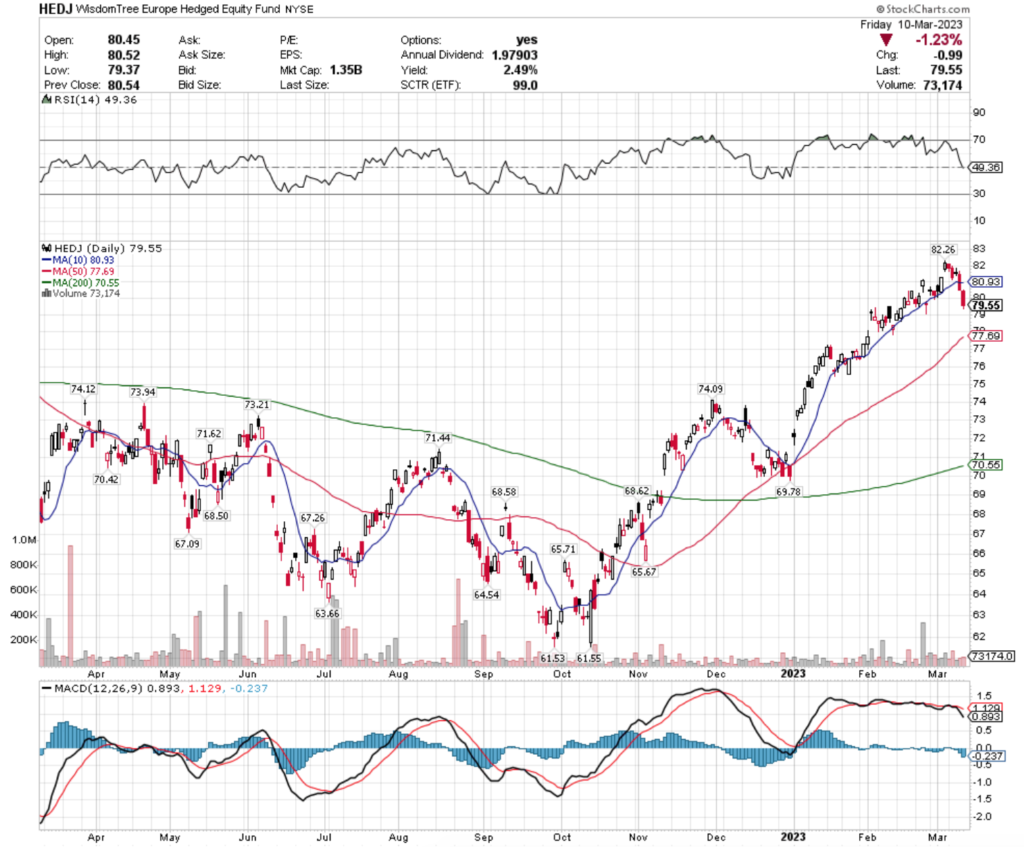
They have been on a major uptrend since October 2022, with their recent trading volume being about average compared to the year prior’s volatile volumes.
HEDJ’s RSI is neutral, but their MACD is showing bearish signals in the near-term.
Their only resistance levels from the past 52 weeks are the $80.93 (10 day moving average) & $82.26/share price level, and their support levels are at $77.69, $74.12 & $74.09, signaling that there is a lot of room for HEDJ to cool off in the near-term.
With so little nearby support in the last 52 weeks, this appears to be a name to wait until it has cooled off a bit before investing, as their 2.49% annual distribution can only provide so much protection.
Traders can capitalize on their consolidation & new range establishing using put options, which the profits from can in turn be applied to purchasing additional long-term shares.
PAVE, the Global X U.S. Infrastructure Development ETF has gained +4.52% over the past year, gaining +27.5% since their lows of June 2022 (ex-distributions).
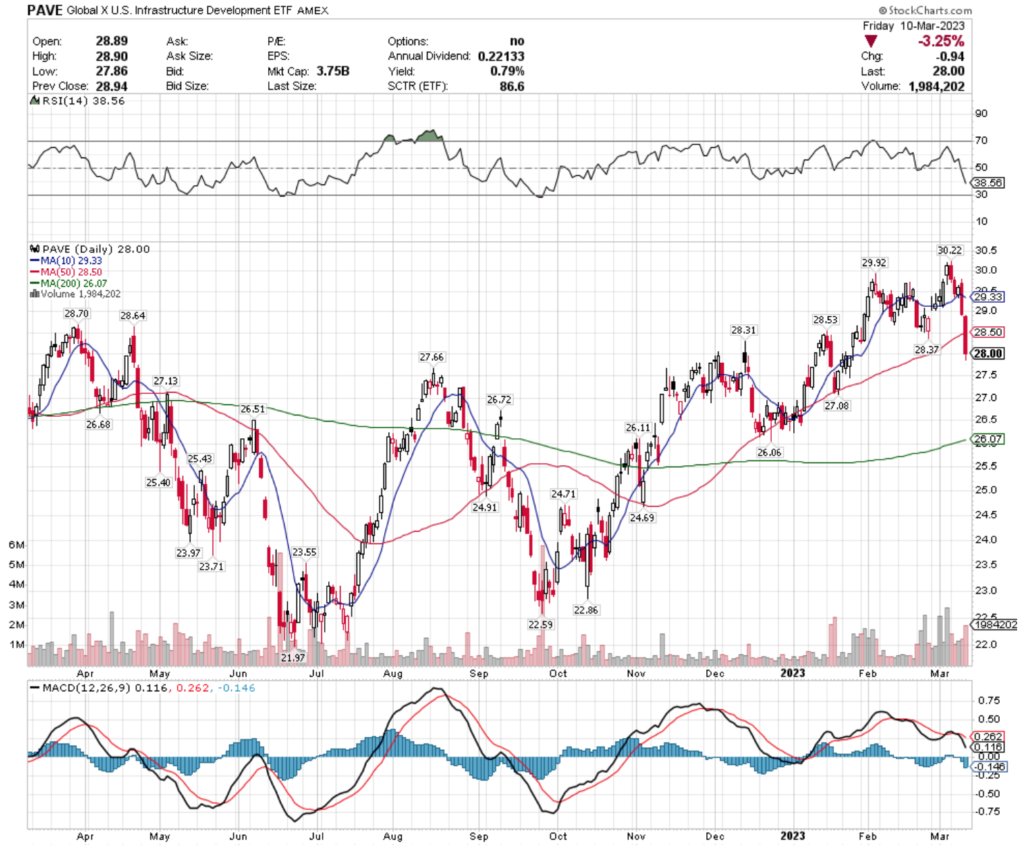
Their past month’s trading volumes have been above average compared to the year prior, but their RSI is approaching oversold after falling 4 of the last 5 sessions.
PAVE’s MACD is signaling more near-term weakness, and their distribution yield provides little cushion at 0.79% annually.
PAVE has support at the $27.66, $27.13 & $27.08 price levels, with resistance at $28.31, $28.37, $28.50 (50 day moving average) & $28.53/share.
This looks to be another situation where it is best to watch how the ETF interacts with their support/resistance levels & use options as protection in the meantime.
DBP, the Invesco DB Precious Metals Fund ETF has lost -10.4% over the past year, but has climbed +13.9% (ex-distributions) since their low of September 2022.
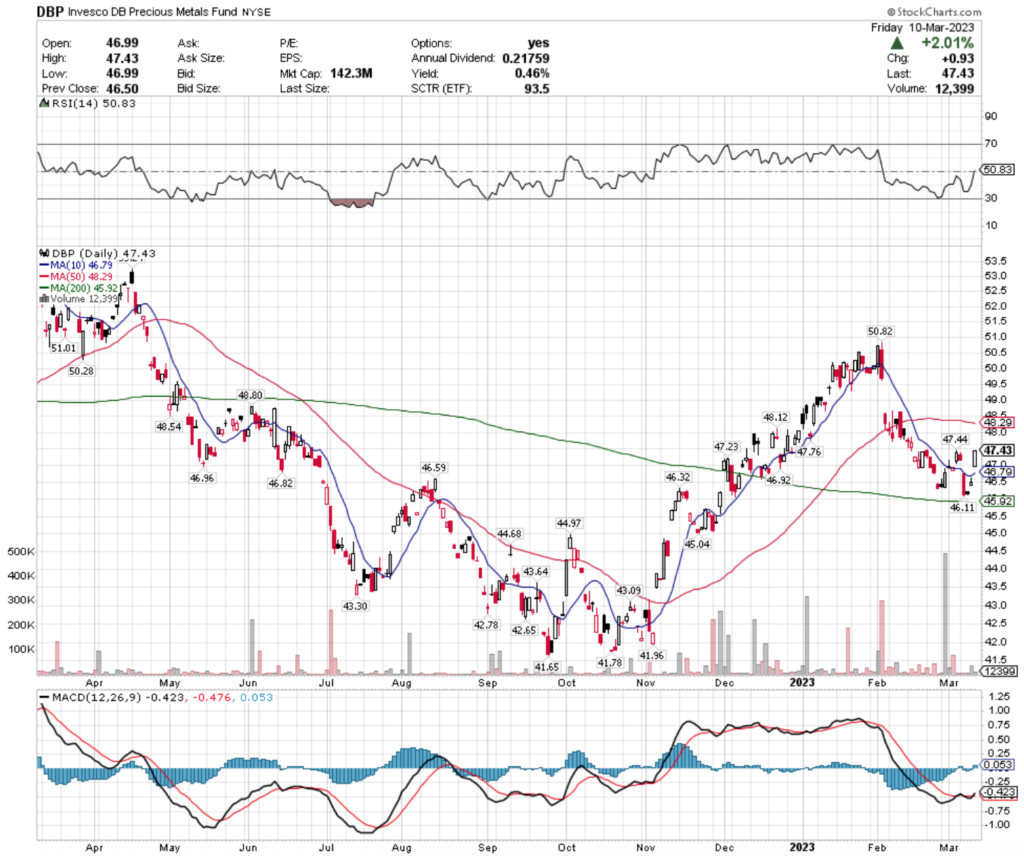
Their RSI is neutral & their MACD is bullish, leaving investors & traders to wait & see how they behave around their recent gaps of the last few weeks.
While DBP is listed as optionable, there is no open interest in the next two month’s strike prices, leaves traders & investors with limited protection from loss as their distribution level for the year is only 0.46%.
DBP has support at the $47.23, $46.96 & $46.92/share price levels, with resistance at $47.44, $47.76 & $48.12/share.
Traders & investors should see how they behave at these price levels before buying more or entering into a new position in DBP to minimize potential losses.
Regional Banks (DPST), Lithium (LIT), Oil & Gas (DIG) & U.S. Healthcare Providers (IHF) Are All Bearishly Lagging The Market
DPST, the Direxion Daily Regional Banks Bull 3x Shares ETF has lost -70.5% of its value since one year ago, falling -73.6% from their high in March 2022 (ex-distributions).
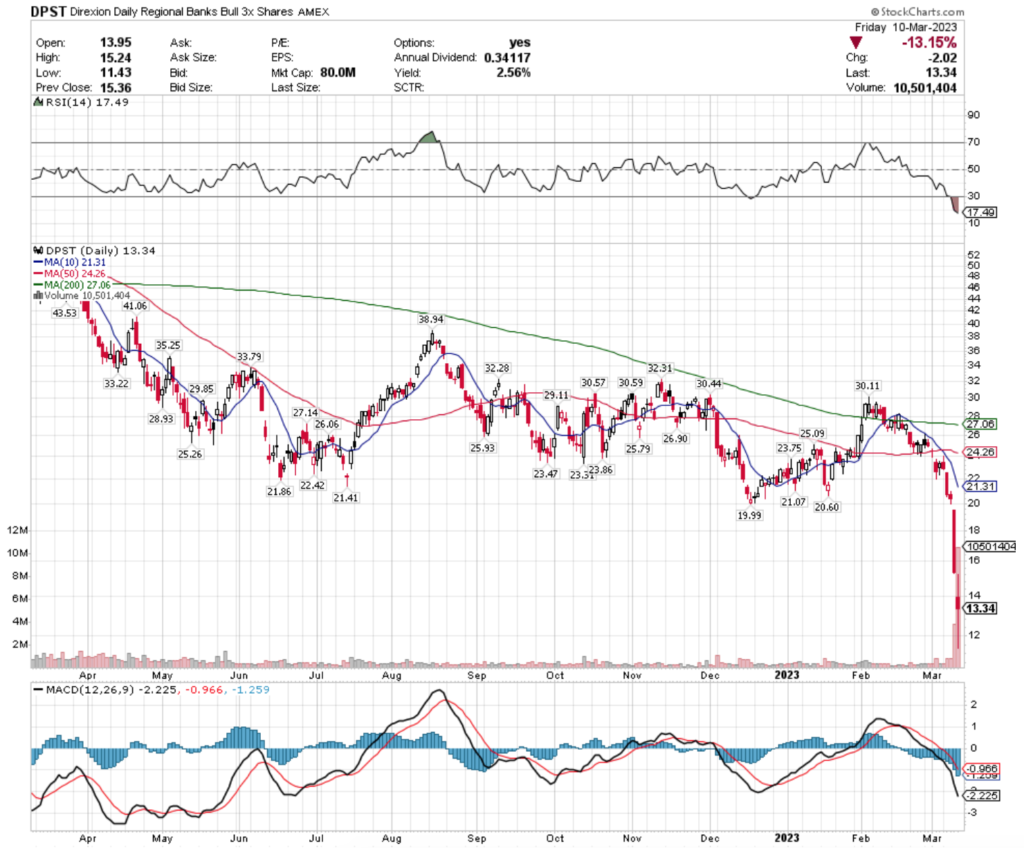
Their RSI is oversold & MACD is also highly bearish after they stepped off of a price cliff in the beginning of March.
Their above average volume recently has coincided with these losses, and in the last 52 weeks they have no support, as the low of Friday’s candlestick at $11.43 is the lowest level they’ve been at in that time period.
They have resistance at $19.99, $20.60 & $21.07.
While their 2.56% distribution will provide some form of cushion for long-term holders of the ETF, this is one to tread lightly around until it has consolidated into more of a range & behaves less volatily.
LIT, the Global X Lithium ETF has lost -14.14% over the past year, falling -25.6% (ex-distributions) from their peak in August 2022.
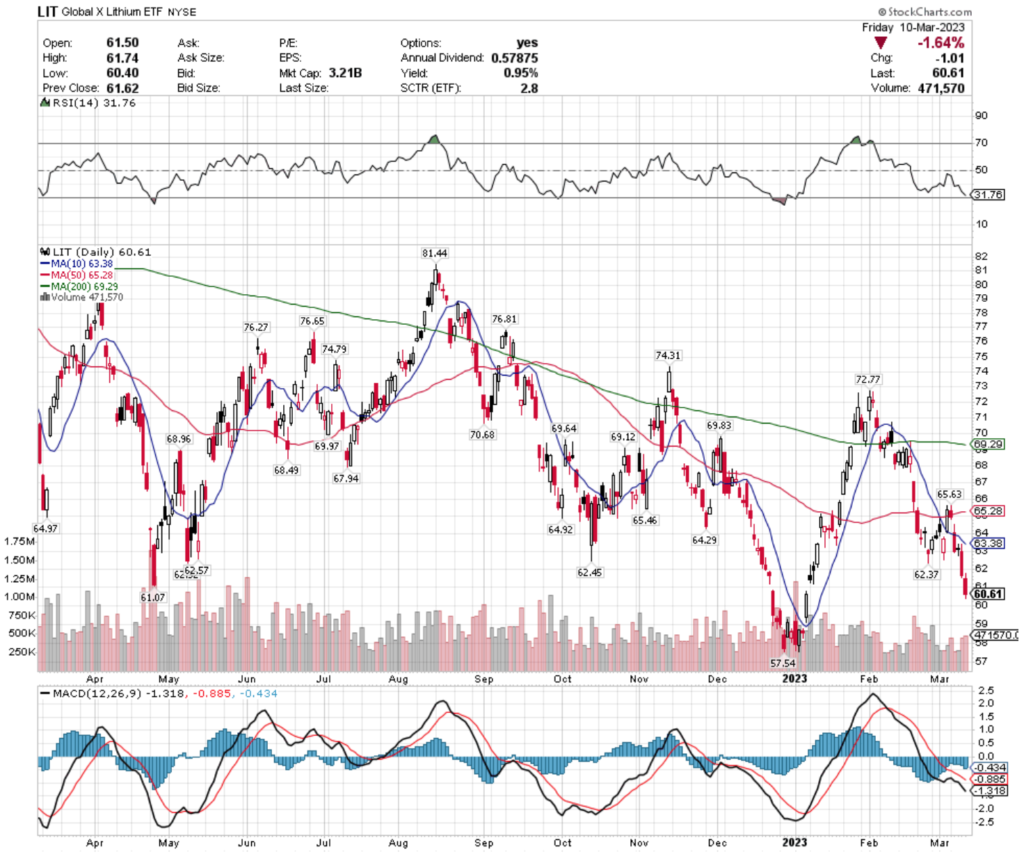
Their RSI is also oversold & their MACD is in a significant downtrend, with recent trading volumes being below average.
With only a 0.95% distribution yield, they do not offer much protection to the downside & their only support level of the past 52 weeks is at $57.54.
LIT has resistance at the $61.07, $62.32, $62.37 & $62.45/share price levels.
Unless trading options, this also looks like one to wait before making any moves into until after it has consolidated more.
DIG, the ProShares Ultra Oil & Gas ETF has gained +7.85% over the past year, but has fallen -26.33% (ex-distributions) from their high of November 2022.
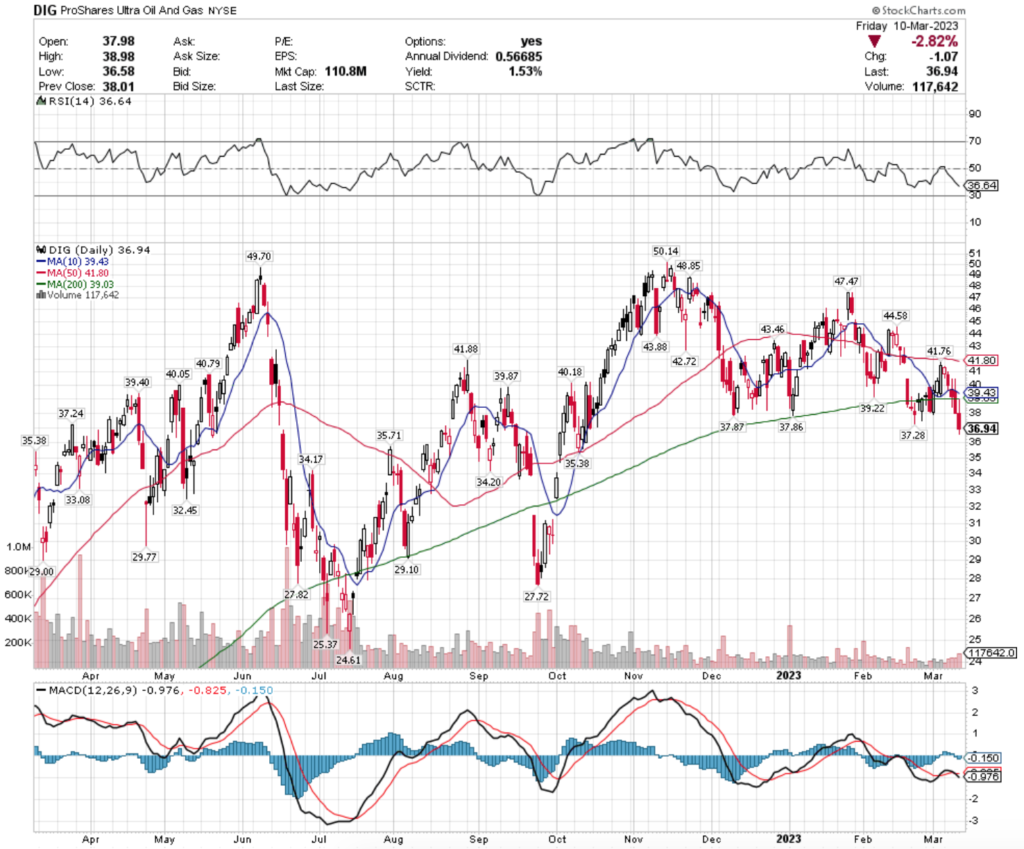
Their MACD recently had a bearish crossover, and their RSI is approaching oversold territory, on weaker than average trading volumes compared to the year prior.
Their next levels of support are at the $35.71, $35.38 & $34.20/share price levels, with resistance at the $37.24, $37.28, $37.86 & $37.87/share price levels.
While their annual distribution provides long-term holders with a 1.53% cushion, it does not look safe enough to be making moves on DIG from a long-term perspective, but options can be traded for protection.
IHF, the iShares U.S. Healthcare Providers ETF has fallen -11.72% over the past year, losing -17.83% (ex-distributions) from their high of April 2022.
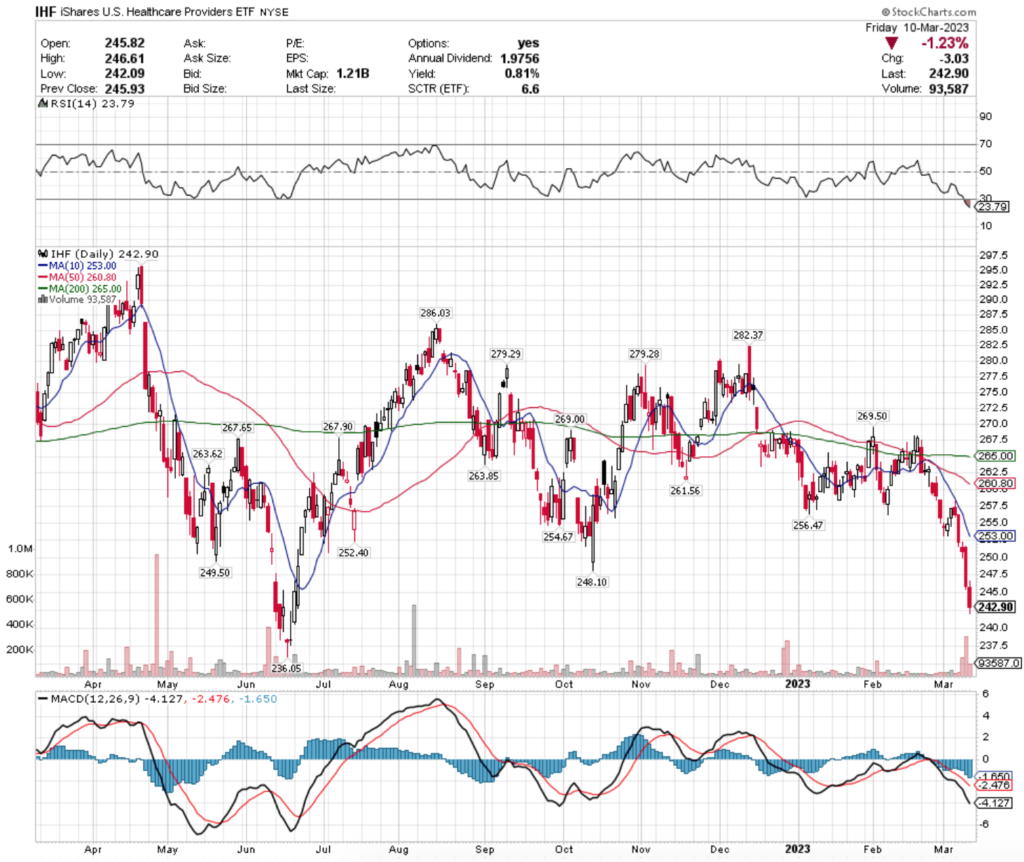
Their RSI is heavily oversold & their MACD has been in a bearish decline for the last 3 weeks as the ETF suffered.
Recent trading volumes have been above average, but their past year’s volumes are very volatile, much like the share price.
IHF’s only support from the past 52 weeks is at $236.05, with resistance at $248.10, $249.50 & $252.40.
They too should be approached with caution until they have consolidated more & established a more stable price range, but options traders can find profits from the chaos of their near-term volatility.
Tying It All Together & The Week Ahead
It goes without saying that Silicon Valley Bank will be a popular headline generator this upcoming week, especially as Monday has no major economic data to report on.
We have yet to see all of the fallout from their failure & what other dangers are lurking in the coal mine that this particular canary is warning us of.
Tuesday will bring their (former) executives some relief, as all eyes will shift towards the CPI data readings at 8:30 am (CPI, Core CPI & each’s Y-o-Y change), as well as the NFIB Optimism Index.
Wednesday we will hear data on Retail Sales, Retail sales ex-auto’s, the Empire State Manufacturing data, Business Inventories & Homebuilders Survey.
Of course, most eyes Wednesday will be more interested on the PPI data that will also be released at 8:30 am that morning.
Thursday sees us receiving data on Initial Jobless Claims, Import Price Index, Housing Starts, Building Permits & the Philadelphia Fed Manufacturing data, all at 8:30 am.
Friday rounds the week off with Industrial Production, Capacity Utilization, U.S. Leading Economic Index & Consumer Sentiment data.
While I’m not an economist, the candlesticks that we saw all of last week signal more near-term volatility to come.
Monday’s shooting star candlestick on SPY & QQQ, paired with IWM’s bearish candle paired with the following day’s relative freefall spell more near-term volatility to come.
See you back here next week!
*** I DO NOT OWN SHARES OF OR OPTIONS CONTRACT POSITIONS IN SPY, QQQ, IWM, USD, HEDJ, PAVE, DBP, DPST, LIT, DIG or IHF AT THE TIME OF PUBLISHING THIS ARTICLE ***