SPY, the SPDR S&P 500 ETF fell -1.5% last week, while the VIX closed the week at 27.19, indicating an implied one day move range of +/-1.71% & an implied one month move range of +/-7.86%.
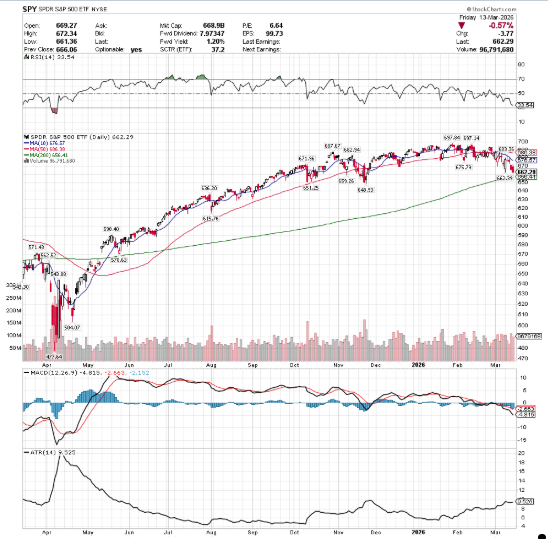
Their RSI is trending down, approaching the oversold 30-mark at 33.54, while their MACD is bearish, as it has been for most of 2026 so far.
Volumes were +13.29% higher than the prior year’s average (88,696,000 vs. 78,290,000), indicating that there is more of a risk-off sentiment creeping into the market.
Monday opened the week off with a bullish engulfing pattern formation on solid volume, likely baiting smaller fish into buying into the market.
Tuesday confirmed this when the session opened lower, climbed above Monday’s high, only to decline in a high wave gravestone doji, indicating that there was still bearish sentiment left among market participants.
Wednesday this theme continued, with a lower open and another doji candle indicating uncertainty & complacency at once, on the week’s lowest volume (Tuesday had the second lowest).
Something of note here is that the 10 day moving average has been signaling that there is no faith in the short-term trend & has held up robustly as a resistance level.
Thursday opened on a gap down that broke down the lower Bollinger Band on the highest volume of the week signaling that there was a bit of panic spreading & that folks were moving towards the exit.
Friday opened higher, but slumped throughout the day as there was a risk-off heading into the weekend sentiment, indicated by the second highest volume of the week.
Heading into the new week keep an eye on how high prices can break out above the short-term trendline or if it holds staunch & forces price lower, particularly if there is a break made towards the 200 day moving average which is now within <1% of the week’s closing price level for SPY.
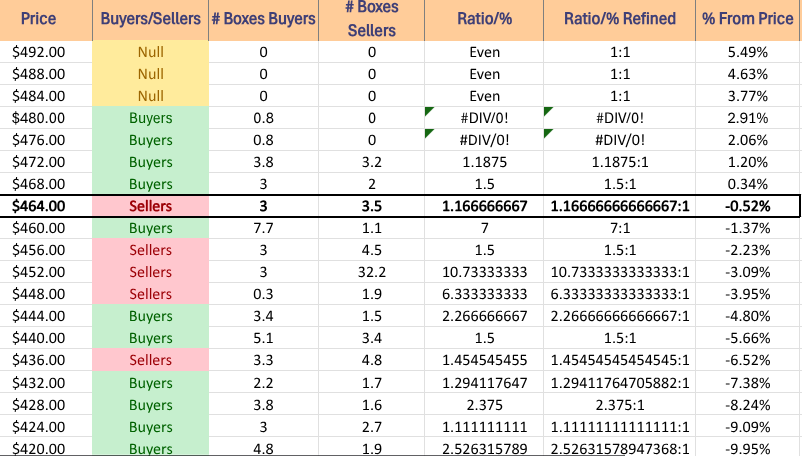
This is particularly interesting as it is currently in a Seller dominated price zone that sits atop another Seller zone, which may show us the breakdown of the 200 DMA as support levels are spread rather thin, as outlined below.
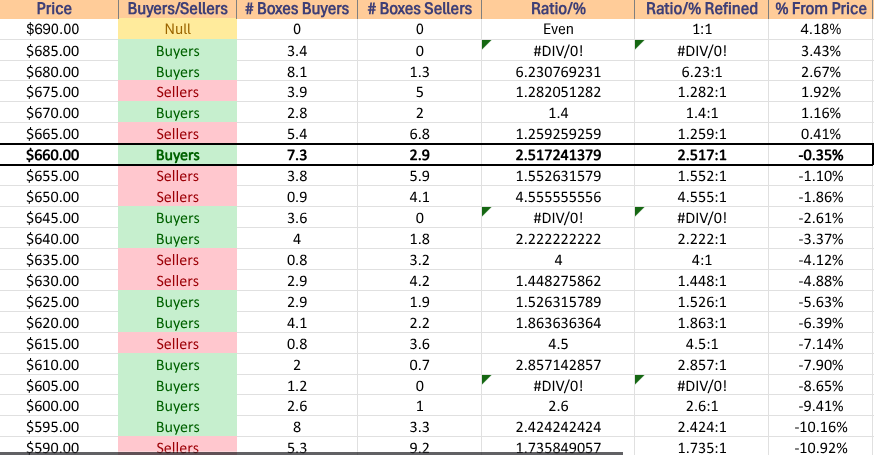
SPY has support at the $659.26 (Volume Sentiment: Sellers, 1.55:1), $656.41 (200 Day Moving Average, Volume Sentiment: Sellers, 1.55:1), $651.25 (Volume Sentiment: Sellers, 4.56:1) & $648.93/share (Volume Sentiment: Buyers, 3.6:0*) price levels, with resistance at the $662.39 (Volume Sentiment: Buyers, 2.52:1), $671.96 (Volume Sentiment: Buyers, 1.4:1), $675.79 (Volume Sentiment: Sellers, 1.28:1) & $676.57/share (10 Day Moving Average, Volume Sentiment: Sellers, 1.28:1) price levels
QQQ, the Invesco QQQ Trust ETF dipped -1.01% for the week, as the tech-heavy index fared the best of thefour major index ETFs.
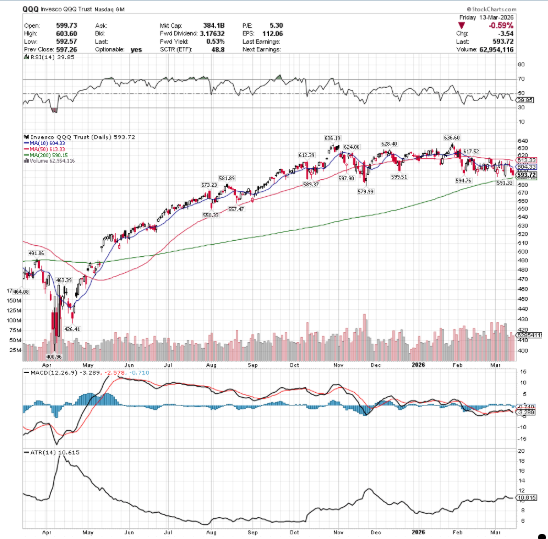
Their RSI is trending down, currently at 39.85, while their MACD crossed over bearishly towards the end of the week.
Volumes were +29.62% higher than the prior year’s average (70,054,000 vs. 54,047,720), as investors hopped into the tech heavy index on Monday & Tuesday in droves, before rug pulling their money out by week’s end.
Monday opened lower, but like SPY managed to power higher to form a bullish engulfing pattern with Friday’s candle on the highest volume of the week for QQQ.
Tuesday opened higher, ran up towards the upper Bollinger Band, but ultimately sank down for a slight advance, but forming a gravestone doji which signaled that pessimism was strong.
Wednesday is when the cracks began to show, as a bearish engulfing doji emerged that closed in-line with the 10 day moving average, signaling that there was a problem for the short-term trendline.
Thursday opened on a gap down that ultimately sank lower to touch the lower Bollinger Band, indicating that there was trouble in the air for the tech-heavy index, particularly as it was the second highest volume session of the week.
Friday the trend continued and was confirmed, with a higher open that ran up to test the resistance of the 10 day moving average, only to be rejected & sink back down to close below the lower Bollinger Band on comparable volume to Thursday’s sell off.
This week shares a similar outlook to SPY, the 10 DMA will be an area to watch as it will either walk QQQ down further, or a breakout may occur, but the former seems the more likely case.
Below is a list of the Buyer:Seller sentiment for QQQ.
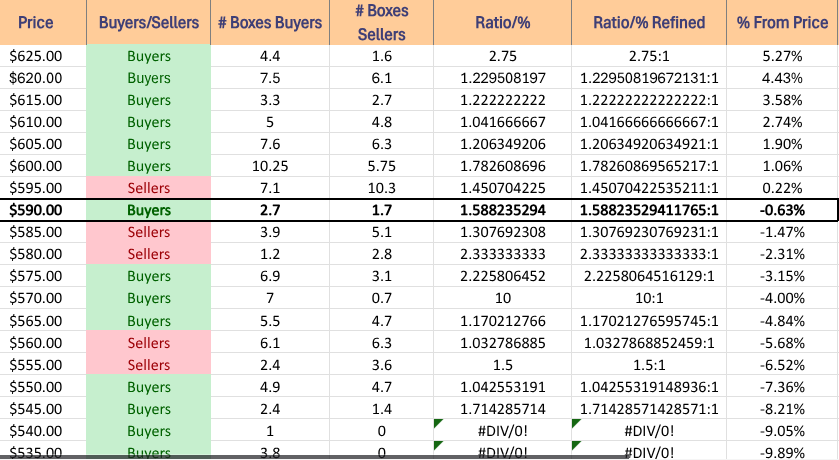
QQQ has support at the $591.33 (Volume Sentiment: Buyers, 1.59:1), $590.15 (200 Day Moving Average, Volume Sentiment: Buyers, 1.59:1), $589.37 (Volume Sentiment: Sellers, 1.31:1) & $581.89/share (Volume Sentiment: Sellers, 2.33:1) price levels, with resistance at the $594.76 (Volume Sentiment: Buyers, 1.59:1), $597.90 (Volume Sentiment: Sellers, 1.45:1), $599.51 (Volume Sentiment: Sellers, 1.45:1) & $604.33/share (10 Day Moving Average, Volume Sentiment: Buyers, 1.78:1) price levels
IWM, the iShares Russell 2000 ETF sank -1.74% for the week, as small caps had the second worst week of the major indexes.
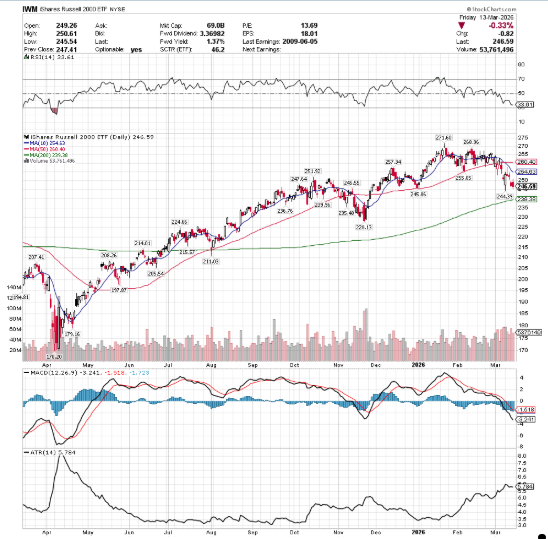
Their RSI is bearish at 33.61, while their MACD is continuing a bearish streak that began on January 27, 2026.
Volumes were +49.56% higher than the prior year’s average (57,218,000 vs. 38,256,360), as there was clearly a risk-off sentiment for the small cap index.
Monday was exactly like SPY & QQQ in that IWM opened lower, but managed to trudge higher throughout the session to form a bullish engulfing pattern on the highest volume of the week.
Tuesday opened lower than Monday’s closing price, ran higher to test the 10 DMA but was rejected & ultimately sank lower to close higher than its open, but signaling weakness.
Wednesday was similar, except the run up did not make it to test the 10 DMA, but ultimately straddled the lower Bollinger Band & closed above the opening price, but still down on the day.
Thursday the fun began, as the second highest volume session of the week resulted in a gap down that continued lower to close below the lower Bollinger Band.
Friday saw this trend continue, as IWM opened higher, but ultimately sank down to form a bearish engulfing pattern on the week’s third highest volume, indicating severe uncertainty heading into the weekend.
Much like SPY & QQQ, IWM’s week will be focused on whether or not the resistance of the 10 day moving average holds up or not.
Should it, expect further declines & a meeting with the 200 day moving average, but if it breaks out above expect a consolidation while the 20 DMA approaches the 10 DMA.
IWM has support at the $245.86 (Volume Sentiment: Buyers, 1.32:1), $244.39 (Volume Sentiment: Buyers, 1.32:1), $239.96 (Volume Sentiment: Buyers, 1.57:1) & $239.38/share (200 Day Moving Average, Volume Sentiment: Buyers, 1.57:1) price levels, with resistance at the $247.65 (Volume Sentiment: Buyers, 1.32:1), $251.92 (Volume Sentiment: Buyers, 4.67:1), $254.63 (10 Day Moving Average, Volume Sentiment: NULL, 0:0*) & $255.05/share (Volume Sentiment: NULL, 0:0*) price levels

DIA, the SPDR Dow Jones Industrial Average ETF declined -1.85%, as the blue chip index had the worst week of the major index ETFs.
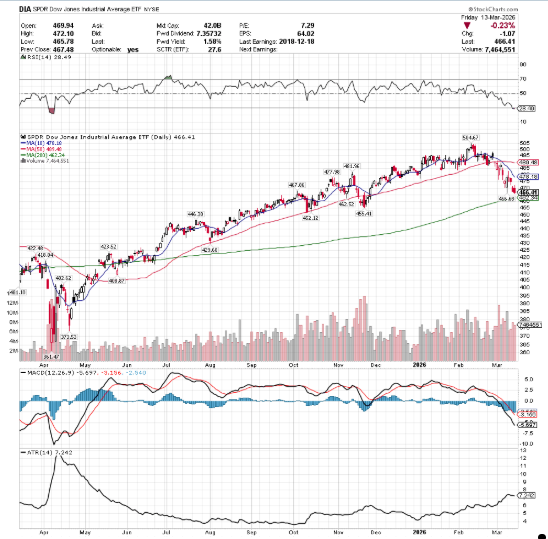
Their RSI is in oversold territory at 28.49, while their MACD is looking similar to IWM’s in terms of prolonged bearishness (minus 4 sessions in February 2026).
Volumes were +51.93% higher than the prior year’saverage (7,734,000 vs. 5,090,480), as the buy & hold blue chip index had market participants spooked.
DIA also started the week with a bullish engulfing pattern, which notably opened below the lower Bollinger Band, continued lower, before powering back higher to close in-line with it; not a great sentiment indicated.
Tuesday showed a gravestone high wave doji, signaling that the wheels were coming off of the truck.
Wednesday opened lower and continued so, but managed to close near the lower Bollinger Band after temporarily dipping beneath it.
Thursday opened on a gap lower & the second highest volume session of the week showed more selling and closed below the lower Bollinger Band.
Friday followed suit, opening slightly higher, only to sink back down to the lower Bollinger Band on the week’s third highest volume.
Heading into the new week, reference the data below with a keen eye on the 10 DMA to see if there’s a breakout to the upside.
DIA has support at the $462.52 (Volume Sentiment: Buyers, 7:1), $462.34 (200 Day Moving Average, Volume Sentiment: Buyers, 7:1), $455.41 (Volume Sentiment: Sellers, 10.73:1) & $452.12/share (Volume Sentiment: Sellers, 10.73:1) price levels, with resistance at the $466.68 (Volume Sentiment: Sellers, 1.17:1), $467.86 (Volume Sentiment: Sellers, 1.17:1), $477.98 (Volume Sentiment: Buyers, 0.8:0*) & $478.18/share (10 Day Moving Average, Volume Sentiment: Buyers, 0.8:0*) price levels
The Week Ahead
Monday the week begins with Empire State Manufacturing Survey data at 8:30 am, before Industrial Production & Capacity Utilization data comes out at 9:15 am.
Dollar Tree, KE Holdings & Science Applications announce earnings Monday morning before the opening bell, followed by Getty Images & Semtech after the closing bell.
Pneding Home Sales & Home Builder Confidence Index data comes out Tuesday at 10 am.
Tuesday morning features earnings reports from Academy SPorts + Outdoors, HUYA & Tencent Music, before Oklo, DocuSign, Kestra Medical Technologies, Lululemon athletica, Titan America & ZTO Express after the closing bell.
Wednesday delivers the highly anticipated Producer Price Index, Core PPI, PPI Year-over-Year & Core PPI Year-over-Year data at 8:30 am, followed by Factory Orders data at 10 am, the FOMC Interest-Rate Decision announcement at 2pm & Fed Chair Powell’s Press Conference at 2:30 pm.
Almonty Industries, General Mills, Hello Group, Jabil, Macy’s, Sail point, Weibo & Williams-Sonoma report earnings Wednesday before the session’s open, with Micron Technology, dLocal, Five Below & Heartflow reporting after the session’s closing bell.
Initial Jobless Claims & Philadelphia Fed Manufacturing Survey data come out Thursday at 8:30 am, before Wholesale Inventories & New Home Sales data at 10 am.
Thursday morning features earnings reports from Accelerant Holdings, Accenture, Alibaba, Arcos Dorados, Caleres, Canadian Solar, Darden Restaurants & Signet Jewelers with earnings from FedEx & Planet Labs after the closing bell.
Friday has no major economic data nor earnings reports scheduled for release.
See you back here next week!
*** I DO NOT OWN SHARES OR OPTIONS CONTRACT POSITIONS IN SPY, QQQ, IWM OR DIA AT THE TIME OF PUBLISHING THIS ARTICLE ***