SPY, the SPDR S&P 500 ETF fell -1.46% last week, having the second best week of the major indexes behind the NASDAQ 100 (QQQ).
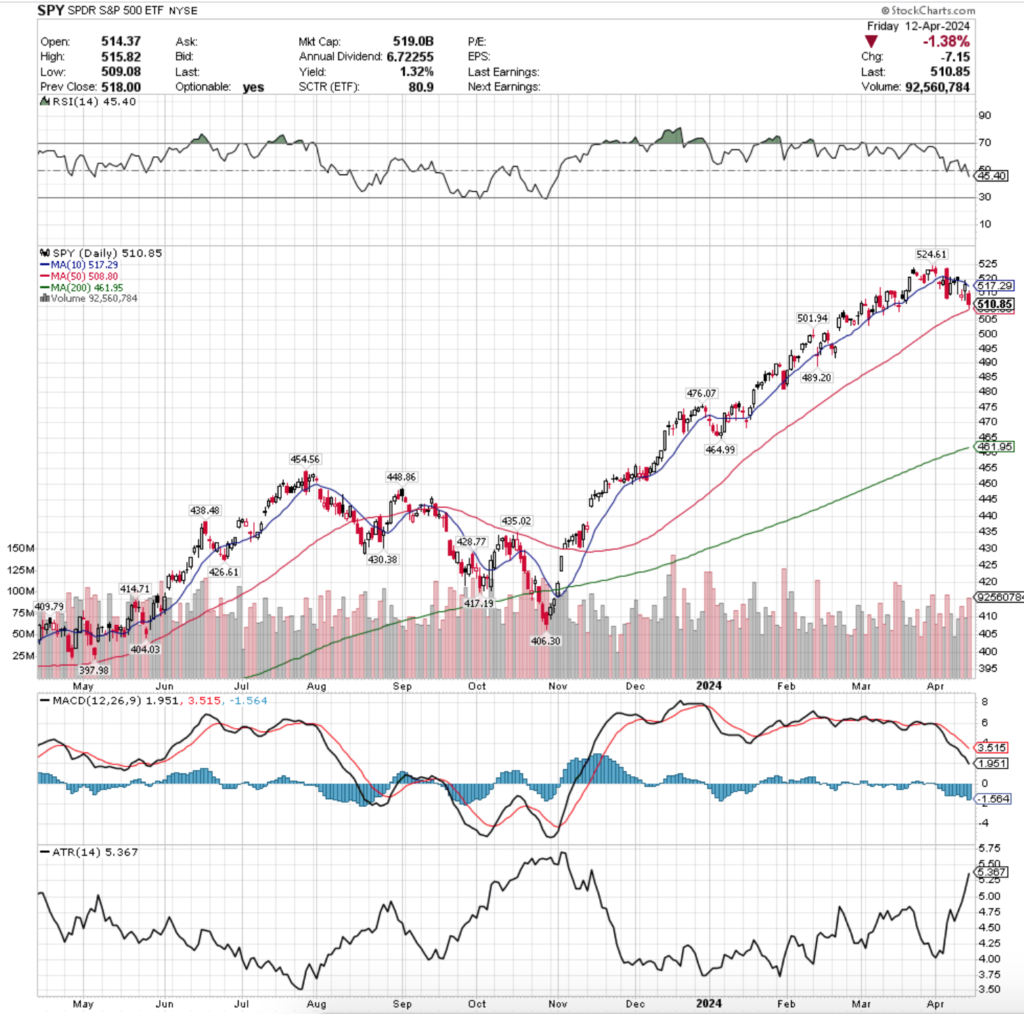
Their RSI is currently in a downtrend just beneath the neutral mark of 50 (currently at 45.4), while their MACD is also in a bearish decline following the recent consolidation during the month of April.
Volumes were -6.99% below average last week compared to the year prior (72,349,420 vs. 77,787,156), mostly due to Monday’s very low volume session, with the highest volumes of the week coming on Friday’s risk-off into the weekend play.
Monday began the week on a very low volume note & ultimately signaled uncertainty among market participants, as the session closed with a spinning top candle.
The session’s high was able to test the resistance of the 10 day moving average overhead, but ultimately the session closed lower than it opened, adding more fuel to the bearish fire.
That same sentiment carried into the rest of the week, as the ten day moving average became a solid resistance level & continued forcing prices lower as it began to sink as well.
Tuesday volumes began to perk up again, but the session itself still resulted in a candle that lacks confidence on the part of market participants.
The session opened on a gap up above the 10 day moving average, before testing lower almost to the level of the Friday prior’s open & ultimately settling right at the 10 DMA, but with a close that was lower than the open.
That certainly did not inspire confidence as the week continued on, leading to Wednesday’s gap down session that stuck with the theme of uncertainty, as the day resulted in a spinning top candle.
There was a glimmer of hope on Wednesday though, as the session despite declining did close higher than it opened, which provided some momentum for Thursday’s performance.
Thursday was the highest volume for an advancing day last week, but still was unable to outperform the volumes seen on either of the two declining days’ sessions.
The day resulted in a close that was just beneath the resistance of the 10 DMA, signaling that investors still generally believed in its strength, while also testing a lot of ground to the downside, as the candle’s shadow extended to about the low range of the session prior’s candle.
Friday saw the week come to a close on a bearish note, where the closing price sat just above the support of the 50 day moving average, while the top of the candle’s upper shadow was well beneath the 10 day moving average’s resistance.
Friday also was the highest volume session of the week, as market participants were eager to take their chips off of the table heading into the weekend in the wake of a week that showed the bears were coming out.
Much like the message of the last couple of weeks, this upcoming week will be largely dependent on the resilience of the support of the 50 day moving average, and the resistance of the 10 DMA.
SPY’s Average True Range has continued to climb, indicating an increase in volatility, which should be expected to continue as earnings season continues on & geo-political tensions continue to escalate.
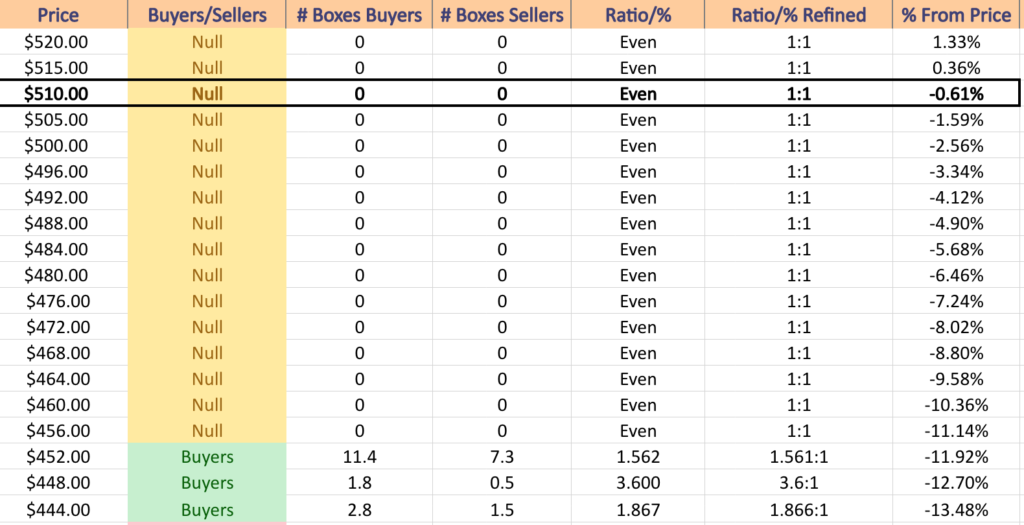
If volatility continues at these heightened levels & the 50 DMA’s support is broken, SPY only has 5 support levels in the next -10% from their current price, including the 200 day moving average which is continuing to move higher towards the price.
This will be something to keep an eye on if declines continue as there are not a lot of places for SPY to establish footing in the event of a slide.
SPY has support at the $508.80 (50 Day Moving Average, Volume Sentiment: NULL, 0:0*), $501.94 (Volume Sentiment: NULL, 0:0*), $489.20 (Volume Sentiment: NULL, 0:0*) & $476.07/share (Volume Sentiment: NULL, 0:0*) price levels, with resistance at the $517.29 (10 Day Moving Average, Volume Sentiment: NULL, 0:0*) & $524.61/share (All-Time High, Volume Sentiment: NULL, 0:0*) price levels.
QQQ, the Invesco QQQ Trust ETF that tracks the NASDAQ 100 performed the best of the major indexes last week, losing only -0.5%.
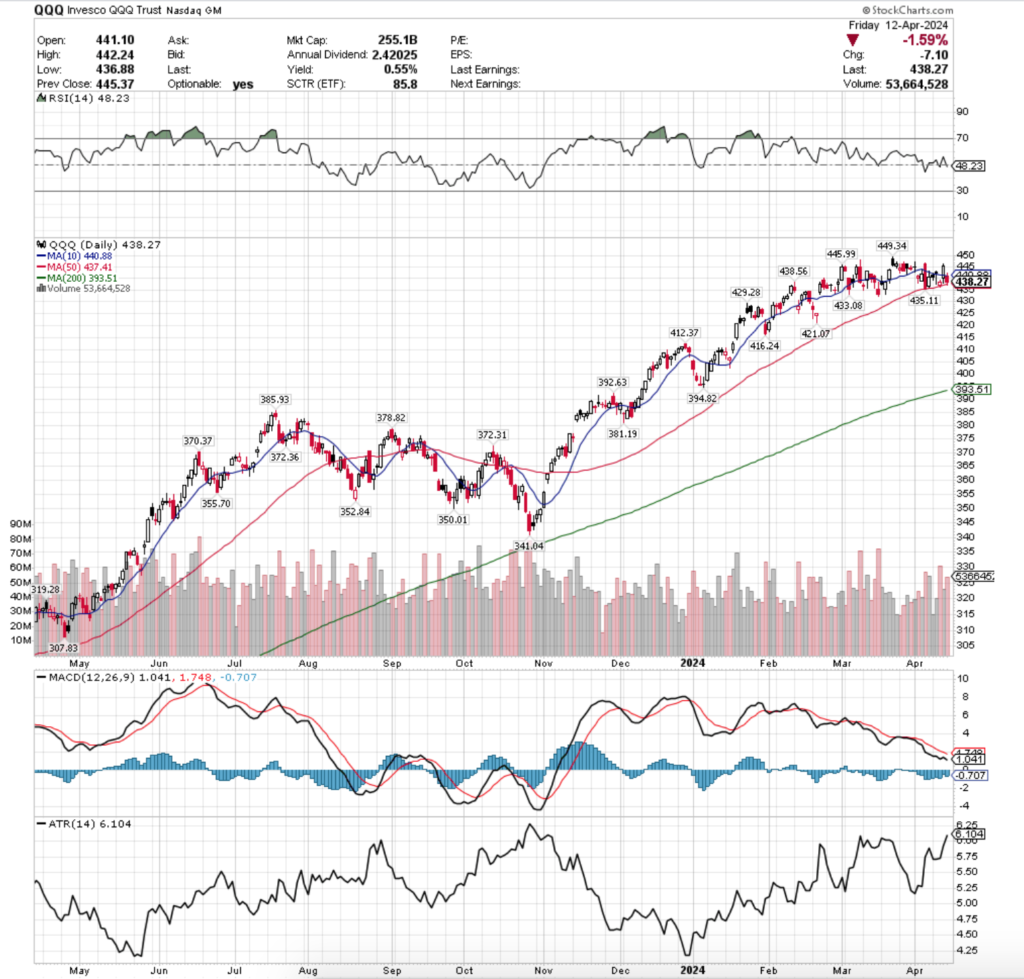
Their RSI is trending downward after recently crossing over the neutral 50-mark & currently sits at 48.23, while their MACD is also trending bearishly.
Volumes were -6.81% less than the prior year’s average (45,649,180 vs. 48,987,675), which much like SPY’s were attributed to low volumes on Monday’s session, as well as a low volume Tuesday as well.
The week kicked off on a very low volume session on Monday, where uncertainty & hesitance reigned supreme as the day closed in a spinning top candle that featured a lower close than opening price that was unable to break the resistance of the overhead 10 day moving average.
Tuesday also signaled hesitancy, as despite the gap up session that opened above the 10 DMA’s support, the close came in lower than the open, volumes were still relatively low & the candle’s lower shadow came near to testing the support of the 50 DMA.
Wednesday the bearish view was confirmed with a declining session that contained the week’s highest volume levels, as the session opened on the 50 day moving average, tested below it, but ultimately closed above the open.
The day’s range was narrow though & despite the close being higher than the open there was not much bullish activity in the day, as noted by the small upper shadow & the spinning top candle.
Thursday showed a glimmer of bullishness, with a gap higher than tested back down the the day prior’s price range before ultimately advancing & closing above the support of the 10 DMA.
Friday however showed the true feelings of market participants, as the day opened at the 10 DMA, tested just higher, before ultimately testing below the 50 DMA & closing just above its support.
Unlike SPY, QQQ has many more support levels in the near-term from where the price currently sits, as their ascent was not as steep as SPY’s.
Their Average True Range is also still climbing, showing an increase in volatility for QQQ.
Should volatility continue into this week (which it should), all eyes will be watching how the 50 DMA holds up as a support level & if it winds up becoming a resistance level & putting downwards pressure on QQQ’s price.
They look ready to cool down & consolidate for a little while, but when exactly hinges upon the strength of the 50 DMA’s support/resistance.
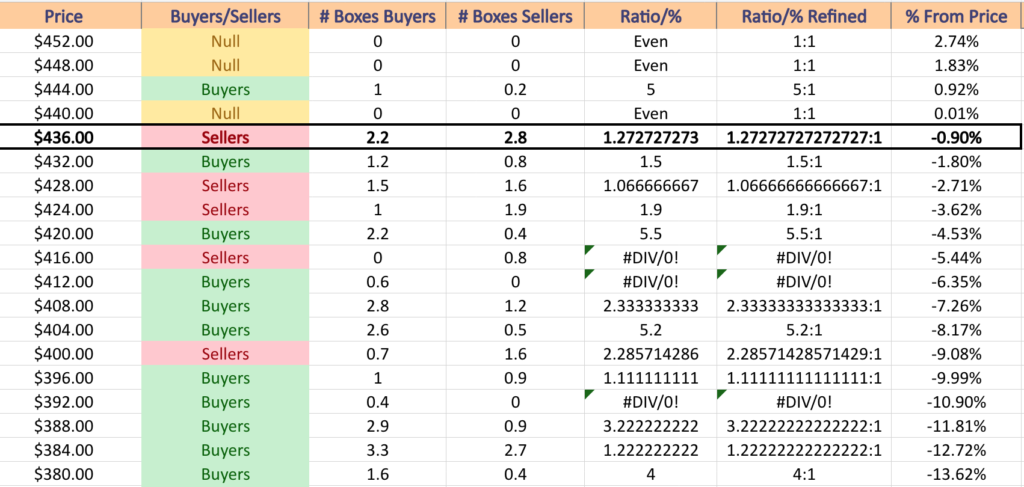
QQQ has support at the $437.41 (50 Day Moving Average, Volume Sentiment: Sellers, 1.27:1), $435.11 (Volume Sentiment: Buyers, 1.5:1), $433.08 (Volume Sentiment: Buyers, 1.5:1) & $429.28/share (Volume Sentiment: Sellers, 1.07:1) price levels, with resistance at the $438.56 (Volume Sentiment: Sellers, 1.27:1), $440.88 (10 Day Moving Average, Volume Sentiment: NULL, 0:0*), $445.99 (Volume Sentiment: Buyers, 5:1) & $449.34/share (All Time High, Volume Sentiment: NULL, 0:0*) price levels.
IWM, the iShares Russell 2000 ETF declined -2.82% last week, as market participants were eager to flee from small cap names.
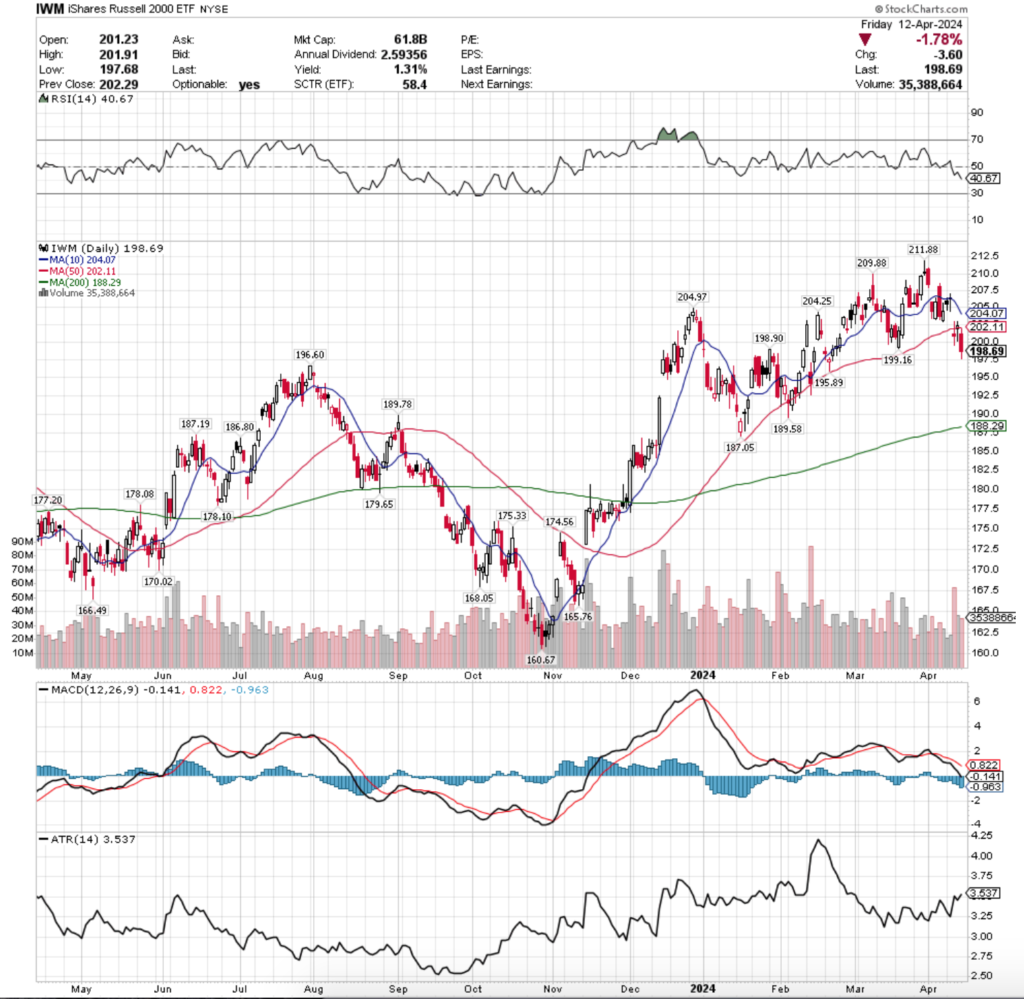
Their RSI is trending towards oversold levels & sits currently at 40.67, while their MACD is in bearish decline.
Volumes were+1.07% above average compared to the year prior (34,868,760 vs. 34,500,618), which confirms that market participants had reached a point where they wanted to take some risk off of the table & pocket some of their profits from the past six months.
IWM’s week began in a similar manner as SPY & QQQ’s in terms of a spinning top candle on low volume, followed by another test of the 10 DMA on Tuesday, although IWM closed Tuesday with a dragonfly doji candle, which can often point to an impending reversal.
While Tuesday morning & afternoon found price equilibrium for IWM, it all evaporated on Wednesday, as a wide gap down occurred to put IWM below the resistance of the 50 DMA.
Wednesday echoed the bearish & uncertainty tone as well, as the day was the largest volume session of the week for IWM, they closed in a spinning top that was bearish, and on a high wave candle.
A high wave candle is a candle where the upper & lower shadows are both very long in relation to the (usually) spinning top real body & it indicates a lot of rapid motion & volatility, as well as a bit of uncertainty with the current trend’s direction.
Thursday showed a glimmer of hope for bulls, as the day’s high aligned with Wednesday’s high, while its low point was higher, but the spinning top resting right on the 50 DMA’s support was enough to keep most folks skeptical about the strength of the session (although it did have the second highest volume of the week).
Friday confirmed that the bullish sentiment would be short lived, as the day opened, pushed higher but could not overtake the 50 DMA’s resistance level & as a result sent the price of IWM into freefall during the day, resulting in a -1.78% decline.
Due to the nature of how IWM’s price tends to oscillate vs. the high velocity day-over-day gains of SPY, they do have more local support options nearby, but unlike SPY & QQQ, IWM is already beneath its 10 & 50 DMA’s, meaning that the two price levels are actively pushing down against IWM’s share price & applying pressure to push them lower.
IWM’s Average True Range has perked up, signaling an increase in volatility & should continue higher in the coming week.
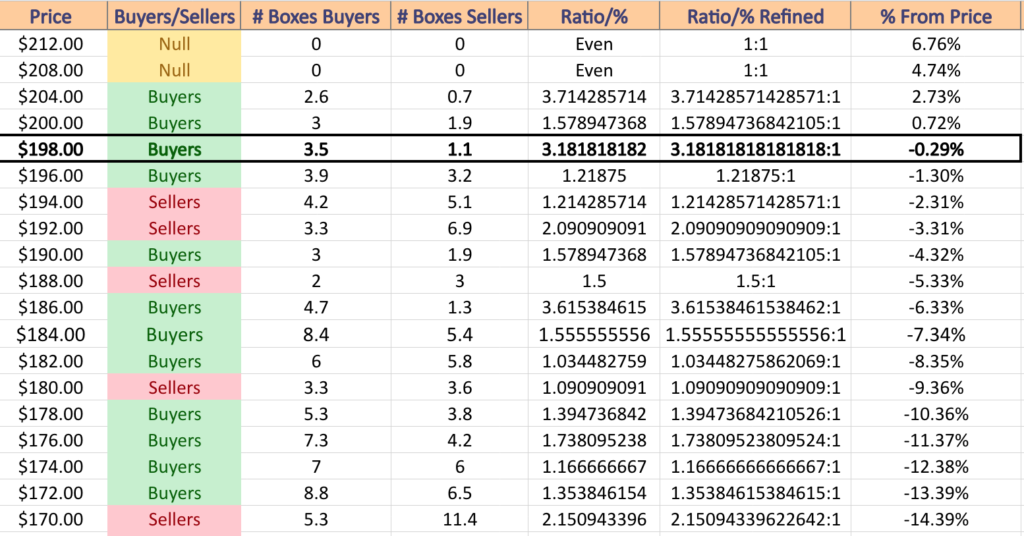
IWM has support at the $196.60 (Volume Sentiment: Buyers, 1.22:1), $195.89 (Volume Sentiment: Sellers, 1.21:1), $189.78 (Volume Sentiment: Sellers, 1.5:1) & $189.58/share (Volume Sentiment: Sellers, 1.5:1) price levels, with resistance at the $198.90 (Volume Sentiment: Buyers, 3.18:1), $202.11 (50 Day Moving Average, Volume Sentiment: Buyers, 1.58:1), $204.07 (10 Day Moving Average, Volume Sentiment: Buyers, 3.71:1) & $204.25/share (Volume Sentiment: Buyers, 3.71:1) price levels.
DIA, the SPDR Dow Jones Industrial Average ETF dropped -2.31% last week, as market participants were quick to exit the pool when it came to the big cap & name stocks.
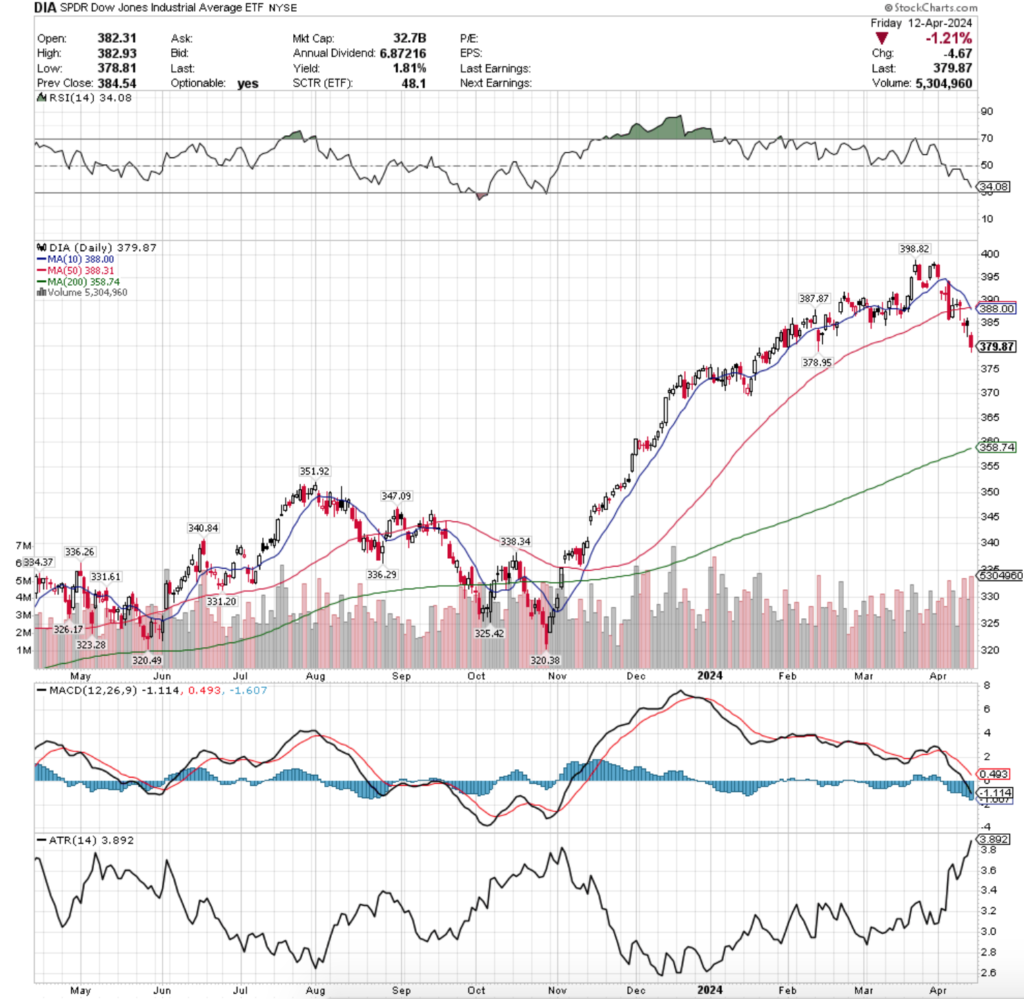
Their RSI is trending towards oversold levels & currently sits at 34.08, while their MACD is heavily bearish.
Volumes were +20.57% above average last week compared to the year prior (4,177,140 vs. 3,646,527), which is troubling given that the three highest volume sessions were all bearish & the lowest volume session was an advancing day, but on heavily muted volume.
Monday kicked the week off with a gravestone doji, which while it was an advancing day was on such low volume that it confirmed that it was going to lead to more bearish sentiment in the week.
Tuesday’s session tested beneath the support of the 50 DMA but managed to close above it in a spinning top candle, indicating indecisiveness.
Wednesday showed a hard gap down on high volume, followed by Thursday temporarily rebounding, but also testing lower & higher than Wednesday & closing below where it opened for the day (bearish).
Friday set the stage for an interesting upcoming week, as in addition to the high volume -1.21% declining day, the 10 DMA bearishly crossed over the 50 DMA & will now be an area of focus for investors & traders as DIA begins to feel bearish pressure from above.
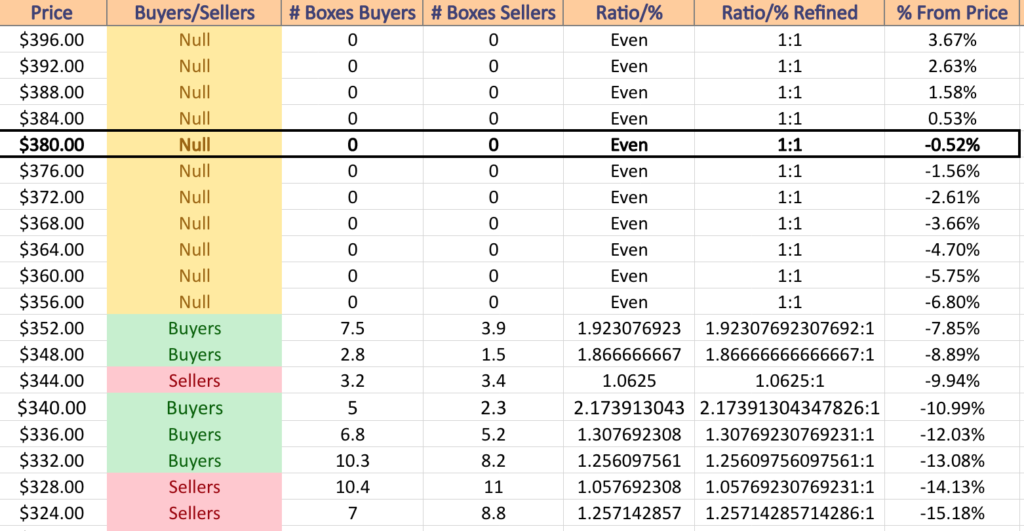
Much like SPY, DIA does not have much in terms of support nearby, with its next nearest level being within 1% of Friday’s closing price & the next level being the 200 DMA, which is currently -5.6% below the closing Friday price.
Their ATR has been rapidly advancing, and likely will continue into this week as more volatility looks set to be on the horizon, which will also be an important area to watch, as there is limited nearby support in the event of volatility ticking higher.
DIA has support at the $378.95 (Volume Sentiment: NULL, 0:0*), $358.74 (200 Day Moving Average, Volume Sentiment: NULL, 0:0*), $351.92 (Volume Sentiment: Buyers, 1.87:1) & $347.09/share (Volume Sentiment: Sellers, 1.06:1) price levels, with resistance at the $387.87 (Volume Sentiment: NULL, 0:0*), $388.00 (10 Day Moving Average, Volume Sentiment: NULL, 0:0*), $388.31 (50 Day Moving Average, Volume Sentiment: NULL, 0:0*) & $398.82/share (All-Time High, Volume Sentiment: NULL, 0:0*) price levels.
The Week Ahead
Monday kicks off early this week, with Dallas Fed President Logan speaking in Tokyo on Monday morning at 2:30 am, followed by the Empire State Manufacturing Survey, U.S. Retail Sales & Retail Sales minus Autos at 8:30 am, Business Inventories & Home Builder Confidence Index data at 10 am & San Francisco Fed President Daly speaking at 8pm.
Charles Schwab, Goldman Sachs & M&T Bank are all scheduled to report earnings before the opening bell on Monday.
Housing Starts & Building Permits data is released Tuesday morning at 8:30 am, followed by Industrial Production & Capacity Utilization data at 9:15 am.
Tuesday earnings season heats up, with United Health, Bank of America, BNY Mellon, Commerce Bancshares, Johnson & Johnson, Morgan Stanley, Northern Trust & PNC all reporting earnings before the opening bell & Fulton Financial, Hancock Whitney, Interactive Brokers, J.B. Hunt Transport, Omnicom & United Airlines reporting earnings after the closing bell.
Wednesday is relatively quiet, with the Fed’s Beige Book data released at 2pm & Cleveland Fed President Mester speaking at 5:30 pm.
Abbott Laboratories, ASML, Citizens Financial Group, First Horizon, Prologis, Travelers Companies & U.S. Bancorp all report earnings before the market opens on Wednesday morning, followed by Alcoa, Bank OZK, Brandywine Realty, Crown Castle, CSX, Discover Financial Services, Equifax, F.N.B. Corp, First Industrial Realty, Kinder Morgan, Las Vegas Sands, Rexford Industrial Realty, SL Green Realty, Synovus & Wintrust Financial after the closing bell.
Initial Jobless Claims & Philadelphia Fed Manufacturing Survey data are released Tuesday at 8:30 am, followed by New York Fed President Williams speaking at 9:15 am, Existing Home Sales & U.S. Leading Economic Indicators data at 10 am, Atlanta Fed President Bostic speaking at 11 am & again at 5:45 pm.
Thursday morning’s earnings reports feature Alaska Air, Ally Financial, Apogee Enterprises, Badger Meter, Blackstone, Comerica, D.R. Horton, Genuine Parts, Home Bancshares, Iridium Communications, KeyCorp, Manpower, Marsh & McLennan, Snap-On & Texas Capital, with Netflix, Glacier Bancorp, PPG Industries & Western Alliance Bancorp all scheduled to report after the closing bell.
Friday ends the week on a quieter note, with Chicago Fed President Goolsbee speaking at 10:30 am.
Proctor & Gamble, American Express, Fifth Third Bancorp, Huntington Bancshares, Regions Financial & SLB are all due to report earnings before the opening bell of Friday’s session.
See you back here next week!
*** I DO NOT OWN SHARES OR OPTIONS CONTRACT POSITIONS IN SPY, QQQ, IWM or DIA AT THE TIME OF PUBLISHING THIS ARTICLE ***