SPY, the SPDR S&P 500 ETF lost -0.05% this past week, faring the best of the indexes that we review here this week, as investors sought safety in larger cap names.
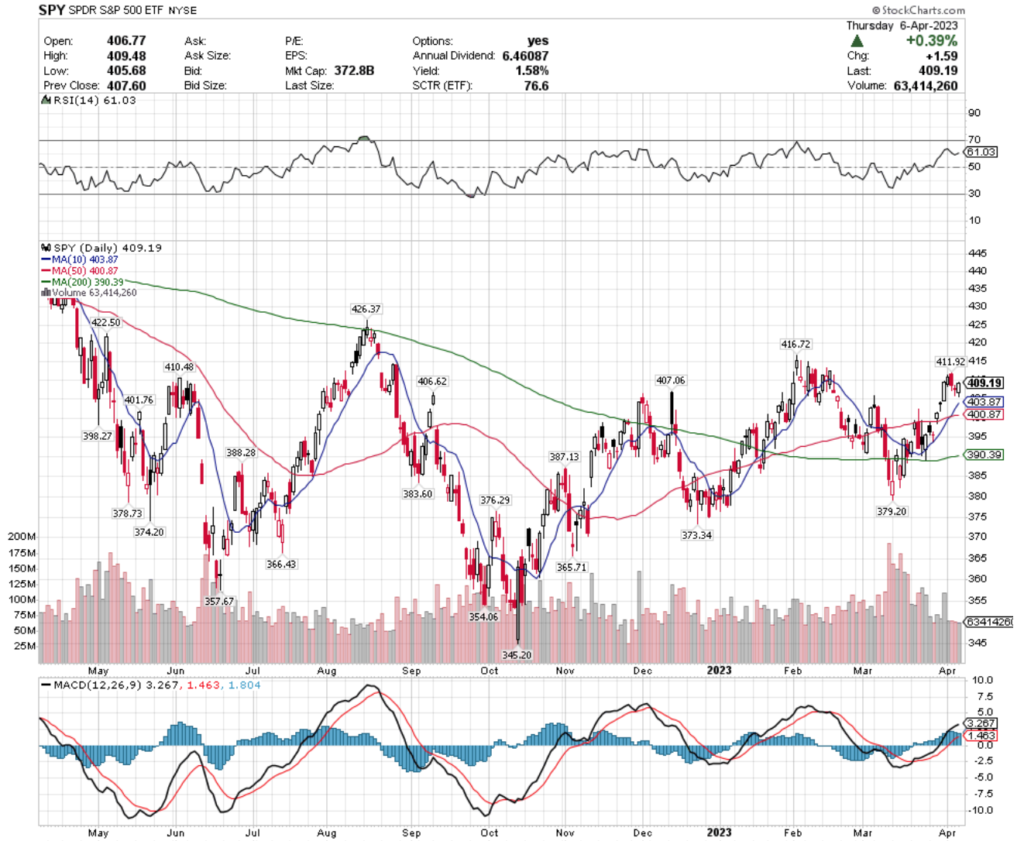
Their RSI & MACD are beginning to show more signs of weakness compared to last week & this past week’s trading volumes subsided, signaling less confidence than last week’s jumpy but bullish week.
SPY has support at the $407.06, $406.62 & $403.87/share (10 day moving average) price levels, with resistance overhead at the $410.48, $411.92 & $416.72/share price levels.
QQQ, the Invesco QQQ Trust ETF dropped -0.9% last week; trailing the S&P 500, but being preferred over the Russell 2000 small cap names.
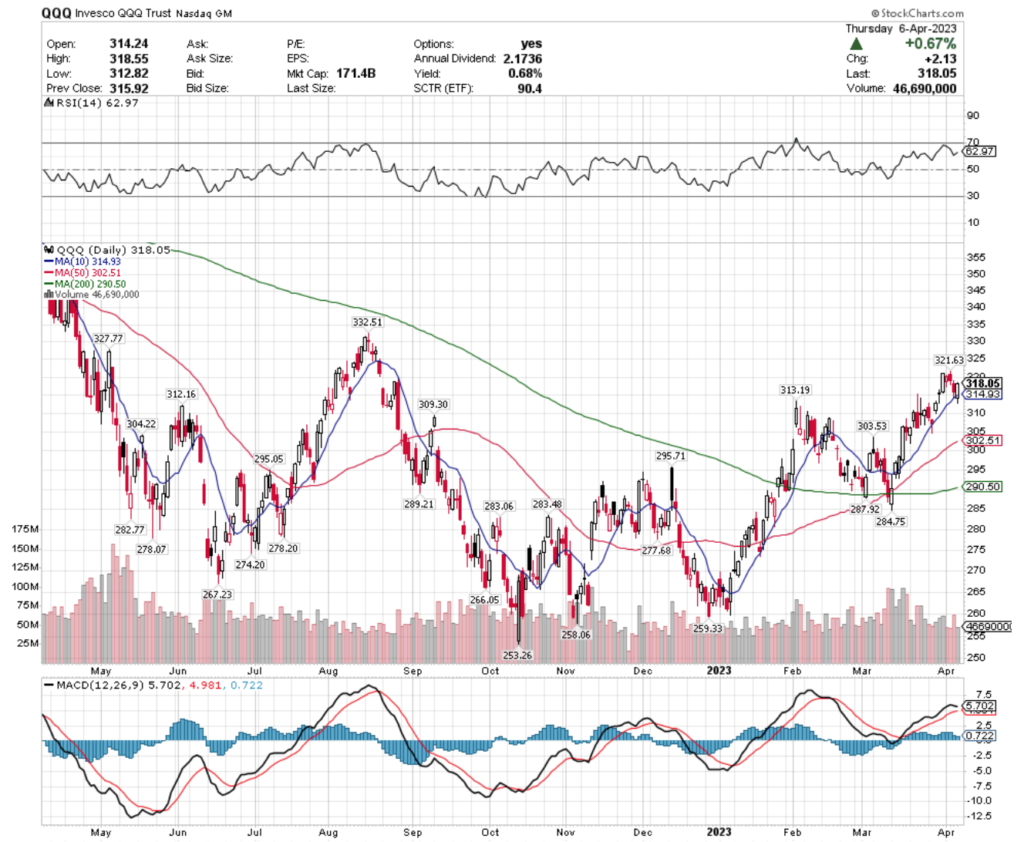
Their RSI is slightly more overbought than SPY’s & their MACD is beginning to curl over bearishly, with relatively average volume to confirm the sentiment.
QQQ has support at the $314.93 (10 day moving average), $313.19 & $312.16/share price levels, making for a decent zone before the next level at $309.30 & they have resistance at the $321.63, $327.77 & $332.51/share price levels.
IWM, the iShares Russell 2000 ETF lost -2.53% over the past week, as investors looked to flee smaller cap names & many pivoted into large cap, safer stocks.
Their RSI is below neutral trending towards oversold & their MACD is beginning to signal bearishness, after a month & change of above average trading volume to confirm sentiment.
IWM has support at the $172.67, $169.71 & $169.05/share price levels, with resistance at the $174.63, $174.93 (10 day moving average) & $175.13/share price levels.
Let’s dive into some of the best & worst performing sectors & geo-locations based on this week’s technical ratings data!
Euro STOXX 50 (FEZ), Argentina (ARGT), Aerospace & Defense (DFEN) & Fundamental International Large Companies (FNDF) Are All Bullishly Leading The Market
FEZ, the SPDR EURO STOXX 50 ETF has gained +16.81% over the past year, rebounding +50.02% from their 52 week low on 10/13/2022 (ex-distributions).
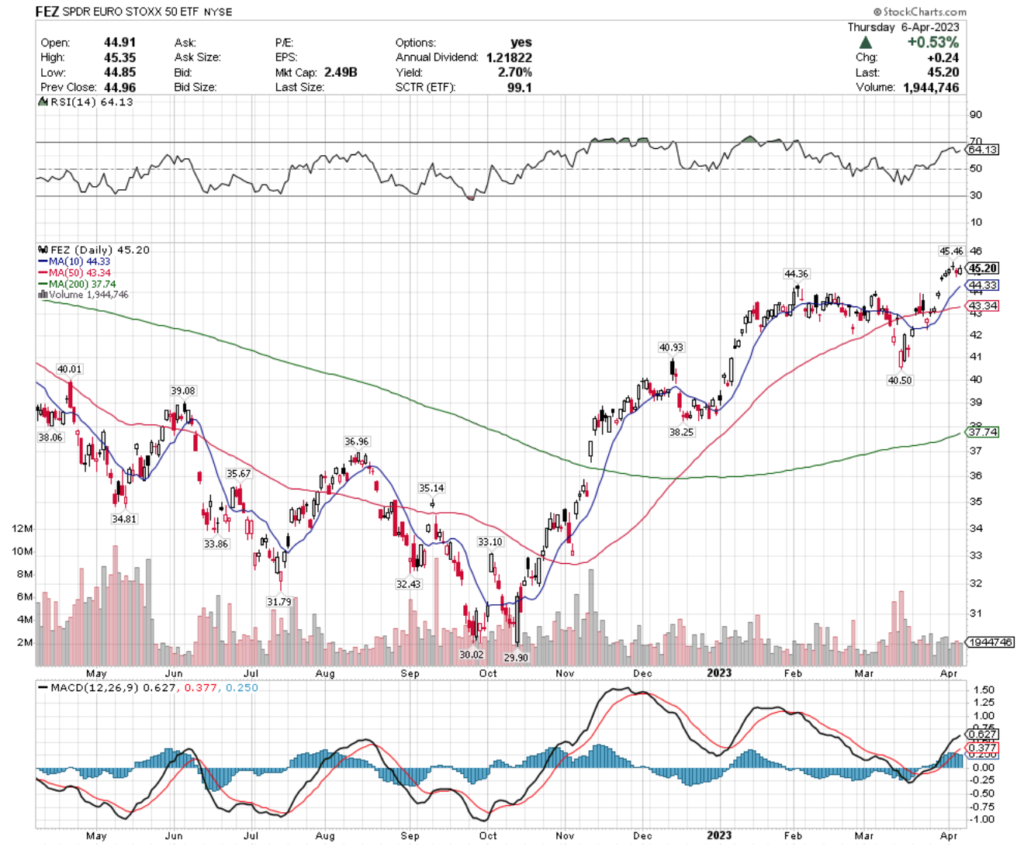
Their RSI is approaching overbought conditions at 64 & their MACD is beginning to show signs of weakness, as they’ve consolidated after a gap up 2 weeks ago.
Recent volumes have been below average compared to the year prior & their most recent candlestick configuration is signaling to proceed with caution in the near-term.
While their distribution yield provides a 2.7% cushion to long-term holders, unless employing an options strategy for protection, it would be wise to wait & see how they behave around their recent support levels before entering or adding to a position.
FEZ has support at the $44.36, $44.33 (10 day moving average) & $43.34/share price levels, which all appear below the aforementioned gap, with the only overhead resistance from the past 52 weeks occurring at the $45.46/share price level.
ARGT, the Global X MSCI Argentina ETF has climbed +10.91% over the past year & has grown +64.28% from their 52 week low on 7/14/2022 (ex-distributions).
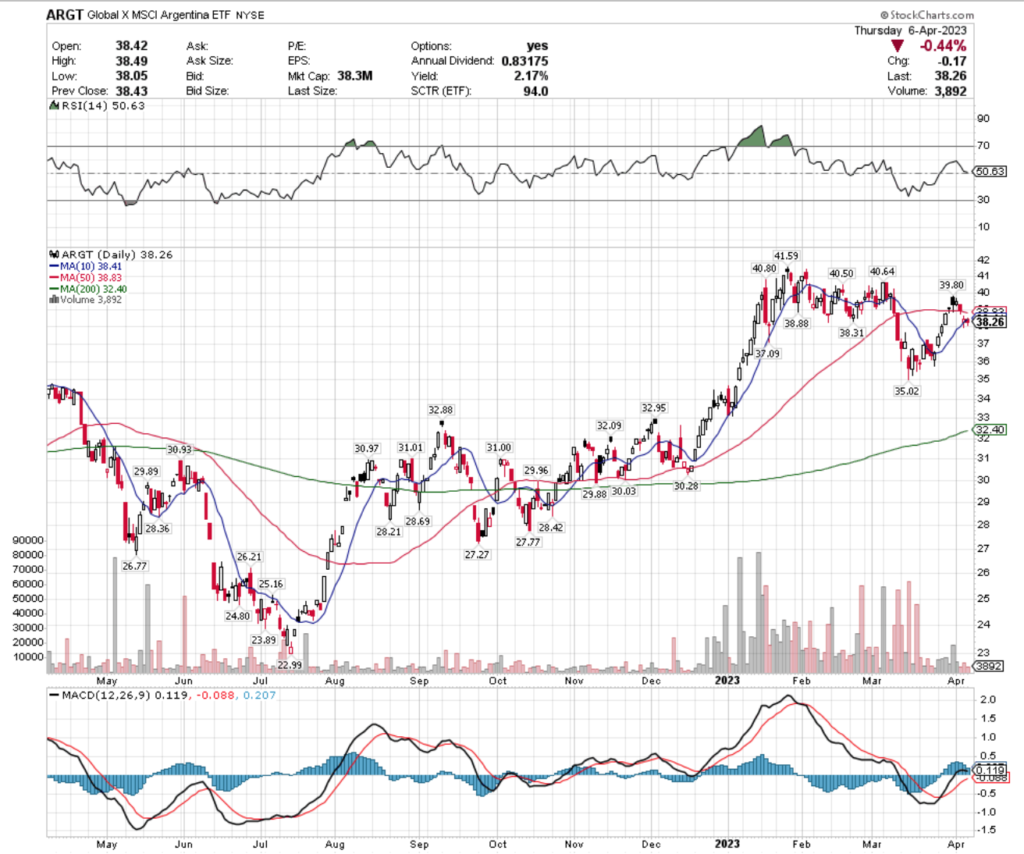
Their RSI is neutral at 50.63, with their MACD signaling a near-term decline is on the horizon.
Recent trading volumes have been about average compared to the year prior, although their volume levels have been quite volatile over that time period & their Tuesday gap down has led to a range of uncertainty.
While they offer a 2.17% distribution yield for long-term holders annually, unless using a long/short strategy for protection against the downside, it looks best to wait to enter or add to a position until their price has further consolidated.
ARGT has support at the $37.09, $35.02 & $32.95/share price levels, with resistance at the $38.31, $38.41 (10 day moving average) & $38.83/share (50 day moving average) price levels.
DFEN, the Direxion Daily Aerospace & Defense Bull ETF has lost -9.56% over the past year, but has posted an impressive +80.04% comeback from their 52 week low on 9/29/2022 (ex-distributions).
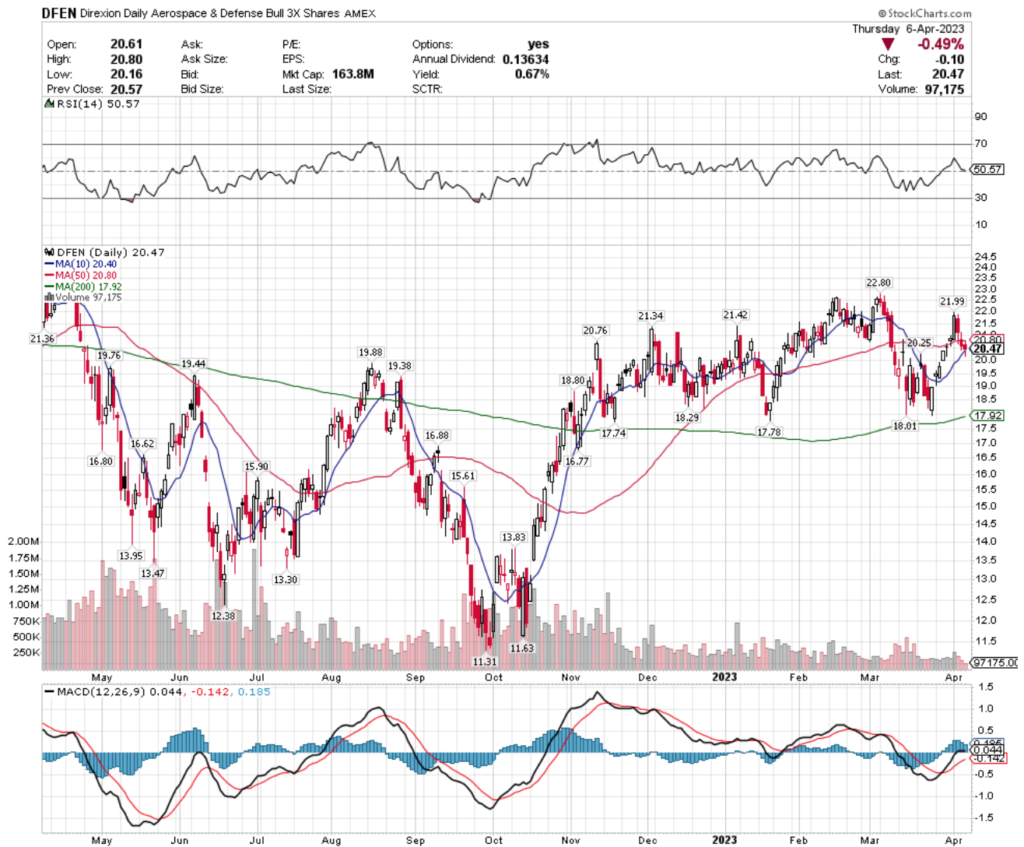
Like ARGT, DFEN also has a neutral RSI at 50.57 & a MACD signaling that there is a near-term price correction on the horizon.
With trading volumes for 2023 being very low compared to the year prior, there is still uncertainty among market participants as to the value of DFEN’s shares.
With a modest 0.67% distribution yield for long-term shareholders they are another name worth following to wait for a more opportune entry point for.
DFEN has support at the $20.40 (10 day moving average), $20.25, $19.88/share price levels, as they try to break out & above their $20.76, $20.80 (50 day moving average) & $21.34/share resistance levels.
FNDF, the Schwab Fundamental International Large Company Index ETF has gained +1.97% over the past year, with a 26.64% recovery since their 52 week low of 10/13/2022 (ex-distributions).
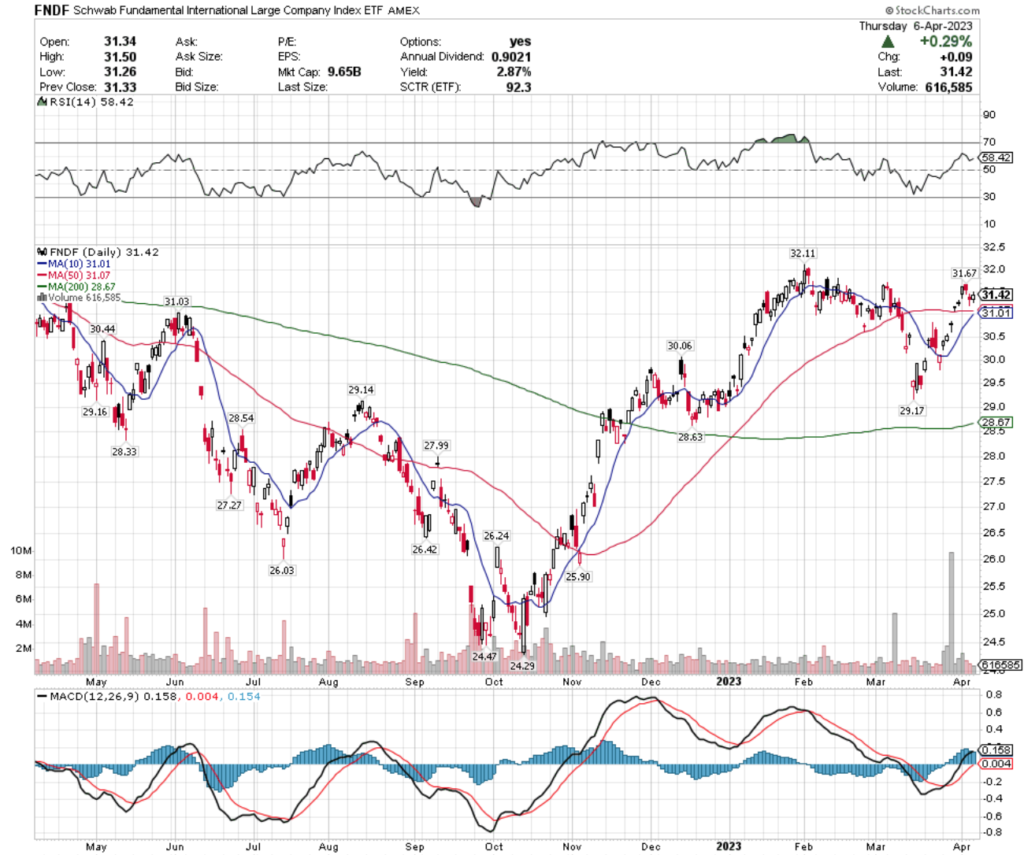
While their 10 & 50 day moving averages are primed to cross bullishly in the coming week, their MACD is signaling near-term losses & consolidation.
With an RSI approaching the overbought end of neutral & roughly average volume, minus one of the gap up days recently, there still looks to be uncertainty in the near-term & their past week’s candlesticks are not particularly appealing.
With only 2.87% of protection to the downside via distribution yields for long-term shareholders, this one is worth watching for a more favorable entry-point, with opportunities to build profits with a long/short strategy that can be applied to new shares in the future.
FNDF has support at the $31.07 (50 day moving average), $31.03 & $31.01 (10 day moving average) price levels, with resistance at the $31.67, $31.86 & $32.11/share price levels.
Uranium (URA), SuperDividends (FDIV), Retail (XRT) & Global Timber & Forestry (WOOD) Are All Bearishly Lagging The Market
URA, the Global X Uranium ETF has dropped -29.5% over the past year, losing -33.06% from their 52 week high in April of 2022, but have recovered +8.05% since their 52 week low on 7/6/2022 (ex-distributions).
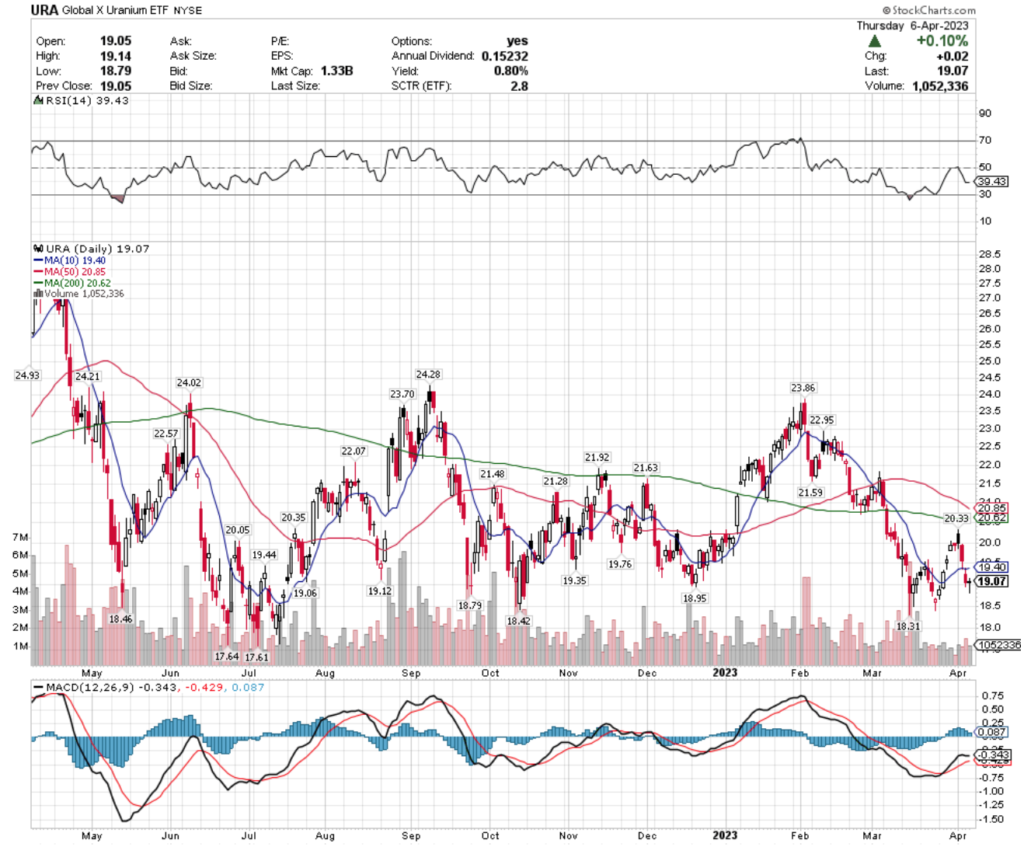
Their MACD is beginning to show bearish signals for the near-term, as their RSI enters into the oversold end of the neutral range at 39.43.
With lower than average recent trading volumes & the impending death cross of their 50 & 200 day moving averages, there appears to be more near-term pain in store for URA.
With only a 0.8% distribution yield annually for long-term holders, this will require a wait & see approach about an entry-point after observing how it behaves at support, but some insurance on the short side is worth looking into.
URA has support at the $19.06, $18.95 & $18.46/share price level, with resistance overhead at the $19.12, $19.35 & $19.40/share (10 day moving average) price levels.
SDIV, the Global X SuperDividend ETF has lost -6.14% over the past year, falling -7.04% from their 52 week high in April of 2022, but has gained +3.97% from their 52 week low on 10/21/2022 (ex-distributions).
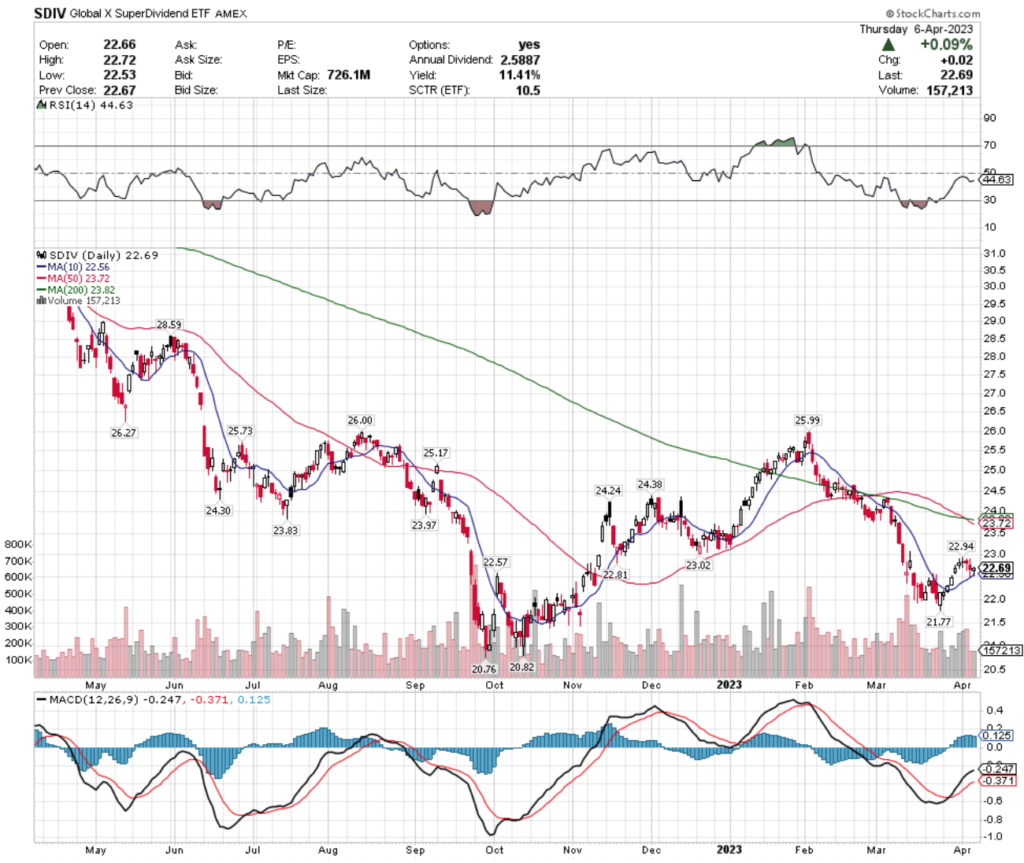
Recent trading volumes have been about average compared to the year prior & their RSI is neutral.
SDIV’s MACD is beginning to signal short-term weakness & their behavior at their 10 day moving average will be important to see how it holds up as a support level.
Despite having an 11.41% distribution yield for long-term holders, that only covers losses up to $20.10/share, which based on the last 52 weeks of support points looks risky (current lowest is $20.76/share), making this name another to approach with caution or defensively.
SDIV has support at the $22.57, $22.56 (10 day moving average) & $21.77/share price levels, with resistance at the $22.81, $22.94 & $23.02/share price levels.
XRT, the SPDR S&P Retail ETF shed -16.06% over the past year, losing -22.41% from their 52 week high in April 2022, but has reclaimed +11.19% since their 52 week low of 9/30/2022 (ex-distributions).
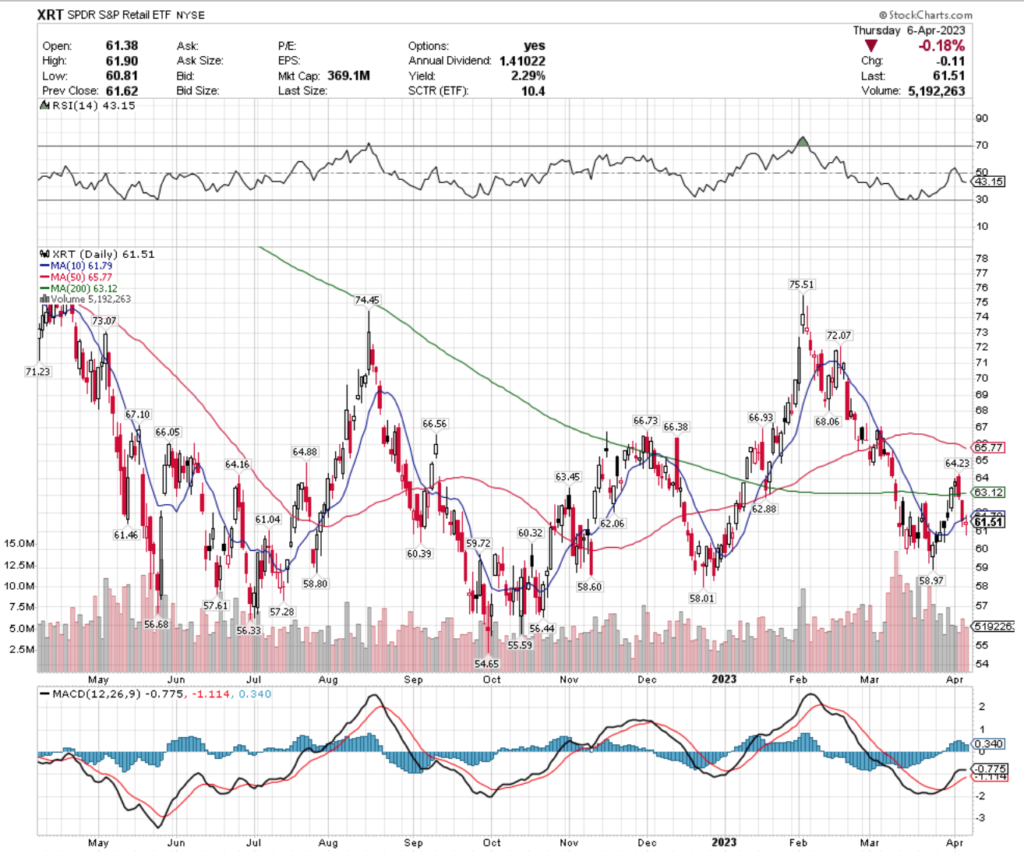
Recent trading volumes have been about average compared to the year prior, with their RSI trending bearishly & their MACD is looking to roll over bearishly in the coming trading sessions.
With a 2.29% distribution yield, there is limited downside protection making it risky to be eyeing an entry or consider adding to an existing position & it would be more prudent to wait & see how they interact with support levels, or play a long/short defensive play while waiting on their price to become less volatile.
XRT has support at the $61.46, $61.04 & $60.39/share price levels, with resistance at the $61.79. $62.06 & $62.88/share price levels.
WOOD, the iShares Global Timber & Forestry ETF has fallen -17.47% over the past year, losing -24.64% since their 52 week high in April 2022, but gaining +11.46% since their 52 week low on 9/26/2022 (ex-distributions).
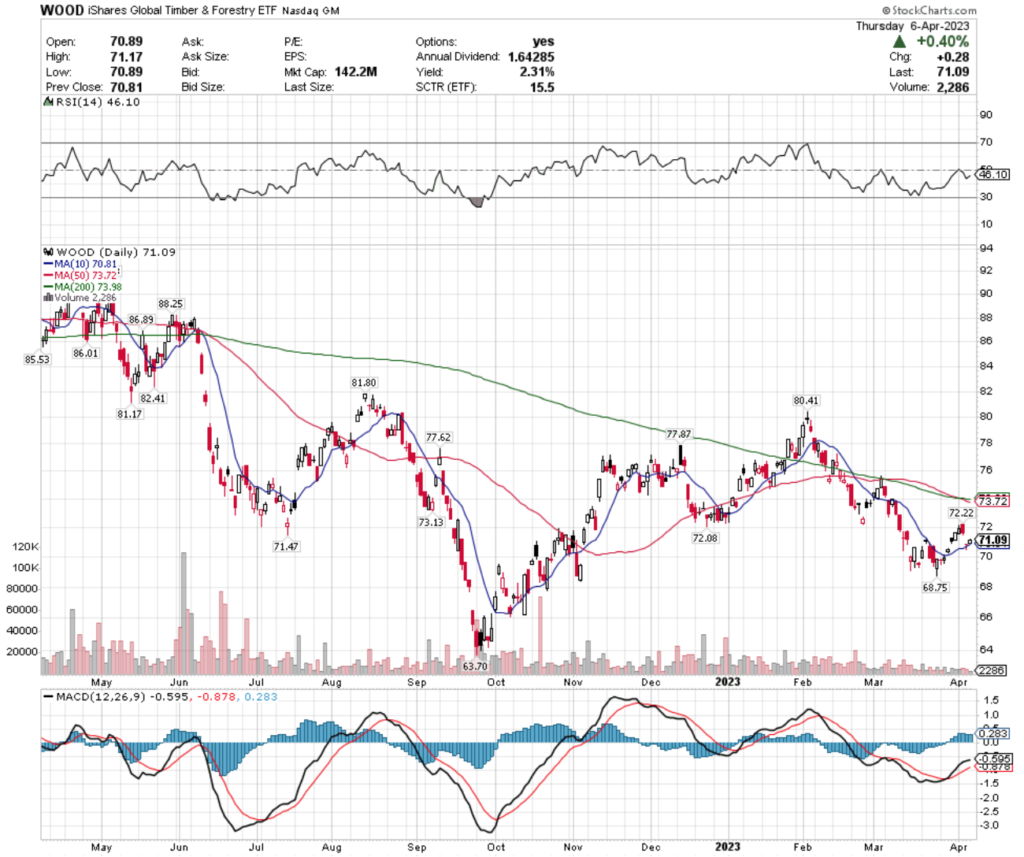
Trading volumes have been much lower than average compared to the year prior recently, after the death cross of the 50 & 200 day moving averages earlier in the week, showing traders aren’t sure of their proper valuation currently.
Their RSI & MACD appear ready to turn bearish, after Thursday’s +0.4% bounce helped keep them from falling more aggressively.
WOOD pays a 2.31% distribution yield to long-term holders, but that will not provide adequate protection against losses, making it advisable to watch how they interact with support levels & or play defensively while looking for an opportune entry point.
WOOD has support at the $70.81, $68.75 & $63.70/share price levels, with resistance overhead at the $71.47, $72.08 & $72.22/share price levels.
Tying It All Together
This upcoming week features many interesting bits of data being reported.
Monday we get Wholesale Inventories data at 10 am, with New York Fed President Williams speaking at 4:15 pm.
Tuesday at 6 am we get the NFIB Optimism Index, followed by Chicago Fed President Goolsbee speaking at 1:30 pm, Philadelphia Fed President Harker speaking at 6:30 pm & at 7:30 pm Minneapolis Fed President Kashkari speaks.
Wednesday will be the most eagerly anticipated day, with Consumer Price Index data, Core CPI, CPI Y-o-Y & Core CPI Y-o-Y all reported at 8:30 am, followed by Richmond Fed President Barkin speaking at 9:00 am, San Francisco Fed President Daly speaking at 12 pm & at 2 pm we get the Treasury Budget & FOMC minutes reported.
Thursday will also be important, with Producer Price Index, Core PPI, PPI Y-o-Y, Initial Jobless Claims & Continuing Jobless Claims all being reported at 8:30 am.
Friday will also be a busy day, with US Retail Sales, Retail Sales minus Autos, Import Price Index, & Import Prices minus Fuel being reported at 8:30 am
At 8:45 am Fed Governor Waller speaks, followed by Industrial Production & Capacity Utilization data at 9:15 am & Business Inventories & Consumer Sentiment reports out at 10 am.
It promises to be an interesting week ahead – see you back here next week!
*** I DO NOT OWN SHARES OR OPTIONS CONTRACT POSITIONS IN FEZ, ARGT, DFEN, FNDF, URA, SDIV, XRT or WOOD AT THE TIME OF PUBLISHING THIS ARTICLE ***