SPY, the SPDR S&P 500 ETF gained +0.33% over the past week, as S&P 500 stocks recovered from their early week losses over Thursday & Friday, led by NVIDIA’s strong earnings.
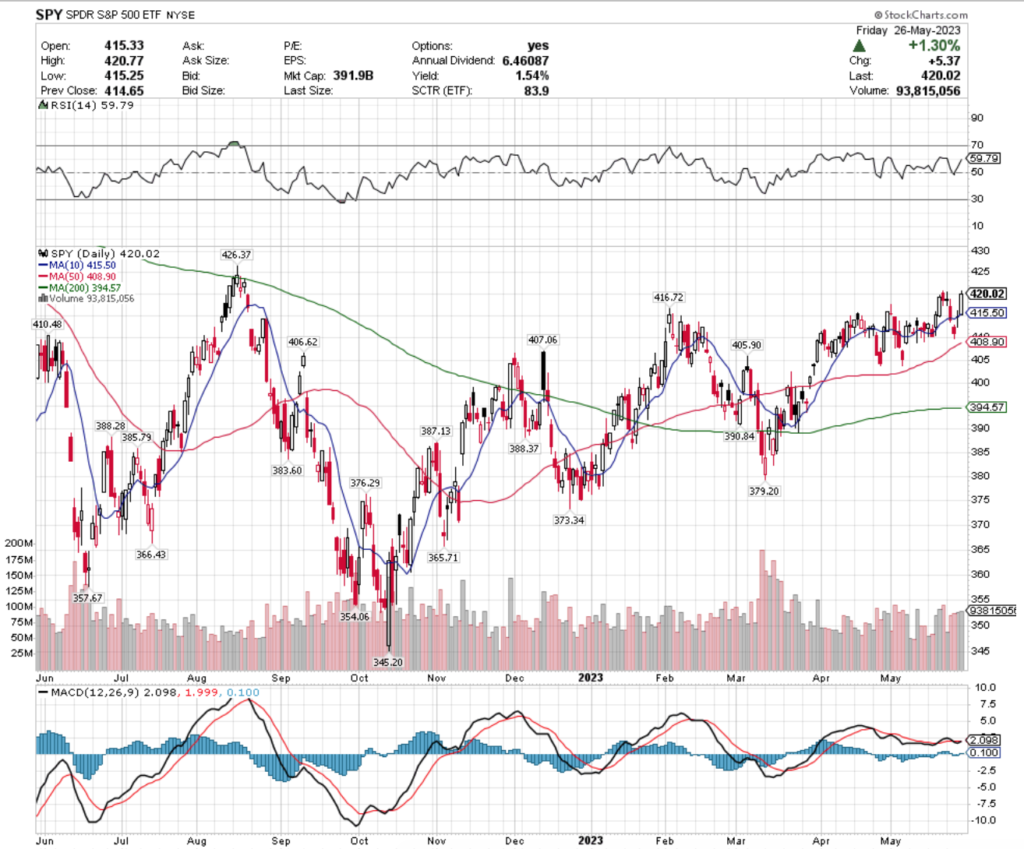
Their RSI is still on the overbought end of neutral at 59.79, with volumes being about average compared to the year prior.
Their MACD has been in limbo for the last few weeks while they’ve been relatively rangebound, as investors are still unsure about which direction the market is going to head in in the near-term.
SPY has support at the $416.72 (Volume Sentiment: Sellers, 1.33:1), $415.50 (10 day moving average, Volume Sentiment: Buyers 3:1), $410.48 (Volume Sentiment: Sellers, 1.57:1) & $408.90/share (50 day moving average, Volume Sentiment: Sellers, 1.57:1), with resistance at the $426.37 (Volume Sentiment: Sellers, 1.24:1), $438.53 (Volume Sentiment: Sellers, 1.32:1), $442.12 (Volume Sentiment: Sellers, 1.35:1)& $449.09/share (Volume Sentiment: Buyers, 1.89:1) price levels.
QQQ, the Invesco QQQ Trust ETF gained +3.53% over the past week, as investors favored Technology names after the NVDA earnings news, causing a gap up on Thursday’s session, after gapping done the session prior.
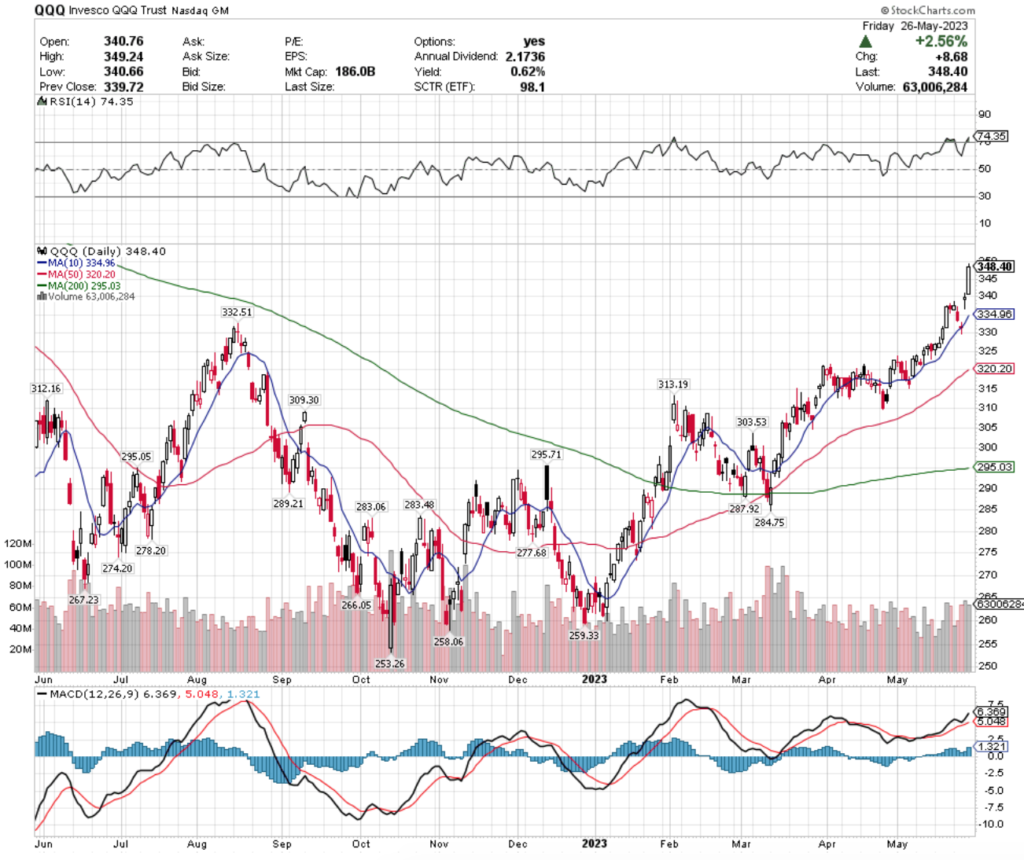
Volumes remained relatively average compared to the year prior, with their RSI being in overbought territory at 74.35.
Their MACD is bullish, with their 10 day moving average closing in on the price range that they ended the week prior in to act as support.
QQQ has support at the $334.96 (10 day moving average, Volume Sentiment: Sellers, 3.2:1), $332.51 (Volume Sentiment: Sellers, 3.2:1), $320.20 (Volume Sentiment: Sellers, 2:1) & $313.19/share (Volume Sentiment: Sellers, 3.64:1) price levels, with resistance overhead at the $368.99 (Volume Sentiment: Buyers, 0.75:0*), $375.07 (Volume Sentiment: Sellers, 1:0*), $378.49 (Volume Sentiment: Buyers, 1.33:1) & $401.00/share (Volume Sentiment: NULL, 0:0*)
IWM, the iShares Russell 2000 ETF gained +0.02% over the past week, finishing just above where it closed on last Friday.
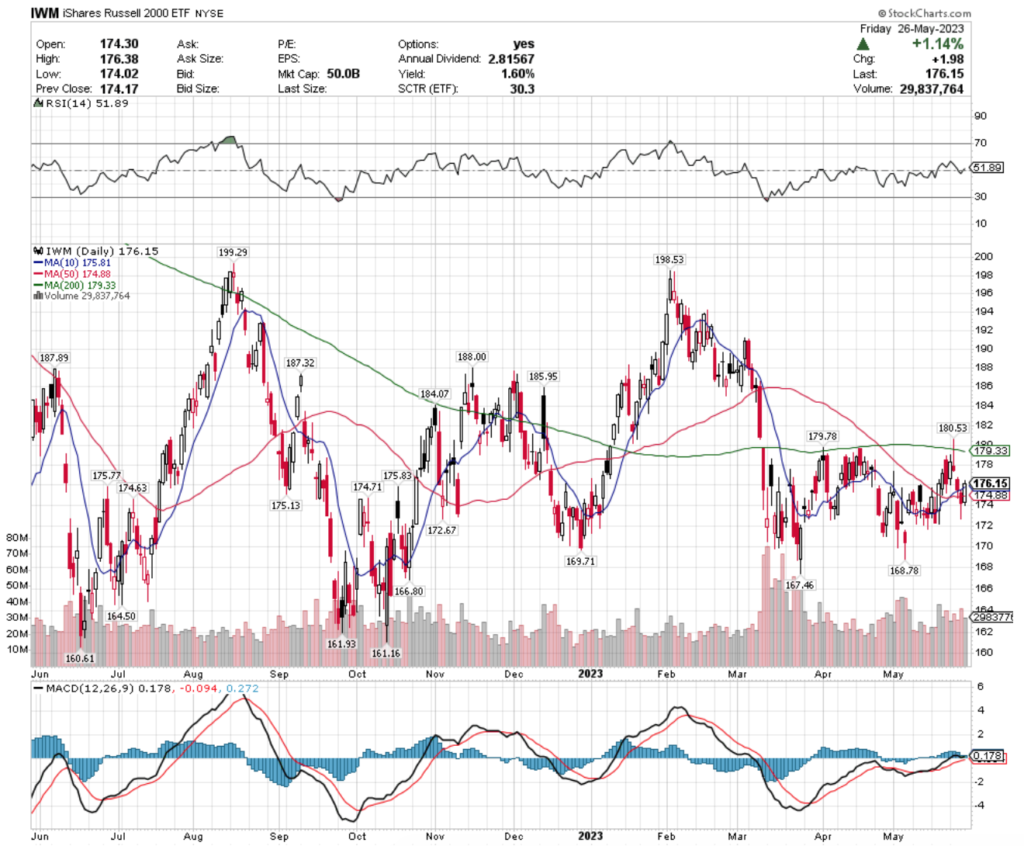
Their RSI is neutral at 51.89, with volumes increasing week-over-week to be above average compared to the year prior.
Their MACD looks set to cross over bearishly in the coming days & their 10 & 50 day moving averages are both within Friday’s session’s candlestick.
IWM has support at the $175.83 (Volume Sentiment: Buyers, 1.45:1), $175.81 (10 day moving average; Volume Sentiment: Buyers, 1.45:1), $175.77 (Volume Sentiment: Buyers, 1.45:1) & $175.13/share (Volume Sentiment: Buyers, 1.45:1) price levels, with resistance at the $179.33 (200 day moving average, Volume Sentiment: Buyers, 1.84:1), $179.78 (Volume Sentiment: Buyers, 1.84:1), $180.53 (Volume Sentiment: Sellers, 1.09:1) & $184.07/share (Volume Sentiment: Buyers, 1.75:1) price levels.
Let’s dive into some of the best & worst performing market sectors, industries & geo-locations in this week’s technical analysis rating review!
NASDAQ Technology Dividend (TDIV), Japanese Hedged Equities (DXJ), Emerging Market Dividend (EDIV) & Autonomous & Electric Vehicles (DRIV) Are All Bullishly Leading The Market
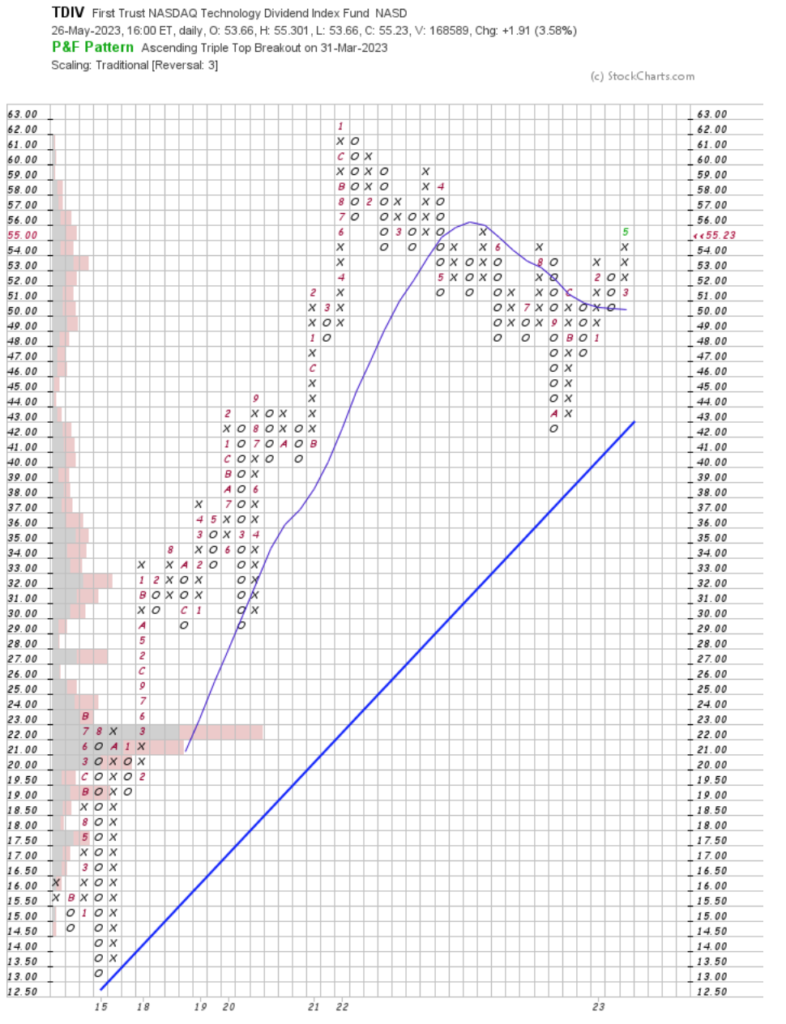
TDIV, the First Trust NASDAQ Technology Dividend Fund has gained +0.59% over the past year, with a +32.73% rebound after their 52-week low in September of 2022 (ex-distributions).
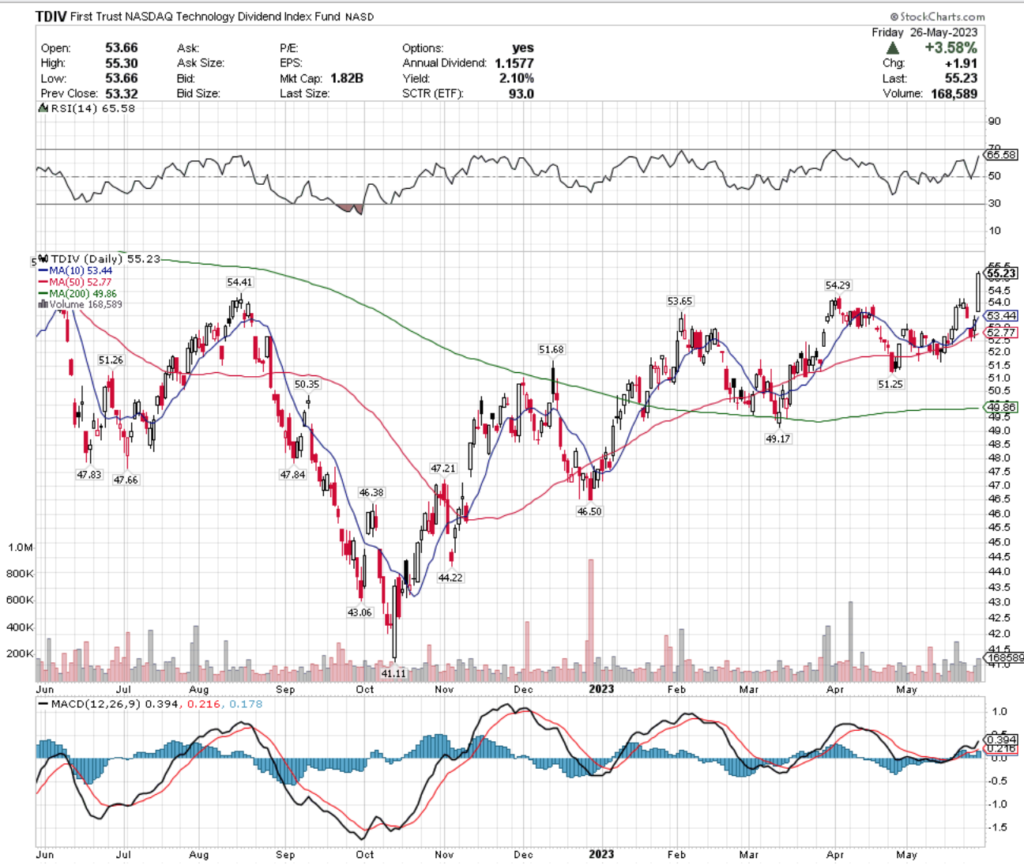
Their RSI is approaching overbought territory at 65.58, on about average volume compared to the year prior.
Their MACD is bullishly climbing, with Friday’s gap up adding strength to its bullish curve.
Given market volatility & that they’re approaching their 52-week high level, investors would be smart to watch how they behave around their resistance & support levels, while eyeing where to enter a position once volatility has cooled down.
In the meantime, a protective options strategy would be beneficial, as their 2.10% distribution yield for long-term holders does not protect against much in the event of price consolidation.
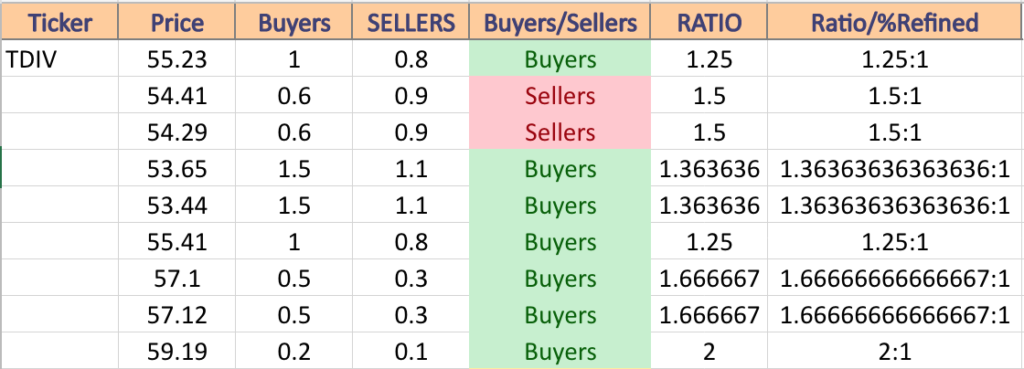
TDIV has support at the $54.41 (Volume Sentiment: Sellers, 1.5:1), $54.29 (Volume Sentiment: Sellers, 1.5:1), $53.65 (Volume Sentiment: Buyers, 1.36:1) & $53.44/share (10 day moving average; Volume Sentiment: Buyers, 1.36:1) price levels, with resistance at the $55.41 (Volume Sentiment: Buyers, 1.25:1), $57.10 (Volume Sentiment: Buyers, 1.67:1), $57.12 (Volume Sentiment: Buyers, 1.67:1) & $59.19/share (Volume Sentiment: Buyers, 2:1) price levels.
DXJ, the WisdomTree Japan Hedged Equity Fund has gained +24.44% over the past year, climbing +25.55% since their 52-week low in July of 2022 (ex-distributions).
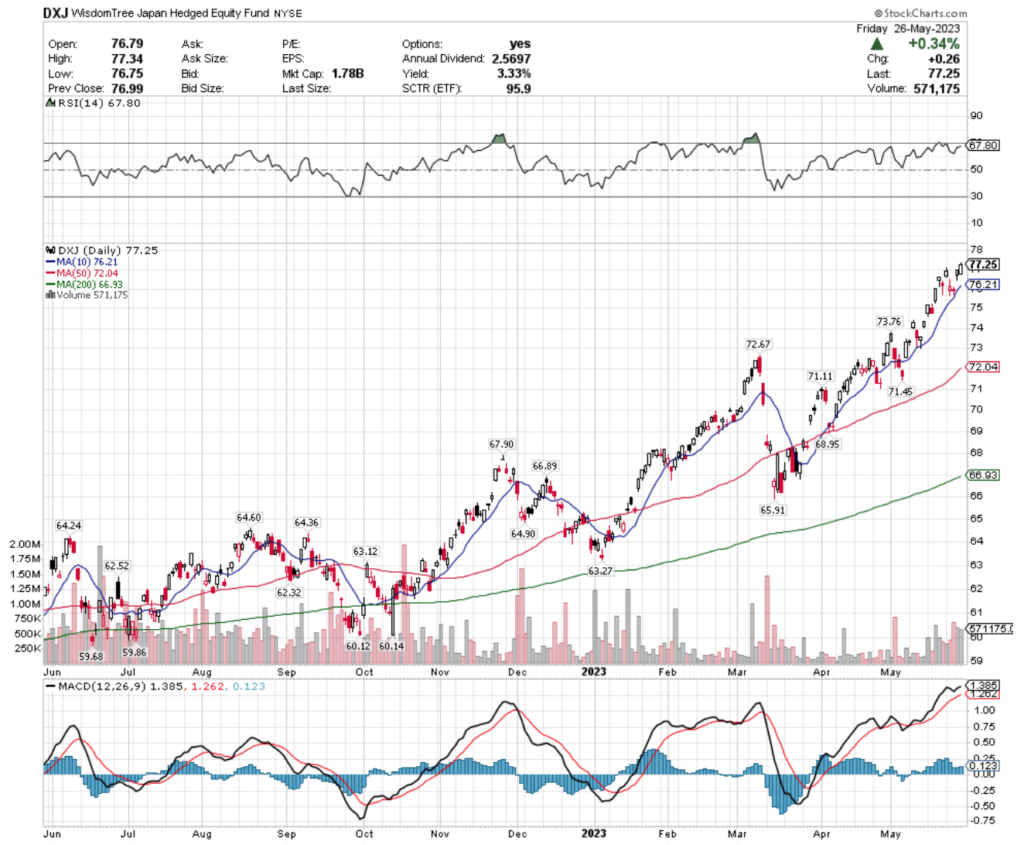
They have been on a relatively steady ascent since March 2023, with exception to one week in April.
DXJ’s RSI is approaching overbought at 67.8, but recent volumes have been roughly average compared to the year prior, signaling investors have confidence.
Their MACD is beginning to curl down bearishly, after Tuesday & Wednesday’s sessions produced losses for the ETF.
DXJ is at the highest price level in its history, making caution imperative to investors.
With a 3.33% distribution yield for long-term holders there is some protection against losses, but an options strategy such as selling calls or buying puts would be advisable while waiting to see how they behave at their support levels upon consolidation.
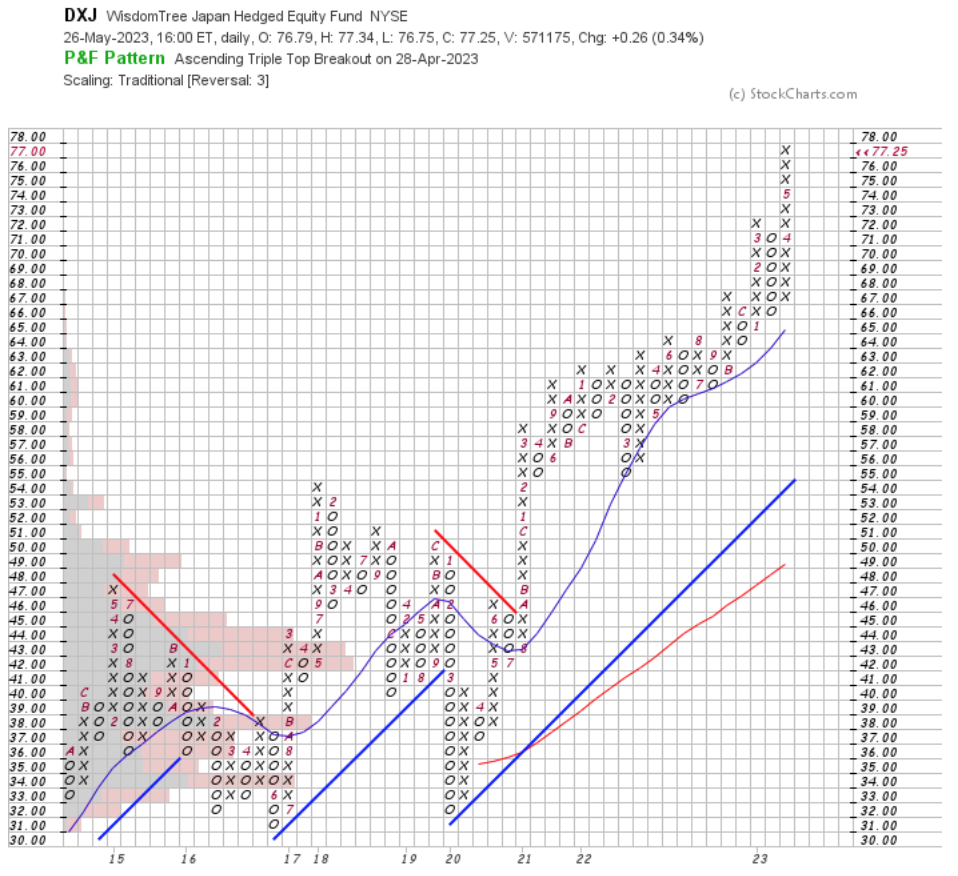
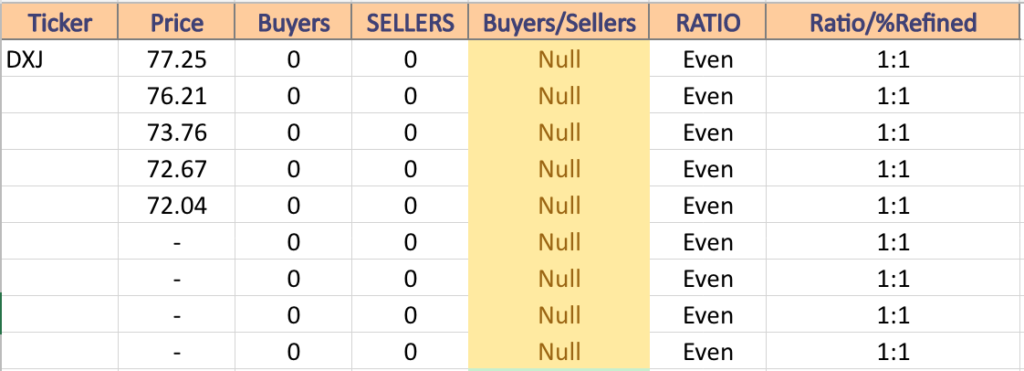
DXJ has support at the $76.21 (10 day moving average), $73.76, $72.67, $72.04/share (50 day moving average) price levels, with no overhead resistance, as they are at their all time high price level.
As the charts below show, there is very limited volume data at these levels.
EDIV, the SPDR S&P Emerging Markets Dividend ETF has improved +4.05% over the past year, gaining +27.37% since their 52-week low in November of 2022 (ex-distributions).
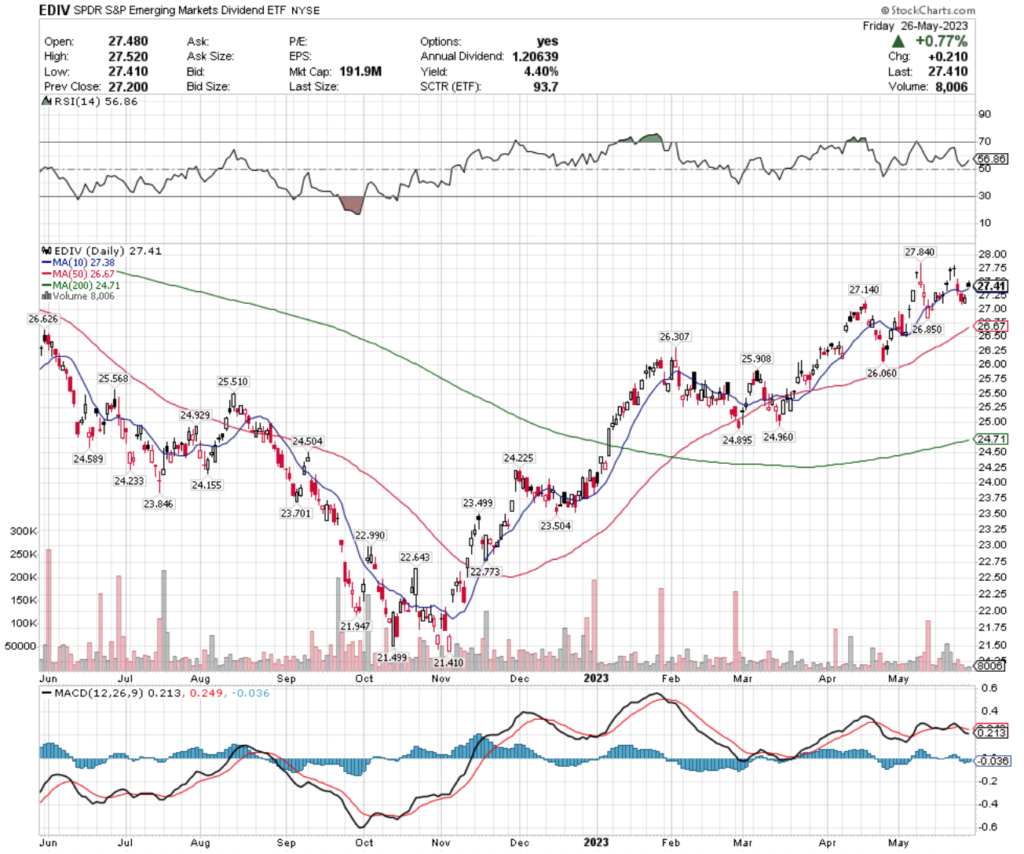
Their RSI is on the overbought end of neutral at 56.86, but volumes sunk towards the end of the week into below average levels compared to the year prior, signaling uncertainty & caution among investors.
Their MACD is currently bearish, as a result of Tuesday’s gap down & Wednesday’s losing session.
EDIV offers a 4.4% distribution yield for long-term holders, but given the uncertainty in their volume & Friday’s gap up whose candlestick closed lower than it opened, there is a need to have insurance protection in the near-term, while watching their behavior around support levels.
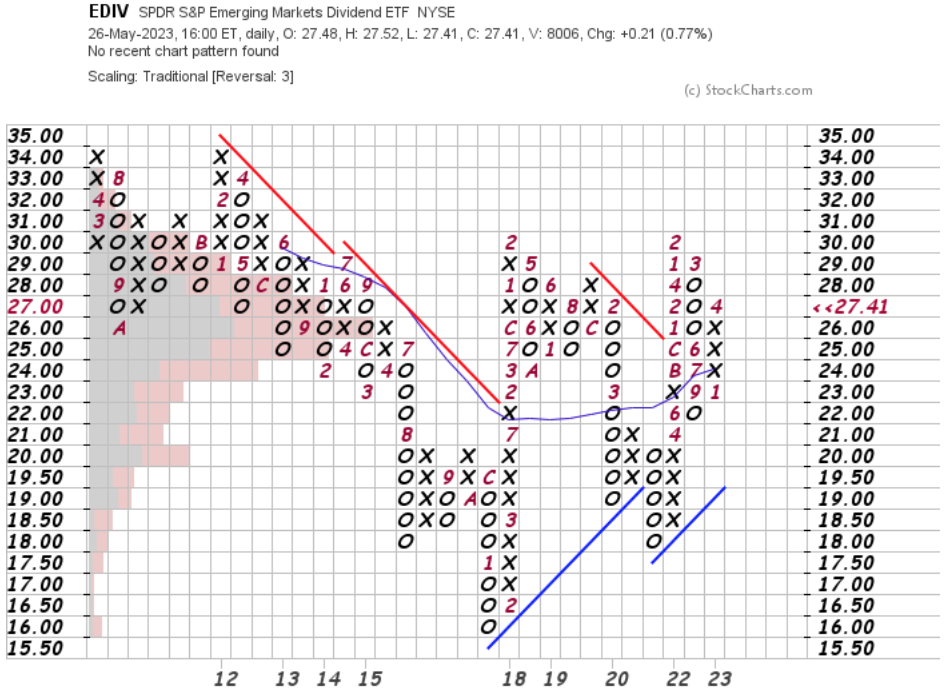
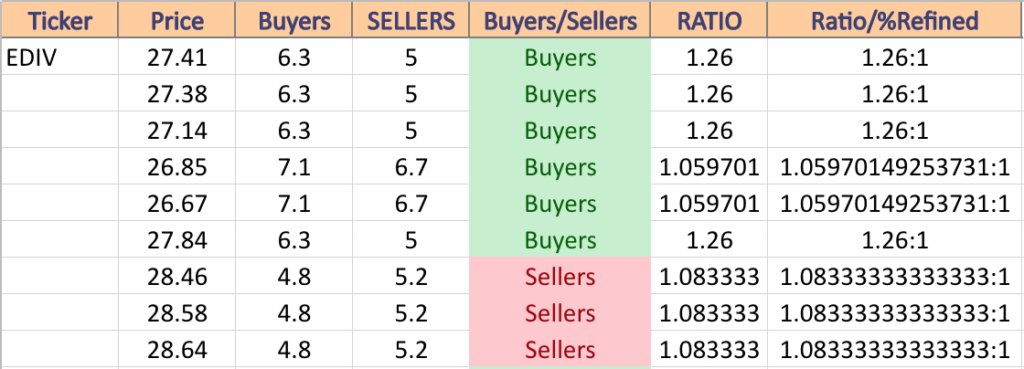
EDIV has support at the $27.38 (Volume Sentiment: Buyers, 1.26:1), $27.14 (Volume Sentiment: Buyers, 1.26:1), $26.85 (Volume Sentiment: 1.06:1) & $26.67/share (50 day moving average; Volume Sentiment: 1.06:1) price levels, with resistance at the $27.84 (Volume Sentiment: Buyers, 1.26:1), $28.46 (Volume Sentiment: Sellers, 1.08:1), $28.58 (Volume Sentiment: Sellers, 1.08:1) & $28.64/share (Volume Sentiment: Sellers, 1.08:1) price levels.
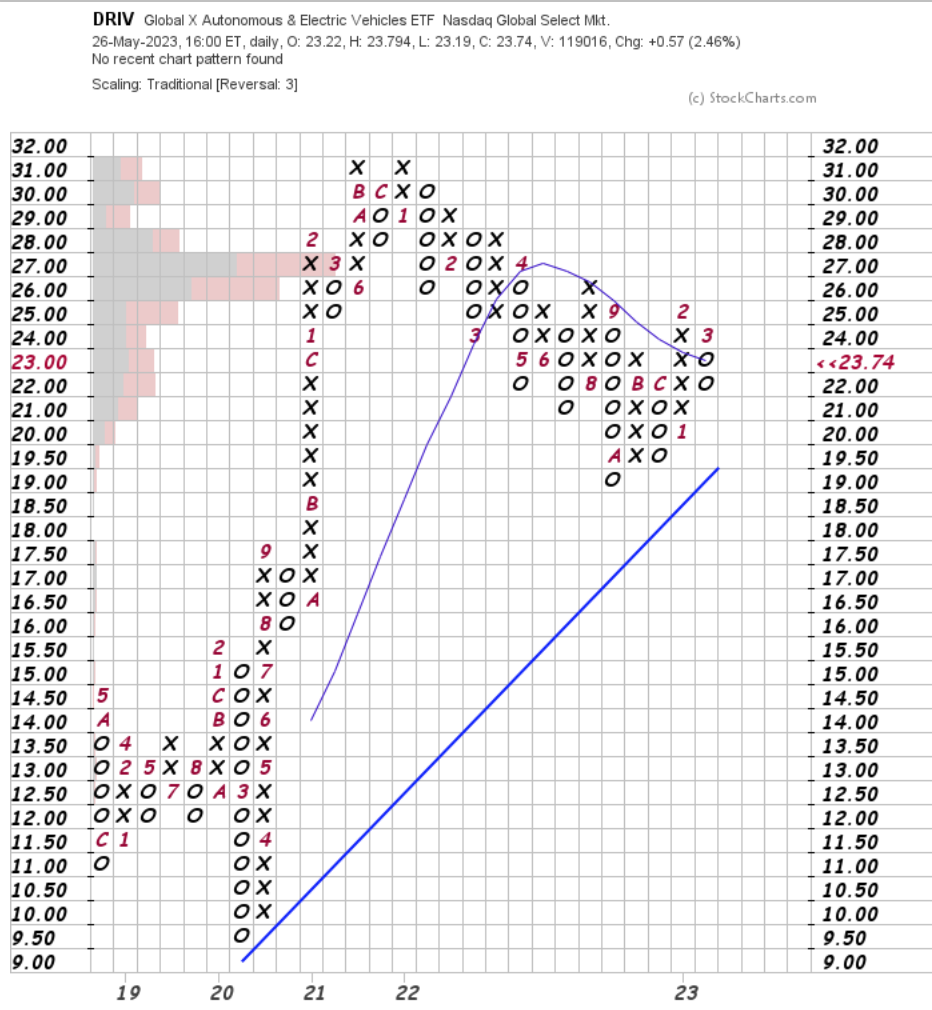
DRIV, the Global X Autonomous & Electric Vehicles ETF has fallen -4.05% over the past year, but has recovered +25.54% since their 52-week low in October of 2022 (ex-distributions).
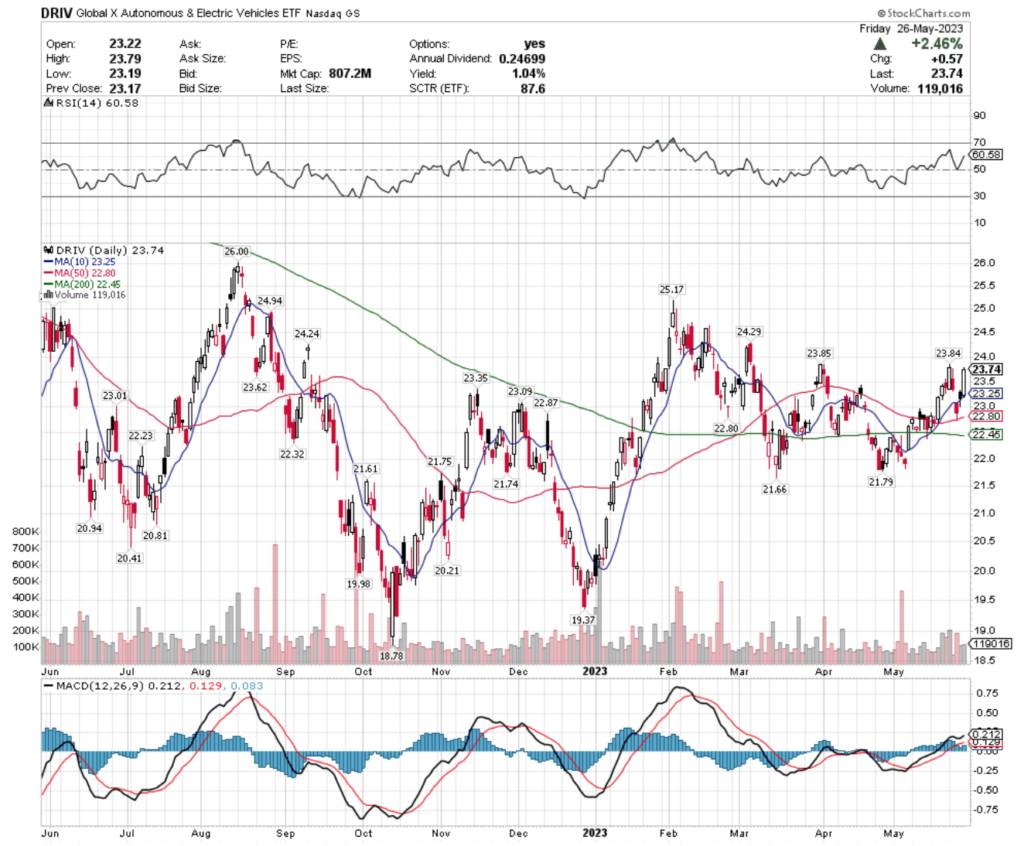
Their RSI is approaching oversold territory as it climbed over 60 in Friday’s session, with volumes coming in at about average level.
Their MACD is still bullish due in part to Friday’s +2.46% session, as they look to retest the $23.74/share price level.
With a modest 1.04% distribution yield for long-term holders, there is not much cushion against losses, making an insurance policy essential while waiting to see how they fare in the near-term.
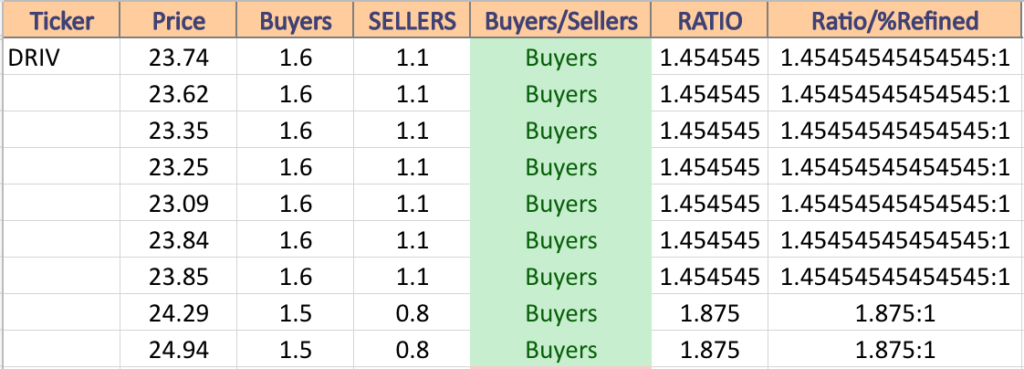
DRIV has support at the $23.62 (Volume Sentiment: Buyers, 1.45:1), $23.35 (Volume Sentiment: Buyers, 1.45:1), $23.25 (10 day moving average; Volume Sentiment: Buyers, 1.45:1), $23.09/share (Volume Sentiment: Buyers, 1.45:1) price levels, with resistance at the $23.84 (Volume Sentiment: Buyers, 1.45:1), $23.85 (Volume Sentiment: Buyers, 1.45:1), $24.29 (Volume Sentiment: Buyers, 1.87:1) & $24.94/share (Volume Sentiment: Buyers, 1.87:1) price levels.
South Africa (EZA), Base Metals (DBB), China (GXC) & Retail (XRT) Are All Bearishly Lagging The Market
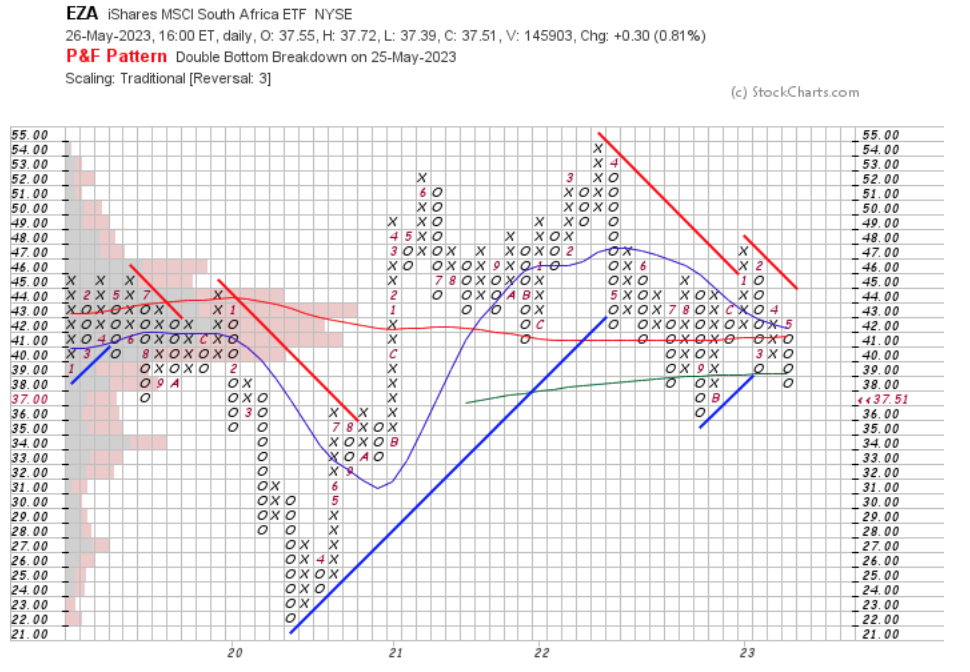
EZA, the iShares MSCI South Africa ETF has lost -18.74% over the past year, falling -23.76% since their 52-week high in May of 2022 & has recovered +5.28% since their 52-week low in October of 2022 (ex-distributions).
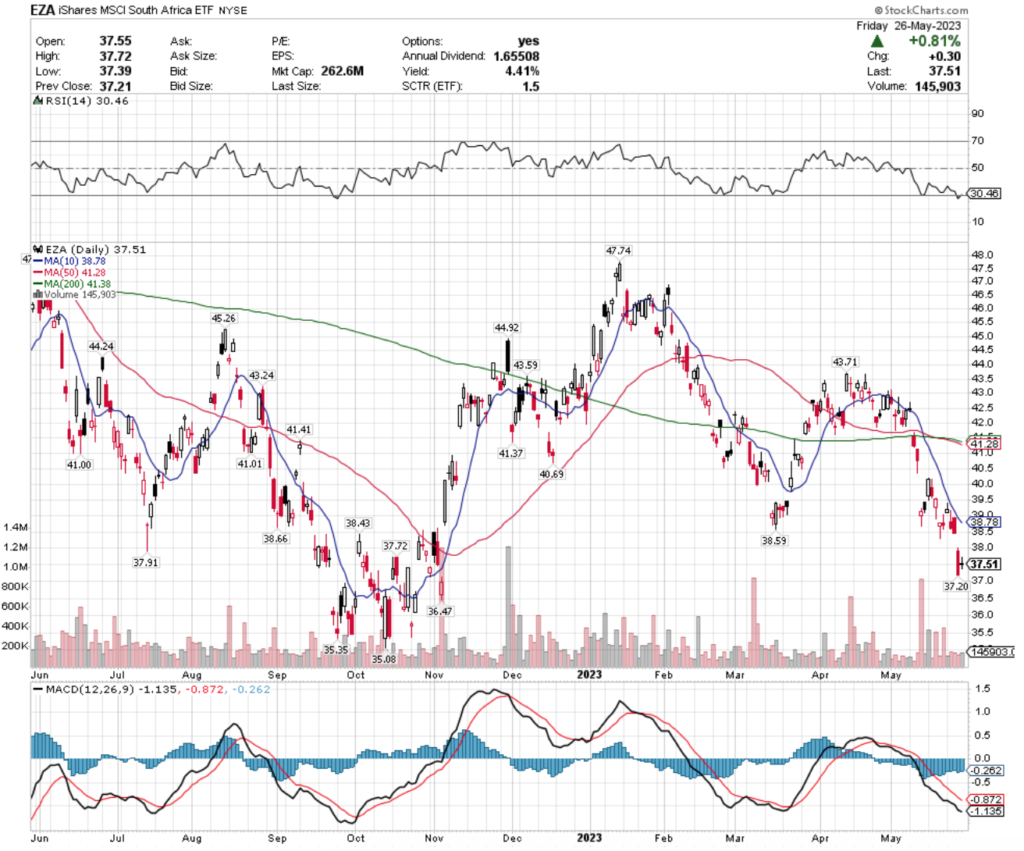
Their RSI just exited official oversold territory & currently sites at 30.46, but very timid below average volume last week is signaling that there is still uncertainty among investors regarding their near-term performance prospects, which is confirmed by Friday’s doji candlestick.
Their MACD is still in a bearish downtrend, which became steeper after Thursday’s gap down session, where they’ll try to hold $37.20/share at support.
Despite a 4.41% cushion for long-term holders in the form of a distribution yield, a wait & see approach appears best while watching how EZA behaves at its support levels in the coming weeks, unless you are holding an insurance position with options as a hedge.
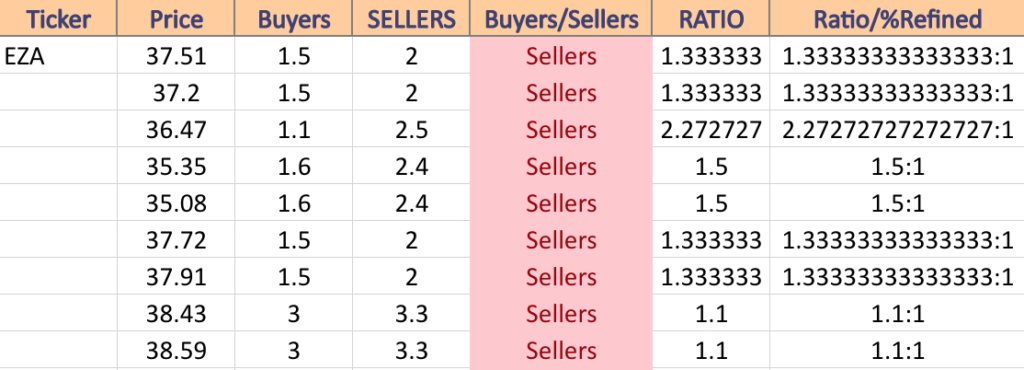
EZA has support at the $37.20 (Volume Sentiment: Sellers, 1.33:1), $36.47 (Volume Sentiment: 2.72:1), $35.35 (Volume Sentiment: 1.5:1) & $35.08/share (Volume Sentiment: 1.5:1) price levels, with resistance at the $37.72 (Volume Sentiment: Sellers, 1.33:1), $37.91 (Volume Sentiment: Sellers, 1.33:1), $38.43 (Volume Sentiment: Sellers 1.1:1) & $38.59/share (Volume Sentiment: Sellers 1.1:1) price levels.
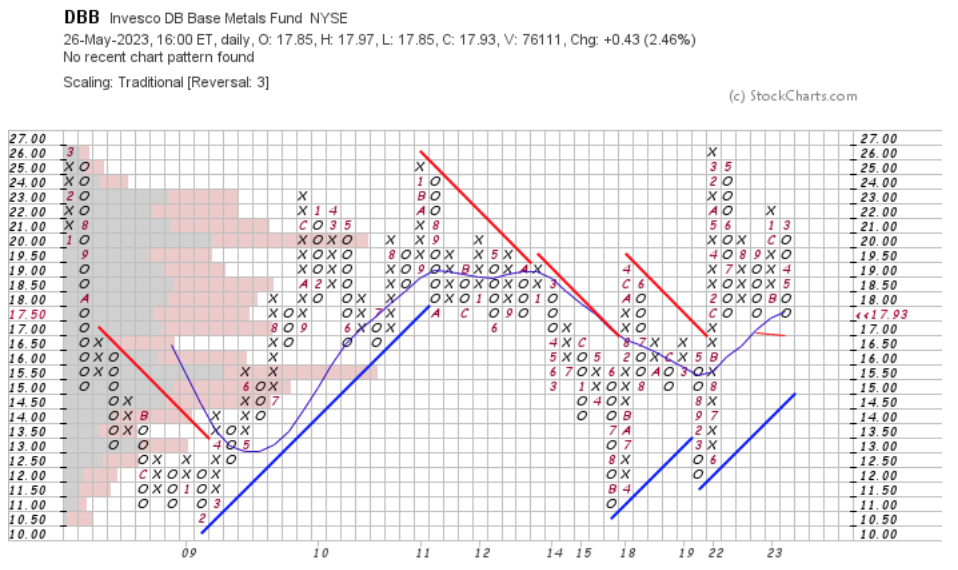
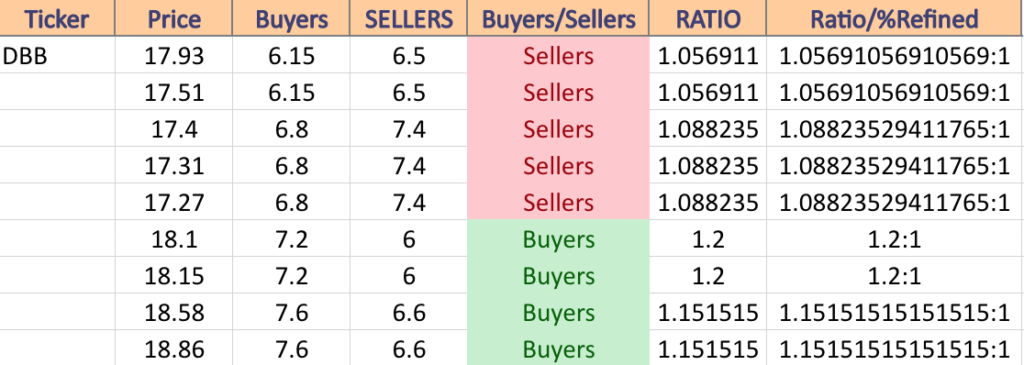
DBB, the Invesco DB Base Metals Fund ETF has fallen -21.82% over the past year, losing -24.19% since their 52-week high in June of 2022, but has reclaimed +3.05% since their 52-week low in May of 2023 (ex-distributions).
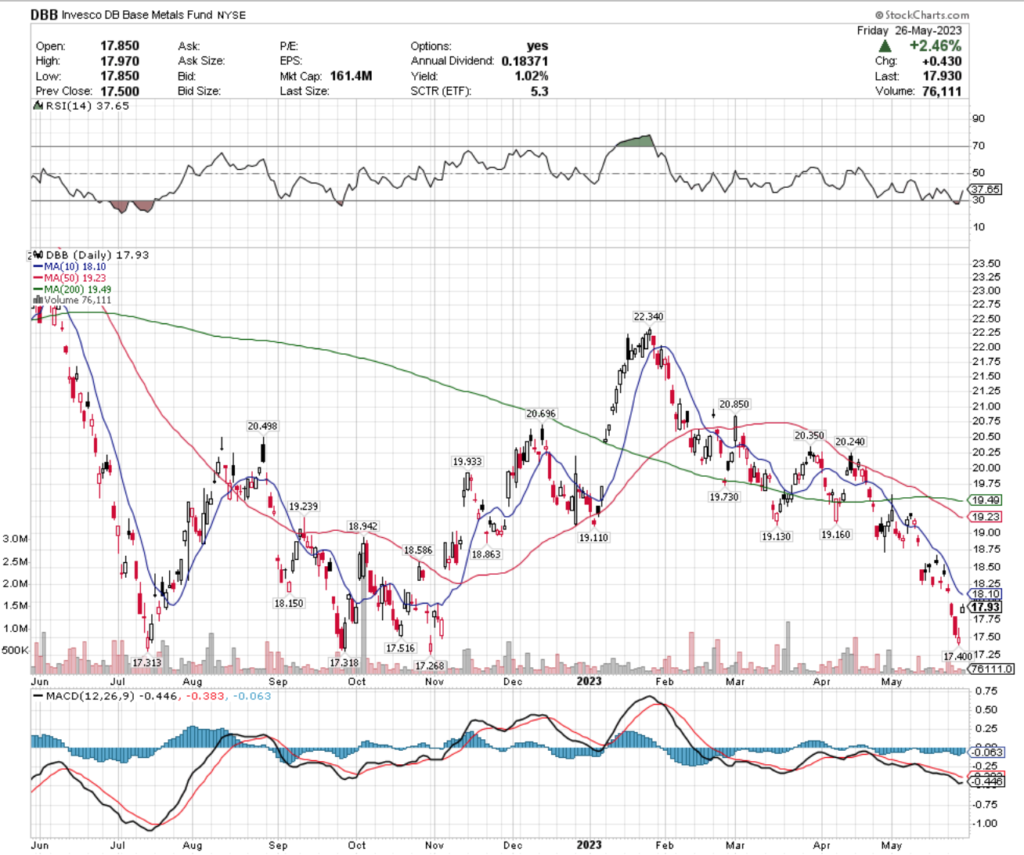
Their RSI has just recovered from oversold territory & is currently at 37.65 & their MACD has smoothed & looks to cross over bullishly in early next week after Friday’s gap up of +2.46%.
Volumes have been very low compared to average this past week, as investors will see how they feel about the $17.40-17.93 price range, with the current signal being uncertainty.
DBB’s modest 1.02% distribution yield for long-term holders provides limited downside protection, making it wisest to wait to see how their support levels hold up, with some type of hedge against possible poor performance.
DBB has support at the $17.51 (Volume Sentiment: Sellers, 1.06:1), $17.40 (Volume Sentiment: Sellers, 1.09:1), $17.31 (Volume Sentiment: Sellers, 1.09:1) & $17.27/share (Volume Sentiment: Sellers, 1.09:1) price levels, with resistance at the $18.10 (10 day moving average; Volume Sentiment: Buyers, 1.2:1), $18.15 (Volume Sentiment: Buyers, 1.2:1), $18.58 (Volume Sentiment: Buyers, 1.15:1) & $18.86/share (Volume Sentiment: Buyers, 1.15:1) price levels.
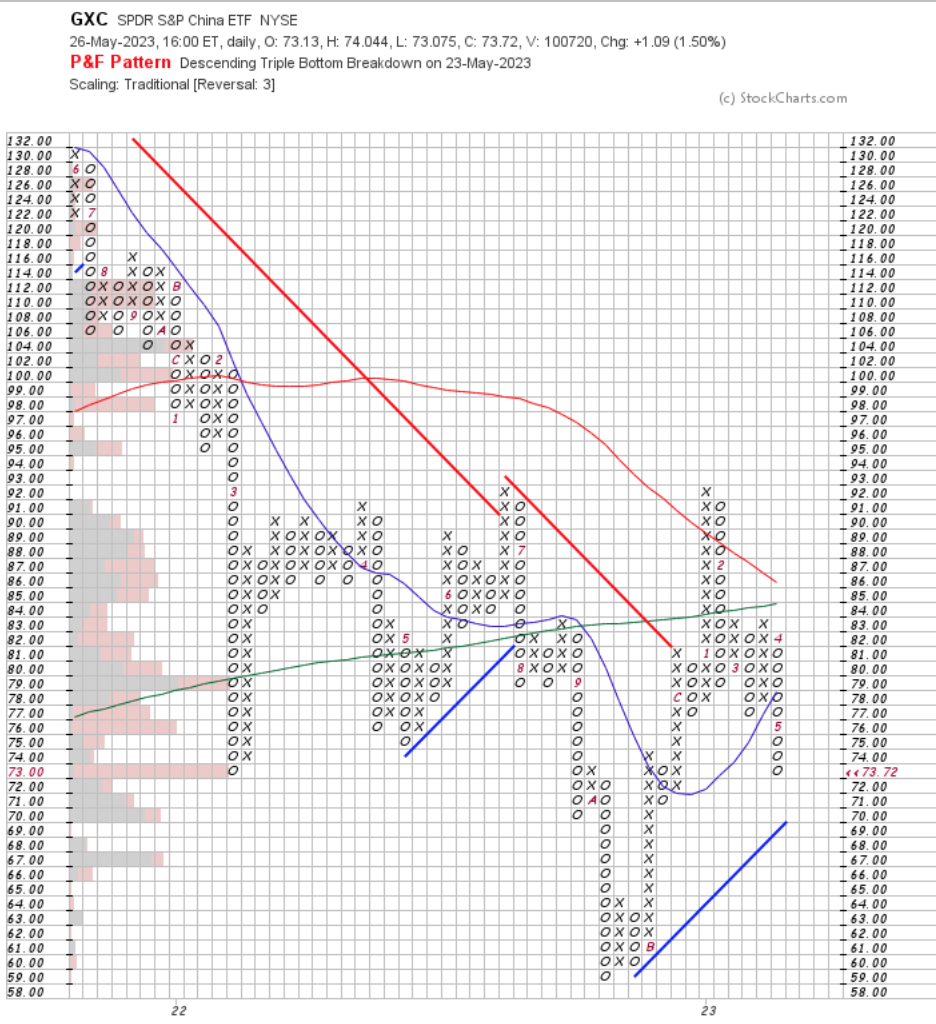
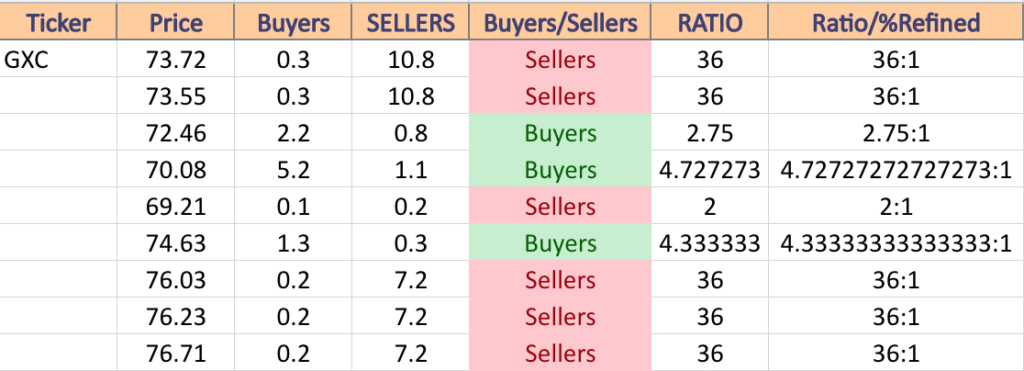
GXC, the SPDR S&P China ETF has shed -9.21% over the past year, declining -21.39% from their 52-week high in June of 2022, but has reclaimed +22.85% since their 52-week low in October of 2022 (ex-distributions).
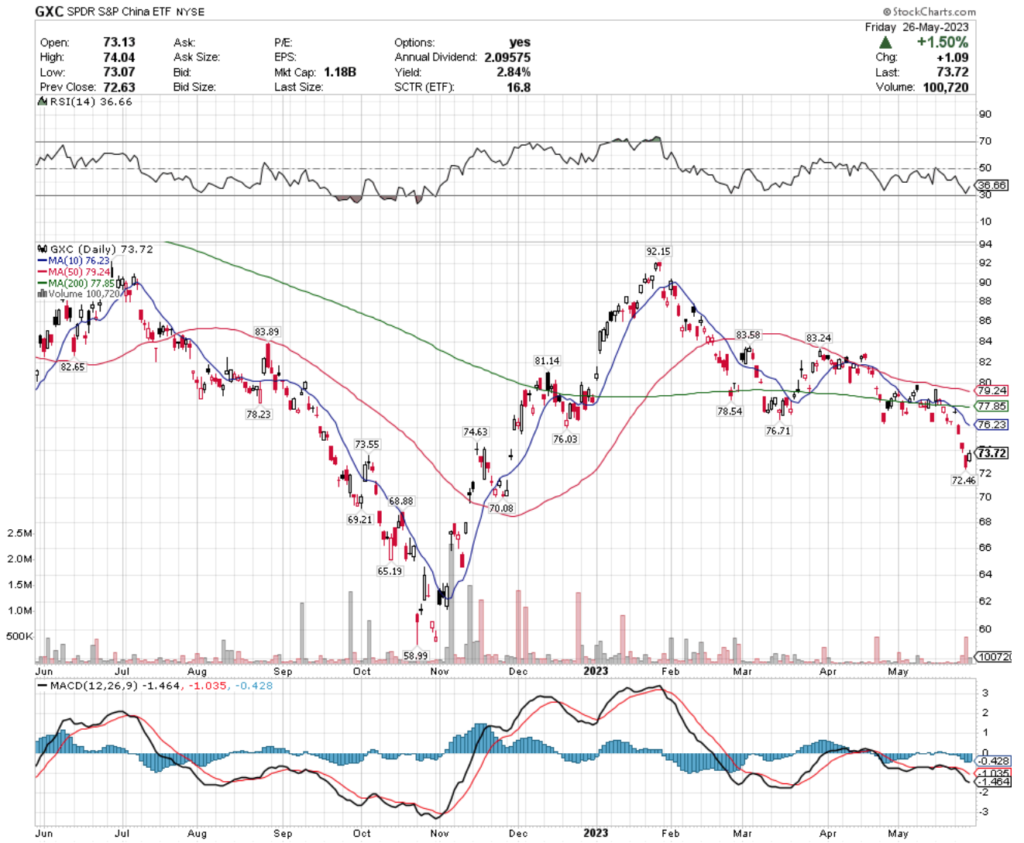
Their MACD is still in bearish descent, despite their RSI spiking after Friday’s +1.5% session to settle at 36.66.
Volumes has been above average the last 3 sessions, with Friday’s session attempting to fill in the gap down caused by Thursday’s session.
GXC offers a 2.84% distribution yield for long-term shareholders, which provides a slight cushion against losses, but they do not appear to be out of the woods just yet, as investors should be eyeing where to target an entry in less volatile markets.
GXC has support at the $73.55 (Volume Sentiment: Sellers, 36:1), $72.46 (Volume Sentiment: Buyers, 2.75:1), $70.08 (Volume Sentiment: Buyers, 4.73:1) & $69.21/share (Volume Sentiment: Sellers, 2:1) price levels, with resistance at the $74.63 (Volume Sentiment: Buyers, 4.33:1), $76.03 (Volume Sentiment: Sellers, 36:1), $76.23 (10 day moving average; Volume Sentiment: Sellers, 36:1) & $76.71/share (Volume Sentiment: Sellers, 36:1) price levels.
XRT, the SPDR S&P Retail ETF has lost -16.06% over the past year, losing -22.41% since their 52-week high in April of 2022, while climbing back +11.19% from their 52-week low in September of 2022 (ex-distributions).
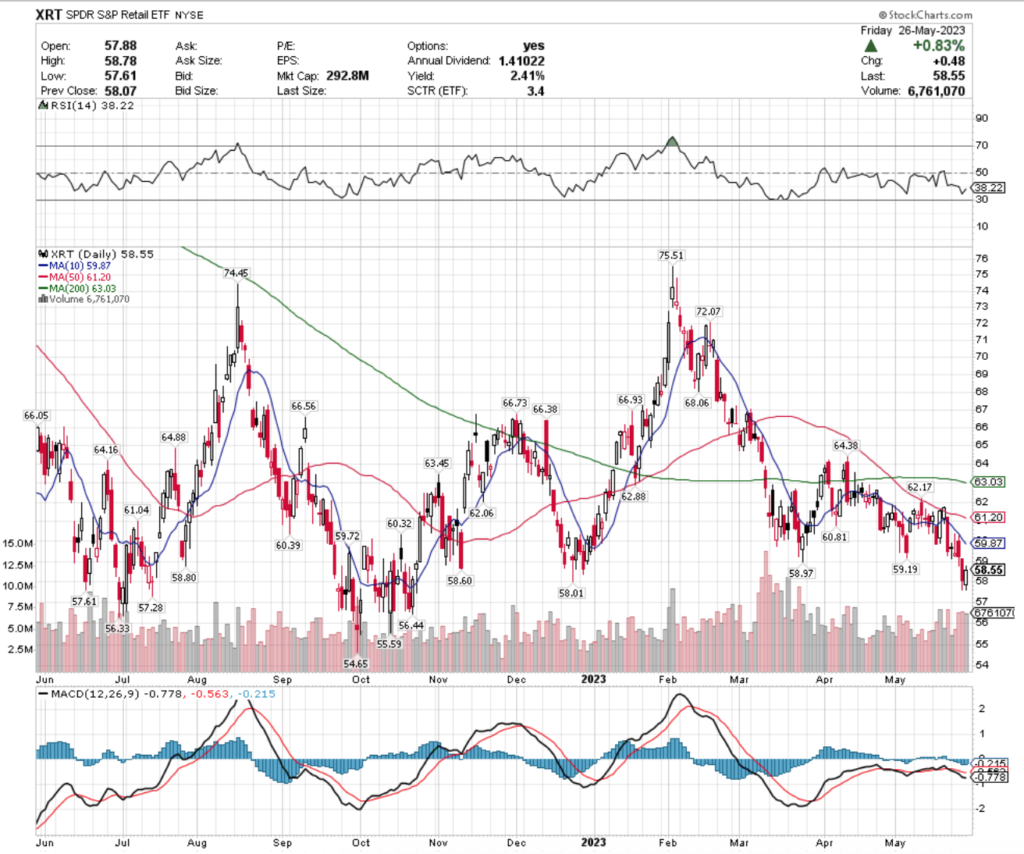
Their RSI climbed to 38.22 after Friday’s +0.83% session, which had higher than average volume.
Their MACD is still bearish, but is flatting out to attempt a bullish cross in the coming week.
XRT’s 2.41% distribution yield is a small cushion against potential losses, but unless you’re hedging against a position there is still more risk than worth taking here, but eyeing their behavior at support will give clues as to what levels to buy at when markets have calmed down.
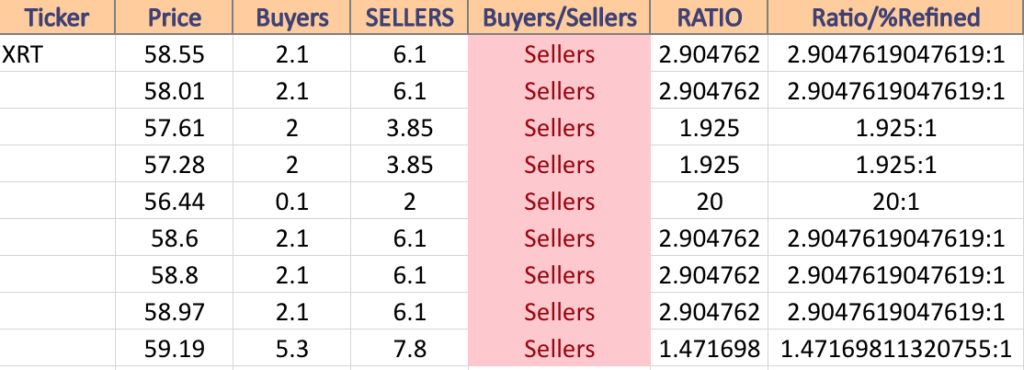
XRT has support at the $58.01 (Volume Sentiment: Sellers, 2.9:1), $57.61 (Volume Sentiment: Sellers, 1.93:1), $57.28 (Volume Sentiment: Sellers, 1.93:1) & $56.44/share (Volume Sentiment: Sellers, 20:1) price levels, with resistance overhead at the $58.60 (Volume Sentiment: Sellers, 2.9:1), $58.80 (Volume Sentiment: Sellers, 2.9:1), $58.97 (Volume Sentiment: Sellers, 2.9:1) & $59.19/share (Volume Sentiment: Sellers, 1.47:1) price levels.
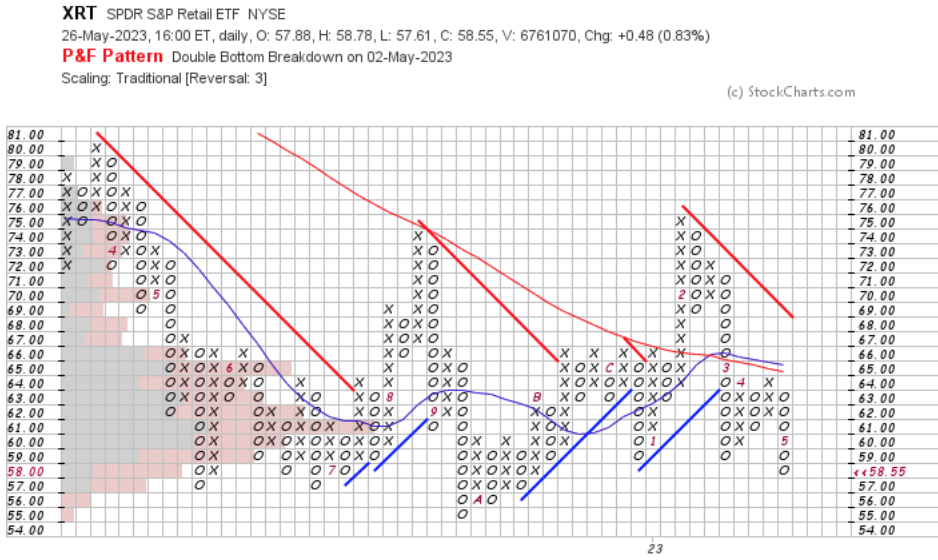
XRT Point & Figure Chart With Volume Overlay
Tying It All Together
Monday the markets will be closed in observance of Memorial Day, so there will be no data being reported, nor earnings reports; thank you to all readers who have served our country.
Tuesday’s data kicks off with the S&P Case-Schiller Home Price Index (20 cities) at 9 am, followed by Consumer Confidence at 10 am & Richmond Fed President Barkin speaking at 1pm.
Tuesday’s earnings include Ambarella, Box, Canopy Growth, Hewlett Packard Enterprise, HP & Sportsman’s Warehouse.
ADP Employment data is reported Wednesday at 8:15 am, followed by the Chicago Business Barometer at 9:45 am, Job Openings at 10 am, Philadelphia Fed President Patrick Harker speaking at 12:30 pm & the Federal Reserve Beige Book at 2pm.
Salesforce is the most anticipated earnings call on Wednesday, along with Advanced Auto Parts, C3.ai, Chewy, Conn’s, CrowdStrike, GameStop, NetApp, Nordstrom, Victoria’s Secret & others.
Thursday at 8:30 am we get Initial Jobless Claims & U.S. Productivity data, with IS&P U.S. Manufacturing PMI data at 9:45 am, ISM Manufacturing & Construction Spending data at 10 am & Philadelphia Fed President Patrick Harker speaking at 1pm.
Thursday’s earnings calls include Broadcom, Lululemon Athletica, Cooper, Dell Technologies, Dollar General, Five Below, Hormel Foods, Macy’s, MongoDB, VMware & more.
Friday the week winds down at 8:30 am when we get U.S. Employment Report, U.S. Unemployment Rate, U.S. Hourly Wages & Hourly Wages Year-Over-Year reported, with limited earnings calls being held.
See you back here next week!
*** I DO NOT OWN SHARE OR OPTIONS CONTRACT POSITONS IN SPY, QQQ, IWM, TDIV, DXJ, EDIV, DRIV, EZA, DBB, GXC or XRT AT THE TIME OF PUBLISHING THIS ARTICLE ***