On Friday afternoon I found myself at happy hour, pen in hand, modeling out volume data on some of my holdings & hedges.
I was mostly interested in seeing how the volume has been at their support & resistance levels, as well as at & around the strike prices of my options contracts, which led me to the idea of doing the same exercise (in Excel this time) for ETFs that track the major stock indexes.
The methodology is relatively simple (feel free to skip ahead to the data in the next heading section if this portion is not of interest); first, look at the Point & Figure charts’ time horizons & match the candlestick charts to the closest time period (based on my account permissions), then find the resistance & support levels on the candlestick charts for said time period.
After, using the Volume By Price layover data on the Point & Figure charts, I looked at the Buyer vs. Seller Volume at each price level & recorded the volume trends for each price level’s relevant box as a ratio & applied the data to the individual support/resistance/strike prices (my notebook exercise had more layers of relevant detail & indicators to my specific trades, but this is what is being used in the following article).
Below I apply that methodology to SPY, the SPDR S&P 500 ETF, QQQ, the Invesco QQQ Trust ETF which tracks the NASDAQ, IWM, the iShares Russell 2000 ETF & DIA, the SPDR Dow Jones Industrial Average ETF to see how investor sentiment is at all of these levels throughout this relatively sideways market period to see what additional insights of value it can provide towards future market performance.
Those ETFs were chosen due to their coverage of the major U.S. market indexes, but the methodology can be applied to other securities as well, with further customizations.
The data & tables presented below are meant to serve as a reference guide to trader/investor sentiment for each price level being presented.
Please note that some of the observed data may not be complete/was unable to be accounted for (most likely due to sampling), leading to some ratio figures that are unconventional, which are all marked with a “*” & can be referenced in any of the images that accompany each section.
The following is meant to serve as a reference to how market participants have behaved historically at these price levels & is neither investment advice nor recommendations of any kind.
SPY, The S&P 500 ETF’s Volume Analysis At Support & Resistance Points
SPY, the ETF that is most often referred to for tracking the returns of the S&P 500’s Point & Figure Chart is below, showing the volume overlays along with the 10 & 50 day moving averages & support lines for a period of roughly the past 2 years.
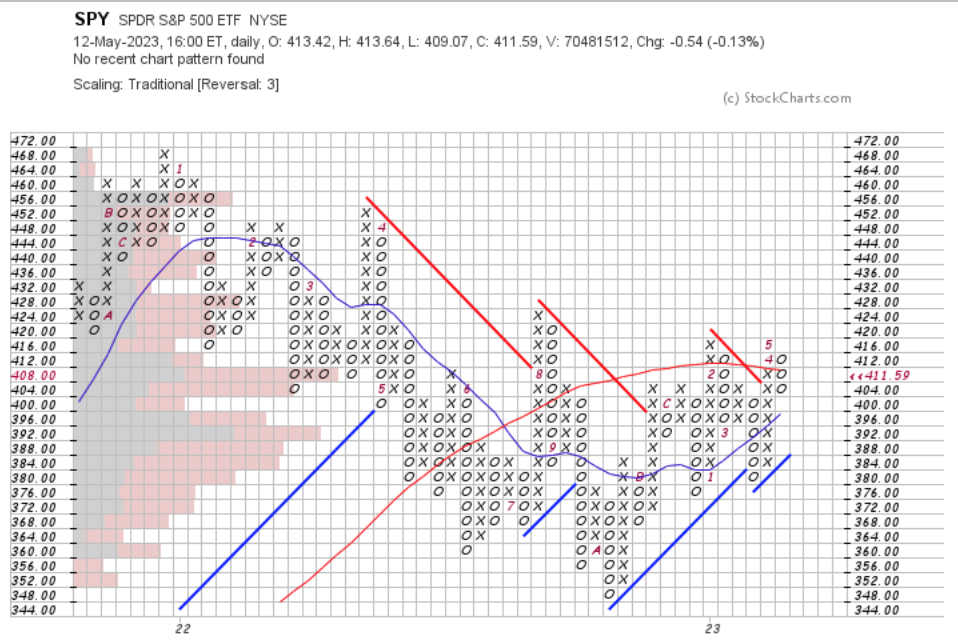
As the chart goes back ~2 years, I selected the 2 year SPY candlestick chart as well to make them match as closest as possible, given the limitations of the toolset that I was using, where we are able to see the support & resistance levels for that time period, as well as the moving averages & other indicator data.
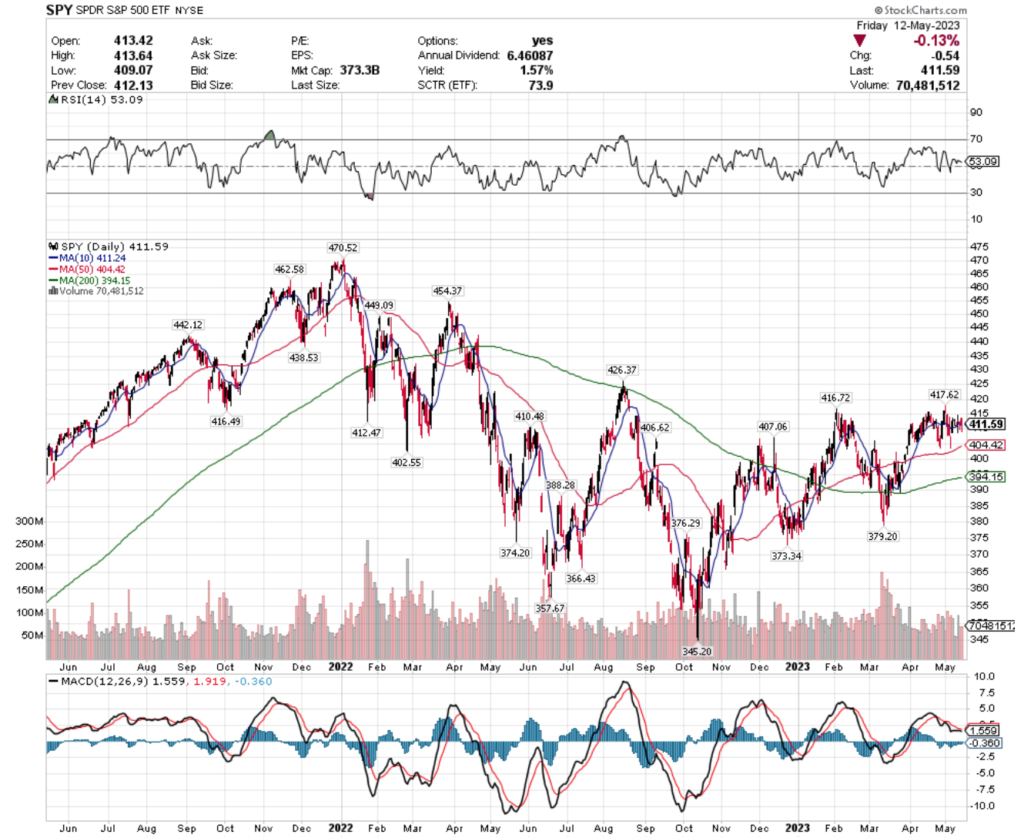
SPY closed on Friday 5/12/2023 at $411.49/share, which would place it in the Point & Figure percentage box range for the $408/share price level.
At $408/share over the past year, SPY’s volume has favored the Sellers by 1.57:1 (I counted the boxes by hand/estimated the fraction of boxes, this did not come from raw data).
The $412/share box covers all prices that go from $412.00-$415.99, where Buyers are dominating the volume 3:1, which is one of the 5 strongest price levels in terms of their ratio.
The $404/share box covers $404-$407.99 SPY prices, where the Sellers are favored 1.90:1, before from $400 down to $392 the Buyers are back in control historically for the time period covered (1.133:1, 1.45:1 & 1.87:1, respectively), before the Sellers take back over from $388 down until $364.
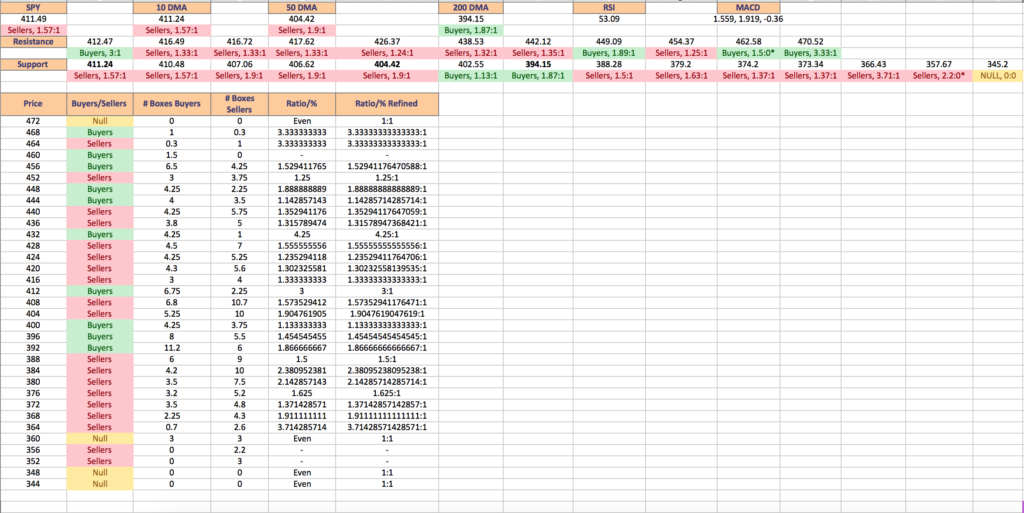
SPY’s current closest Resistance Levels for the time period, as well as their volume ratings are below:
$412.47 – Buyers – 3:1
$416.49 – Sellers – 1.33:1
$416.72 – Sellers – 1.33:1
$417.62 – Sellers – 1.33:1
$426.37 – Sellers – 1.24:1
$438.53 – Sellers – 1.32:1
$442.12 – Sellers – 1.35:1
$449.09 – Buyers – 1.89:1
$454.37 – Sellers – 1.25:1
$462.58 – Buyers – 1.5:0*
$470.52 – Buyers – 3.33:1
SPY’s Support Levels within that time period are below (BOLD denotes a moving average):
$411.24 – Sellers – 1.57:1 (10 DMA)
$410.48 – Sellers – 1.57:1
$407.06 – Sellers – 1.9:1
$406.62 – Sellers- 1.9:1
$404.42 – Sellers – 1.9:1 (50 DMA)
$402.55 – Buyers – 1.13:1
$394.15 – Buyers – 1.87:1 (200 DMA)
$388.28 – Sellers – 1.5:1
$379.20 – Sellers – 1.63:1
$374.20 – Sellers – 1.37:1
$373.34 – Sellers – 1.37:1
$366.43 – Sellers – 3.71:1
$357.67 – Sellers – 2.2:0*
$345.2 – NULL – 0:0*
SPY’s Point & Figure price levels are listed below, with their respective volume sentiment:
$472 – NULL – 1:1
$468 – Buyers – 3.33:1
$464 – Sellers – 3.33:1
$460 – Buyers – 1.5:0*
$456 – Buyers – 1.53:1
$452 – Sellers – 1.25:1
$448 – Buyers – 1.89:1
$444 – Buyers – 1.14:1
$440 – Sellers – 1.35:1
$436 – Sellers – 1.32:1
$432 – Buyers – 4.25:1
$428 – Sellers – 1.56:1
$424 – Sellers – 1.24:1
$420 – Sellers – 1.30:1
$416 – Sellers – 1.33:1
$412 – Buyers – 3:1
$408 – Sellers – 1.57:1
$404 – Sellers – 1.90:1
$400 – Buyers – 1.13:1
$396 – Buyers – 1.45:1
$392 – Buyers – 1.87:1
$388 – Sellers – 1.5:1
$384 – Sellers – 2.38:1
$372 – Sellers – 1.37:1
$380 – Sellers – 2.14:1
$376 – Sellers – 1.63:1
$368 – Sellers – 1.91:1
$364 – Sellers – 3.71:1
$360 – NULL – 3:3
$356 – Sellers – 2.2:0*
$352 – Sellers – 3:0*
$348 – NULL 0:0*
$344 – NULL – 0:0*
QQQ, the Invesco QQQ Trust, Tracking The NASDAQ ETF’s Volume Analysis At Support & Resistance Points
The QQQ ETF is often used as a proxy for the performance of the NASDAQ index & closed at $325.03/share on Friday 5/12/2023.
Their Point & Figure chart was closer to a year & a half, so a two year candlestick chart was selected in order to observe their support & resistance levels.
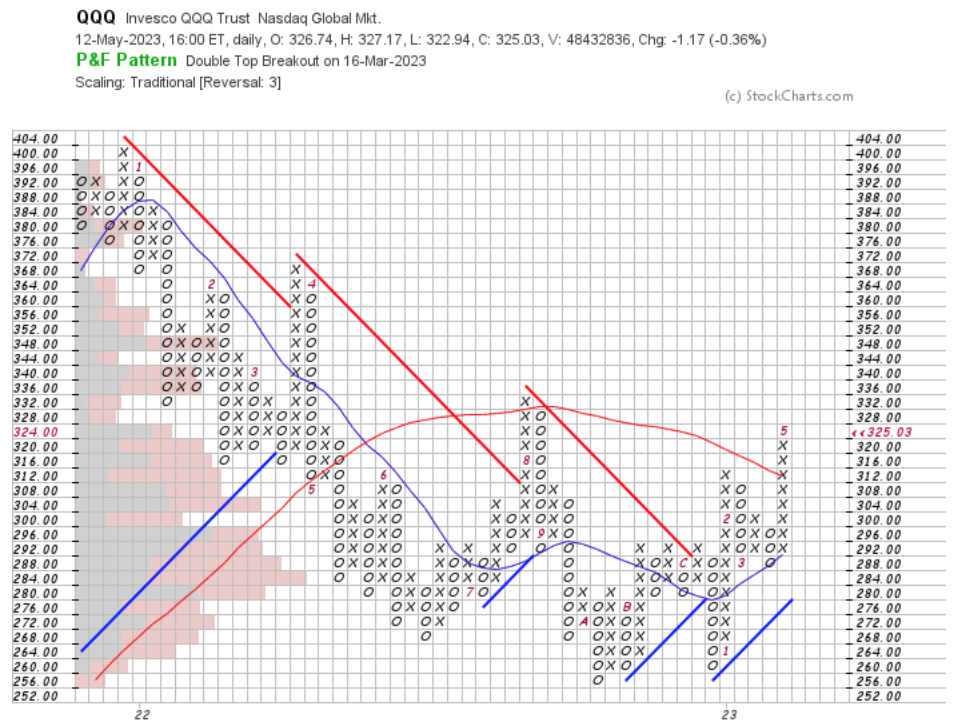
At $325.03, QQQ is currently in the $324/share box range, which for the past year & a half has been dominated by Buyers, at a rate of 5.3:1.
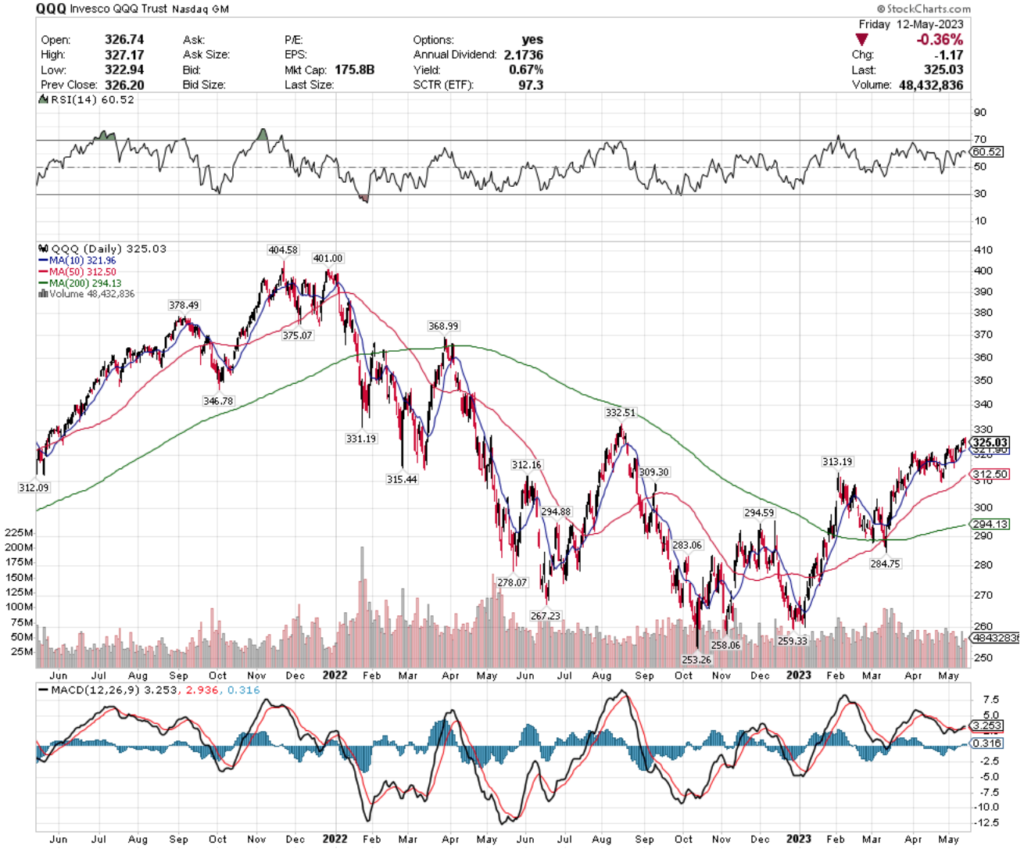
The neighboring $328/share box is a Sellers range at 1.8:1, and the neighboring 3 higher levels have also been dominated by Sellers in this time period (3.2:1, 1.69:1 & 1.2:1), with the $320/share box also being a Sellers range at a rate of 2:1.
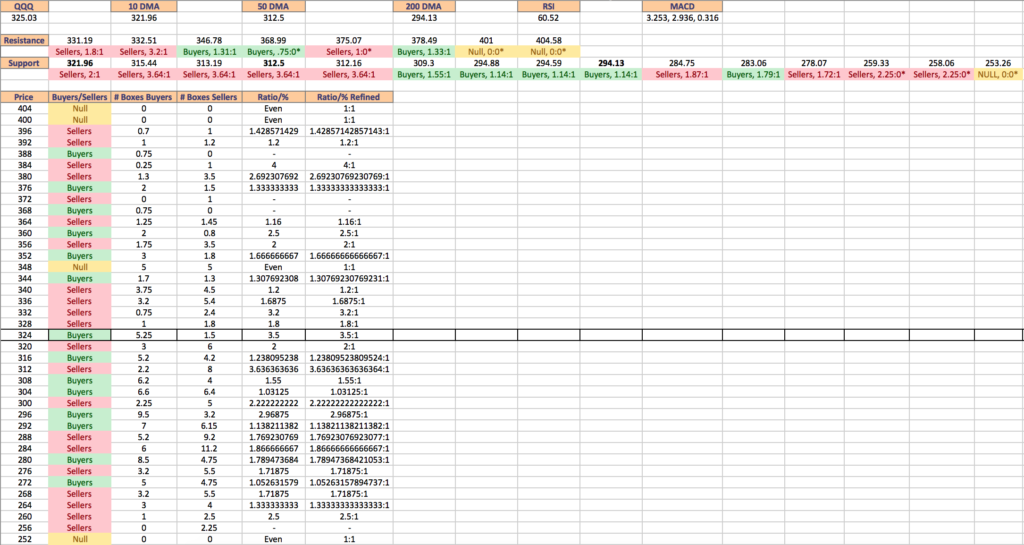
QQQ’s Resistance Levels For The Past Two Years & Their Volume Sentiment:
$331.19 – Sellers – 1.8:1
$332.51 – Sellers – 3.2:1
$346.78 – Buyers – 1.31:1
$368.99 – Buyers – 0.75:0*
$375.07 – Sellers – 1:0*
$378.49 – Buyers – 1.33:1
$401 – NULL – 0:0*
$404.58 – NULL – 0:0*
QQQ’s Support Levels for that time period are below (BOLD denotes moving average level):
$321.96 – Sellers – 2:1 (10 DMA)
$315.44 – Sellers – 3.64:1
$313.19 – Sellers – 3.64:1
$312.50 – Seller s- 3.64:1 (50 DMA)
$312.16 – Sellers – 3.64:1
$309.30 – Buyers – 1.55:1
$294.88 – Buyers – 1.14:1
$294.59 – Buyers – 1.14:1
$294.13 – Buyers – 1.14:1 (200 DMA)
$284.75 – Sellers – 1.87:1
$283.06 – Buyers – 1.79:1
$278.07 – Sellers – 1.72:1
$259.33 – Sellers – 2.25:0*
$258.06 – Sellers – 2.25:0*
$253.26 – NULL – 0:0*
QQQ’s Point & Figure price levels are listed below, with their respective volume sentiment:
$404 – NULL – 0:0*
$400 – NULL – 0:0*
$396 – Sellers – 1.43:1
$392 – Sellers – 1.2:1
$388 – Buyers – 0.75:0*
$384 – Sellers – 4:1
$380 – Sellers – 2.69:1
$376 – Buyers – 1.33:1
$372 – Sellers – 1:0*
$368 – Buyers – 0.75:0*
$364 – Sellers – 1.16:1
$360 – Buyers – 2.5:1
$356 – Sellers – 2:1
$352 – Buyers – 1.67:1
$348 – NULL – 1:1
$344 – Buyers – 1.31:1
$340 – Sellers – 1.2:1
$336 – Sellers – 1.69:1
$332 – Sellers – 3.2:1
$328 – Sellers – 1.8:1
$324 – Buyers – 3.5:1
$320 – Sellers – 2:1
$316 – Buyers – 1.24:1
$312 – Sellers – 3.64:1
$308 – Buyers – 1.55:1
$304 – Buyers – 1.03:1
$300 – Sellers – 2.22:1
$296 – Buyers – 2.97:1
$292 – Buyers – 1.14:1
$288 – Sellers – 1.77:1
$284 – Sellers – 1.87:1
$280 – Buyers – 1.79:1
$276 – Sellers – 1.72:1
$272 – Buyers – 1.05:1
$268 – Sellers – 1.72:1
$264 – 1.33:1
$260 – Sellers – 2.5:1
$256 – Sellers – 2.25:0*
$252 – NULL – 0:0*
IWM, the iShares Russell 2000 ETF’s Volume Analysis At Support & Resistance Points
IWM, the ETF commonly used as a proxy for the performance of the Russell 2,000 small cap stocks had roughly a year & a half chart when I loaded their Point & Figure data, calling for a two year chart for the candlestick resources.
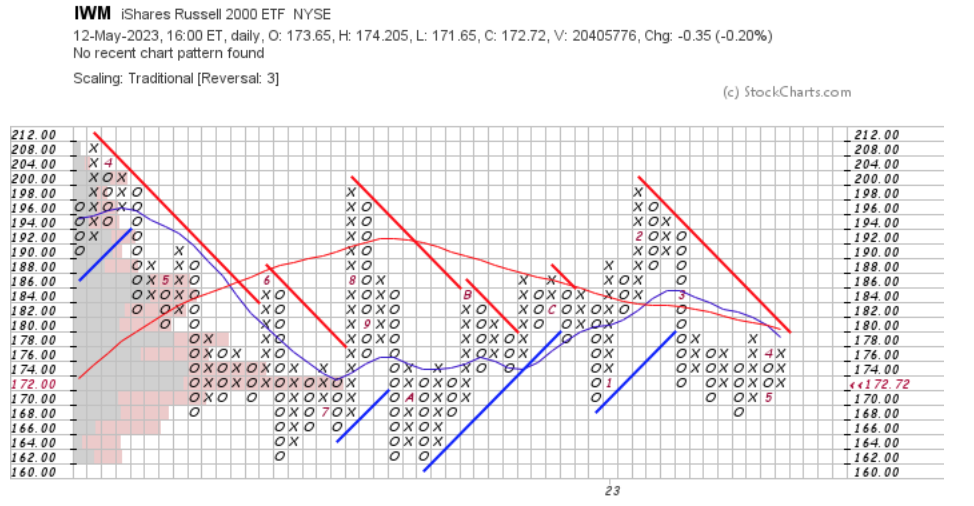
IWM closed at $172.72/share on Friday 5/12/2023, placing it in the $172/share box, which is currently dominated by the Sellers at a rate of 1.47:1.
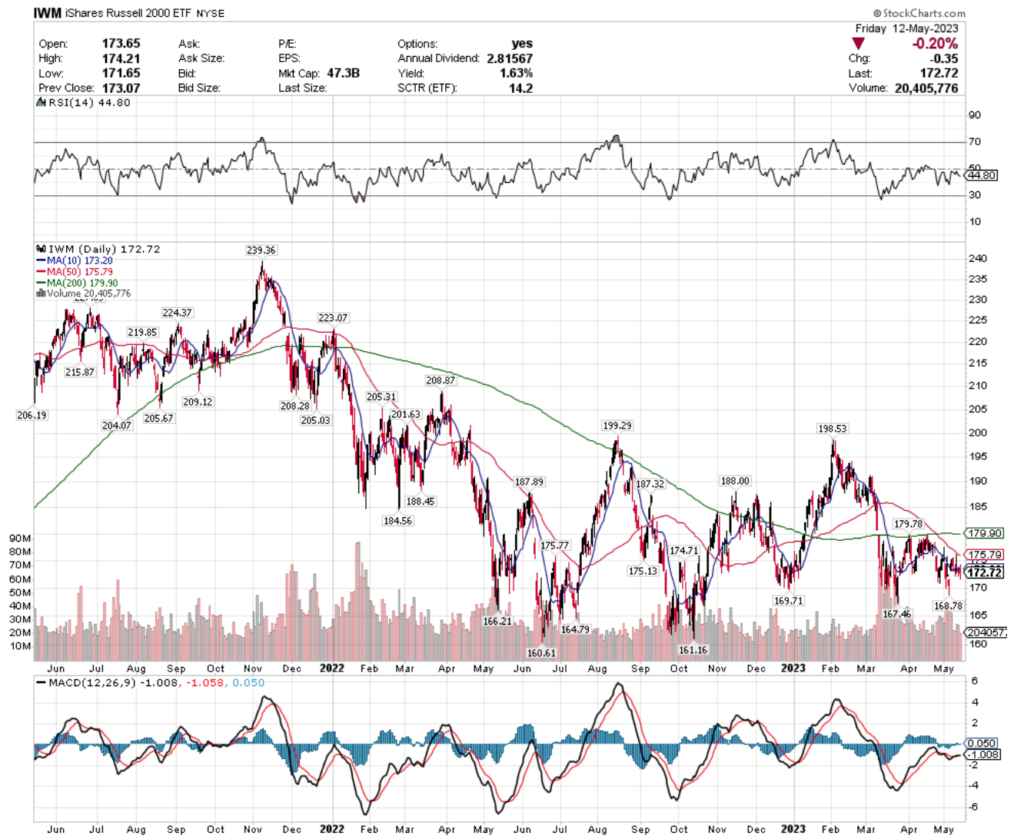
The next box above IWM’s current price level is $174, which has been won by the Buyers at a rate of 1.45:1 over the past 2 years, with their next leg lower being the $170 range, which has also been a Seller dominated zone at a rate of 2.17:1 in that time period.
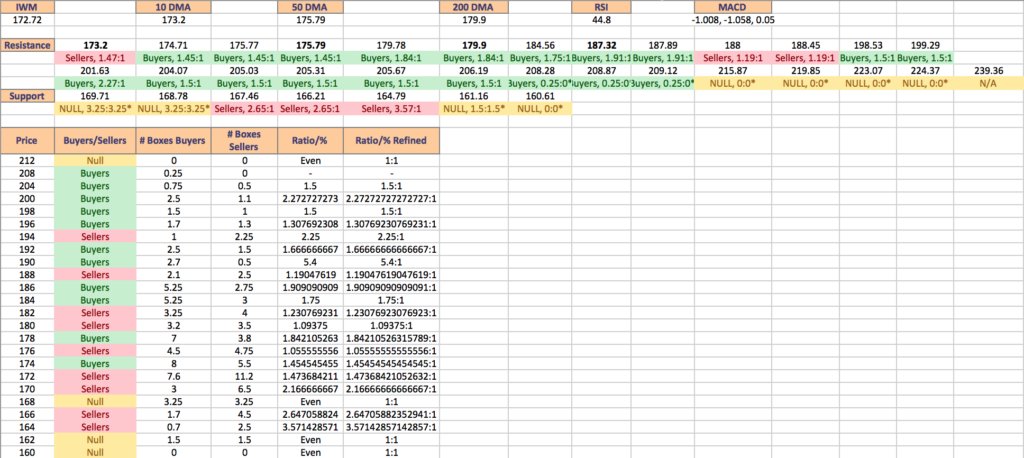
IWM’s Resistance Levels For The Past Two Years & Their Volume Sentiment (BOLD denotes moving averages):
$173.20 – Sellers – 1.47:1 (10 DMA)
$174.71 – Buyers – 1.45:1
$175.77 – Buyers – 1.45:1
$175.79 – Buyers – 1.45:1 (50 DMA)
$179.78 – Buyers – 1.84:1
$179.90 – Buyers – 1.84:1 (200 DMA)
$184.56 – Buyers – 1.75:1
$187.32 – Buyers – 1.91:1
$187.89 – Buyers – 1.91:1
$188 – Sellers – 1.19:1
$188.45 – Sellers – 1.19:1
$198.53 – Buyers – 1.5:1
$199.29 – Buyers – 1.5:1
$201.63 – Buyers – 2.27:1
$204.07 – Buyers – 1.5:1
$205.03 – Buyers – 1.5:1
$205.31 – Buyers – 1.5:1
$205.67 – Buyers – 1.5:1
$206.19 – Buyers – 1.5:1
$208.28 – Buyers – 0.25:0*
$208.87 – Buyers – 0.25:0*
$209.12 – Buyers – 0.25:0*
$215.87 – NULL – 0:0*
$219.85 – NULL – 0:0*
$223.07 – NULL – 0:0*
$224.37 – NULL – 0:0*
$239.36 – N/A*
IWM’s Support Levels for that time period are below:
$169.71 – NULL – 1:1
$168.78 – NULL – 1:1
$167.46 – Sellers – 2.65:1
$166.21 – Sellers – 2.65:1
$164.79 – Sellers – 3.57:1
$161.16 – NULL – 1:1
$160.61 – NULL – 0:0*
IWM’s Point & Figure price levels are listed below, with their respective volume sentiment:
$212 – NULL – 0:0*
$208 – Buyers – 0.25:0*
$204 – Buyers – 1.5:1
$200 – Buyers – 2.27:1
$198 – Buyers – 1.5:1
$196 – Buyers – 1.31:1
$194 – Sellers – 2.25:1
$192 – Buyers – 1.67:1
$190 – Buyers – 5.4:1
$188 – Sellers – 1.19:1
$186 – Buyers – 1.91:1
$184 – Buyers – 1.75:1
$182 – Sellers – 1.23:1
$180 – Sellers – 1.09:1
$178 – Buyers – 1.84:1
$176 – Sellers – 1.06:1
$174 – Buyers – 1.45:1
$172 – Sellers – 1.47:1
$170 – Sellers – 2.17:1
$168 – NULL – 1:1
$166 – Sellers – 2.65:1
$164 – Sellers – 3.57:1
$162 – NULL – 1:1
$160 – NULL – 0:0*
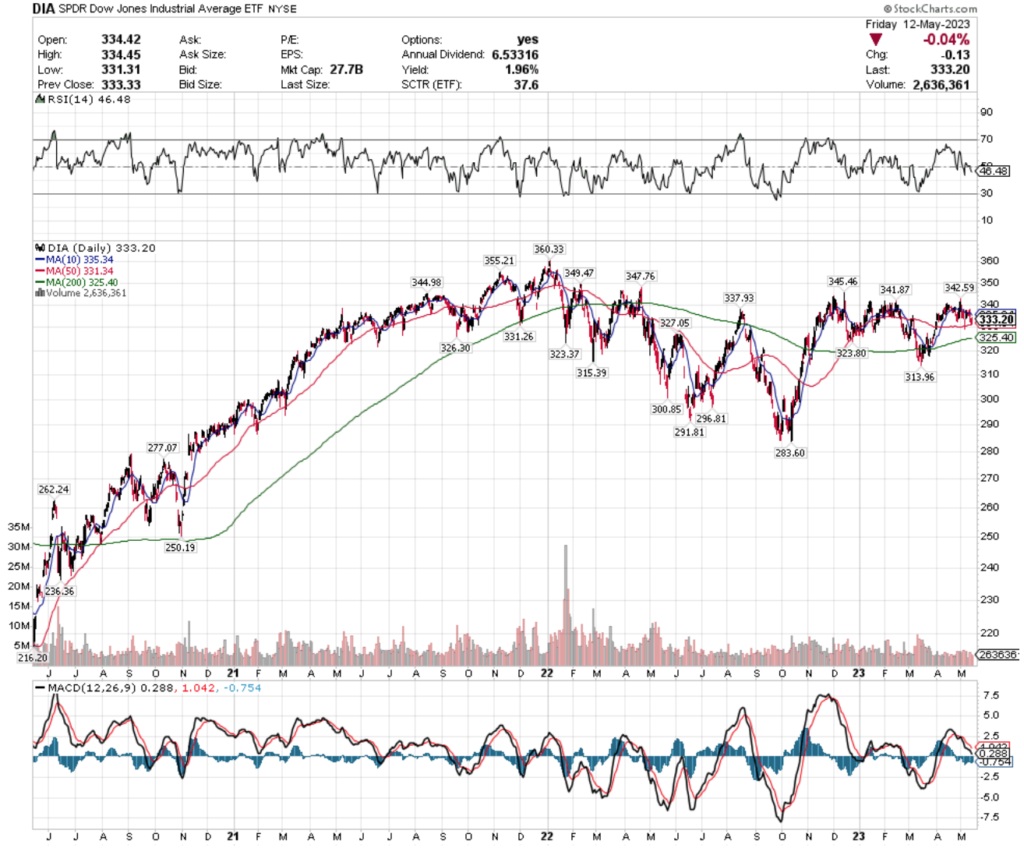
DIA, the SPDR Dow Jones Industrial Average ETF’s Volume Analysis At Support & Resistance Points
DIA is an ETF that is used to track the performance of the Dow Jones Industrial Average, whose Point & Figure Chart had closer to 3 year’s worth of data in the view, which called for using a 3 year candlestick chart for finding support & resistance levels.
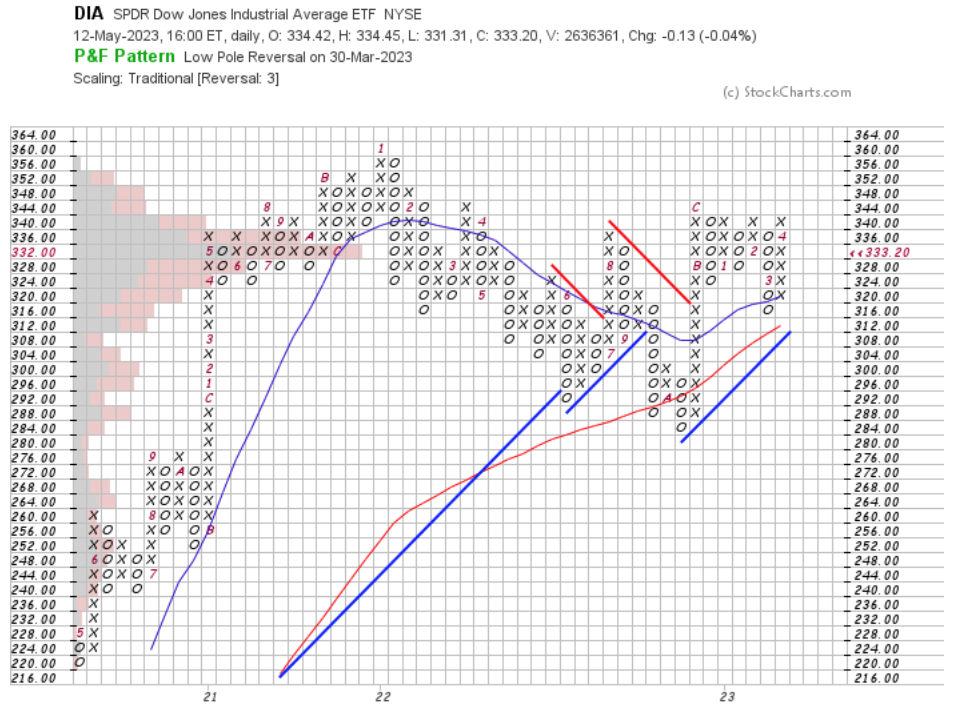
DIA closed at $333.20/share on 5/12/2023, placing it in the $332 box in the data, which is currently favoring the Buyers 1.20:1.
The next 2 higher boxes are both in favor of the Buyers ($336 = 1.01:1 & $340 = 1.71:1), with the next 4 lower boxes being in favor of the Sellers ($328 = 1.35:1, $324 = 1.19:1, $320 = 1.4:1 & $316 = 1.88:1).
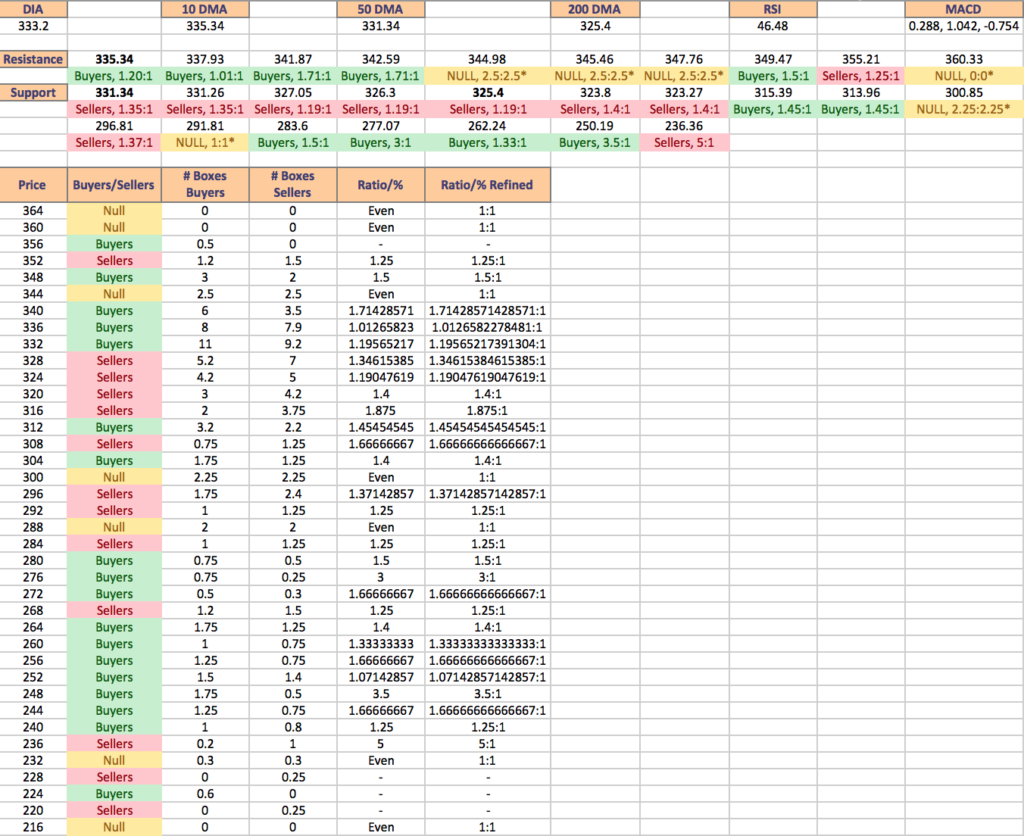
DIA’s Resistance Levels For The Past Two Years & Their Volume Sentiment (BOLD denotes moving averages):
$335.34 – Buyers – 1.2:1 (10 DMA)
$337.93 – Buyers – 1.01:1
$341.87 – Buyers – 1.71:1
$342.59 – Buyers – 1.71:1
$344.98 – NULL – 1:1
$345.46 – NULL – 1:1
$347.76 – NULL – 1:1
$349.47 – Buyers – 1.5:1
$355.21 -Sellers – 1.25:1
$360.33 – NULL – 0:0*
DIA’s Support Levels for that time period are below (BOLD denotes moving average levels):
$331.34 – Sellers – 1.35:1 (50 DMA)
$331.26 – Buyers – 1.01:1
$327.05 – Sellers – 1.19:1
$326.30 – Sellers – 1.19:1
$325.40 – Sellers – 1.19:1 (200 DMA)
$323.80 – Sellers – 1.4:1
$323.27 – Sellers – 1.4:1
$315.39 – Buyers – 1.45:1
$313.96 – Buyers – 1.45:1
$300.85 – NULL – 1:1
$296.81 – Sellers – 1.37:1
$291.81 – NULL – 1:1
$283.60 – Buyers – 1.5:1
$277.07 – Buyers – 3:1
$262.24 – Buyers – 1.33:1
$250.19 – Buyers – 3.5:1
$236.36 – Sellers – 5:1
DIA’s Point & Figure price levels are listed below, with their respective volume sentiment:
$364 – NULL – 0:0*
$360 – NULL – 0:0*
$356 – Buyers – 0.5:0*
$352 – Sellers – 1.25:1
$348 – Buyers – 1.5:1
$344 – NULL – 1:1
$340 -Buyers – 1.71:1
$336 – Buyers – 1.01:1
$332 – Buyers – 1.20:1
$328 – Sellers – 1.35:1
$324 – Sellers – 1.19:1
$320 – Sellers – 1.4:1
$316 – Sellers – 1.88:1
$312 – Buyers – 1.45:1
$308 – Sellers – 1.67:1
$304 – Buyers – 1.4:1
$300 – NULL – 1:1
$296 – Sellers – 1.37:1
$292 – Sellers – 1.25:1
$288 – NULL – 1:1
$284 – Sellers – 1.25:1
$280 – Buyers – 1.5:1
$276 – Buyers – 3:1
$272 – Buyers – 1.67:1
$268 – Sellers – 1.25:1
$264 – Buyers – 1.4:1
$260 – Buyers – 1.33:1
$256 – Buyers – 1.67:1
$252 – Buyers – 1.07:1
$248 – Buyers – 3.5:1
$244 – Buyers – 3.5:1
$240 – Buyers – 1.25:1
$236 – Sellers – 5:1
$232 – NULL – 1:1
$228 – Sellers – 0.25:0*
$224 – Buyers – 0.6:0*
$220 – Sellers – 0.25:0*
$216 – NULL – 0:0*
Tying It All Together
Volume is one of the best indicators of investor sentiment that can be applied to any time frame, price level, or price range to help paint a better picture of the market’s behavior.
While it does not predict what will happen in the future as market conditions are ever changing & new variables may be of more importance now than they were when these volume levels were read, it can provide a reference as to how investors may behave when the same levels are approached again.
This document was intended to show investor sentiment at levels of support & resistance that are currently relevant to their price levels, while also providing more widespread data that can be used as prices move away from the levels of support & resistance mentioned above.
It can be combined with a current analysis of markets to give more clarity into how investors have historically behaved when prices have been in the price levels listed during the relevant time periods to provide additional detail to your analysis.
It is not intended to serve as investment recommendations or advice.
*** I DO NOT OWN SHARES OR OPTIONS CONTRACT POSITIONS IN SPY, QQQ, IWM or DIA AT THE TIME OF PUBLISHING THIS ARTICLE ***