SPY, the SPDR S&P 500 ETF lost -0.79% over the past week, in a week filled with earnings reports, the Federal Reserve & ECB’s Interest Rate Decision & other data points flooding in.
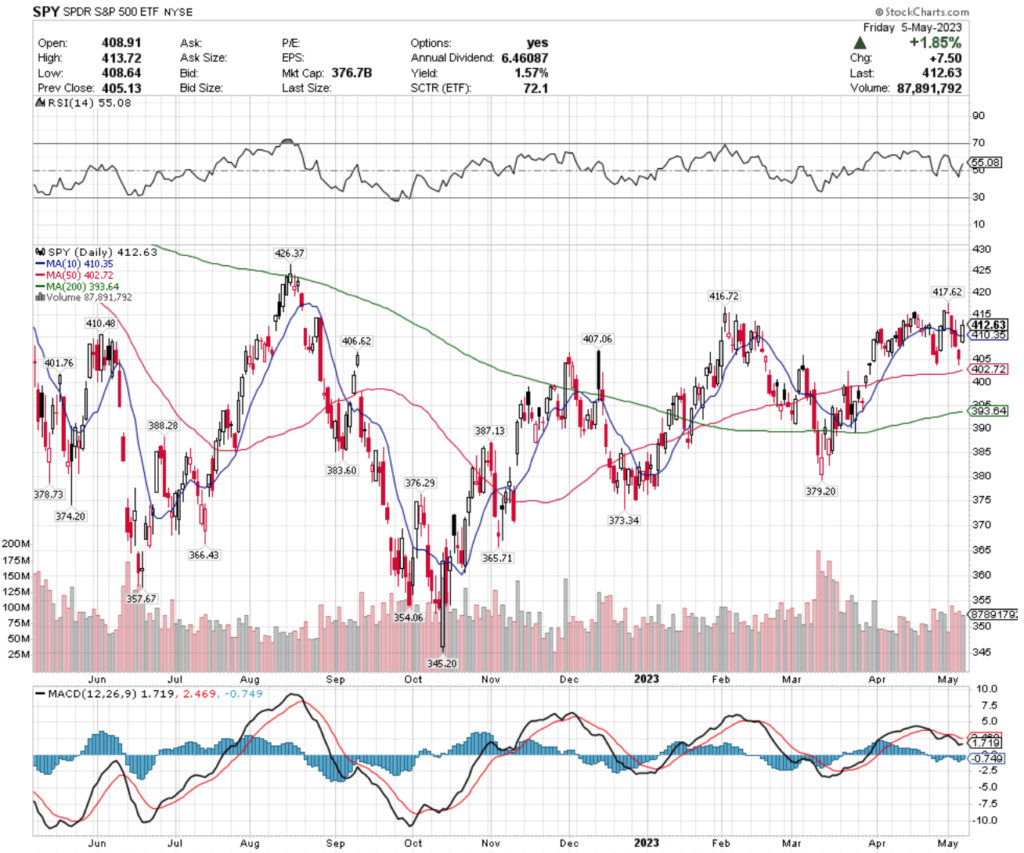
Volumes were heavier than they’ve been for the prior month, but were still not as active as in March.
SPY’s MACD is trying to flatten out to cross bullishly, while their RSI remains in the neutral range, signaling that unless there is some positive momentum stemming from Friday’s +1.85% gap up it looks like the $405/share level will be tested again.
SPY has support at the $410.48, $410.35 (10 day moving average), $407.06 & $406.62/share price levels before the $405 mark that it has had difficulty crossing through, with resistance at the $416.49, $416.72, $417.62 & $426.37/share price levels.
QQQ, the Invesco QQQ Trust ETF nudged forward 0.1% over the past week, fairing the best of the indexes we cover in this section for the week.
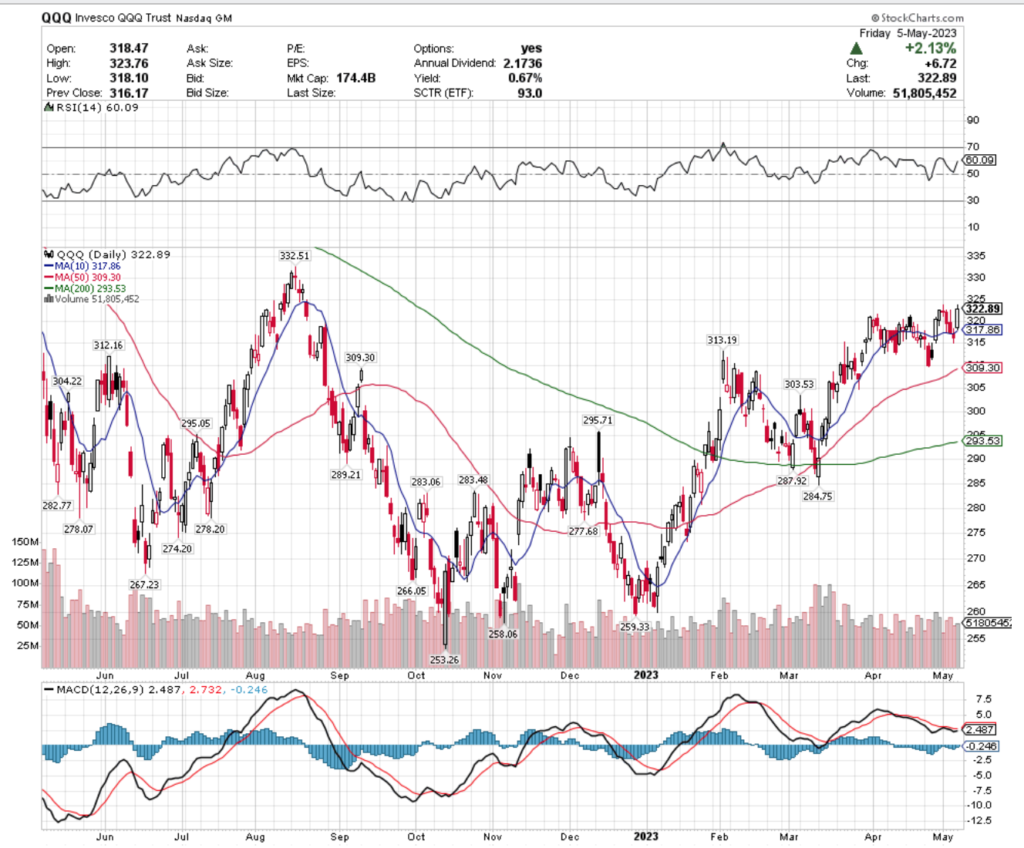
Their technicals are looking similar to SPY’s, with a bearish, but flattening MACD & an RSI that entered into the overbought end of neutral with Friday’s +2.13% gap up session.
Volumes have been consistent, but like SPY, if the momentum of Friday isn’t able to be carried into the new week, there looks to be a resumption of the rest of the week’s declines for QQQ.
QQQ has support at the $317.86 (10 day moving average), $313.19, $312.16 & $309.30/share price levels, with resistance at the $331.19, $332.51, $346.78 & $368.99/share price levels.
IWM, the iShares Russell 2000 ETF lost -0.43% over the past week, despite having the most volatile of the three indexes.
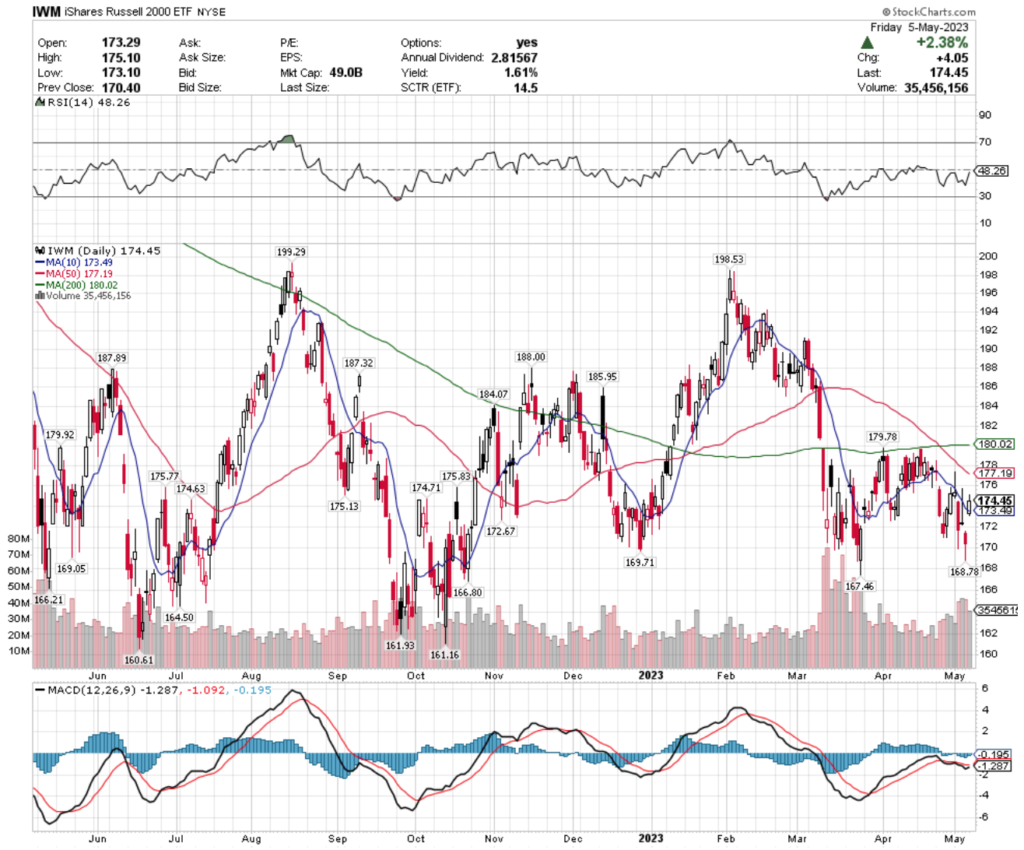
Their MACD is similar to SPY’s & QQQ’s after Friday’s +2.38% gap up session helped to flatten out a bearish trending indicator reading.
IWM’s RSI is neutral, with above average volume this past week compared to the year prior.
IWM has support at the $173.49 (10 day moving average), $172.67, $169.71 & $169.05/share price levels & resistance at the $174.63, $174.71, $175.13 & $175.77/share price levels.
Let’s dive into some of the best & worst performing sectors & geo-locations in the market, based on technical performance rankings!
Italy (EWI), Robotics & Artificial Intelligence (BOTZ), Sports & Gaming Betting (BETZ) & International Equities (SCHF) Are All Bullishly Leading The Market
EWI, the iShares MSCI Italy Capped ETF has gained +23.9% over the past year, improving an impressive +52.45% since their 52-week low in October of 2022 (ex-distributions).
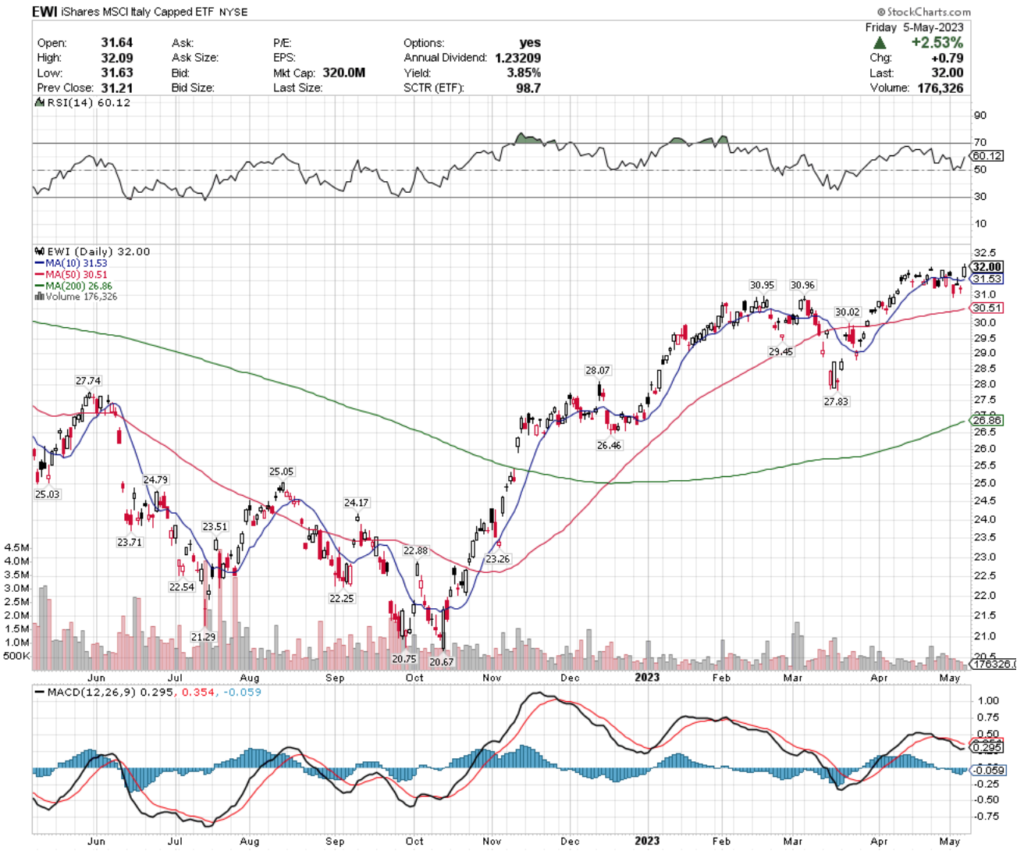
Their RSI is neutral at 50 & while their MACD is currently bearish, it is beginning to make a run at turning bullish after the past couple of weeks’ consolidation range & Friday’s +2.53% gap up.
Volume has been far below average compared to the year prior, signaling that investors are unsure of where they value the ETF.
While EWI offers a 3.85% distribution yield for long-term holders, a protective options strategy would provide better cushion against losses in the near-term, while watching how they behave at support levels before entering or adding to a position.
EWI has support at the $31.53 (10 day moving average), $30.96, $30.95 & $30.51/share (50 day moving average) price levels, with resistance overhead at the $32.02, $32.18, $32.46 & $32.47/share price levels (from 2022, viewing 2 year chart).
BOTZ, the Global X Robotics & Artificial Intelligence Thematic ETF has climbed +9.2% over the past year, adding +45.99% since their 52-week low in October of 2022 (ex-distributions).
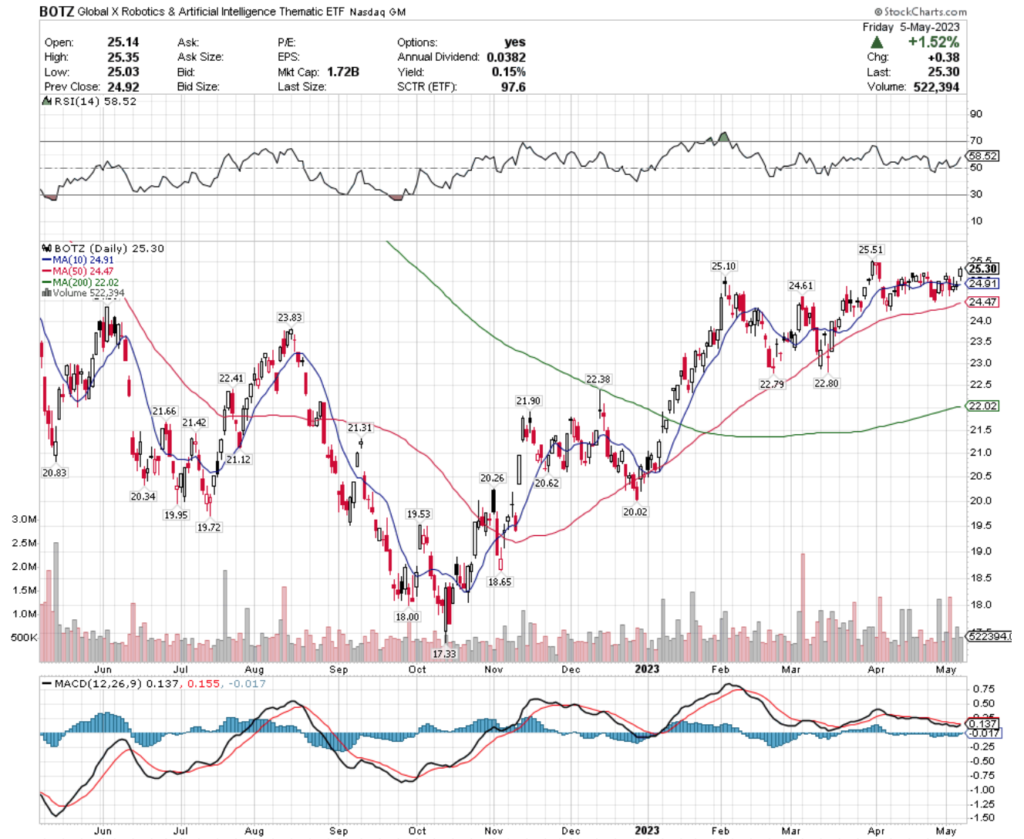
Their MACD is on the verge of bullishly crossing over, after spending much of April in a consolidated price range.
Their RSI is on the overbought end of neutral (in part due to Friday’s 1.52% gap up), with recent trading volumes being about average compared to the year prior.
With a tiny 0.15% distribution yield, there is no cushion against a price correction, making an options strategy the best near-term choice while waiting to see how they behave at key support levels.
BOTZ has support at the $25.10, $24.91 (10 day moving average), $24.61 & $24.47/share (50 day moving average) price levels, with resistance at the $25.51, $25.75, $26.53 & $27.39/share price levels (in 2022, using a 2 year chart).
BETZ, the Roundhill Sports Betting & Gaming ETF added +2.45% over the past year, gaining +34.16% from their 52-week low in September of 2022 (ex-distributions).
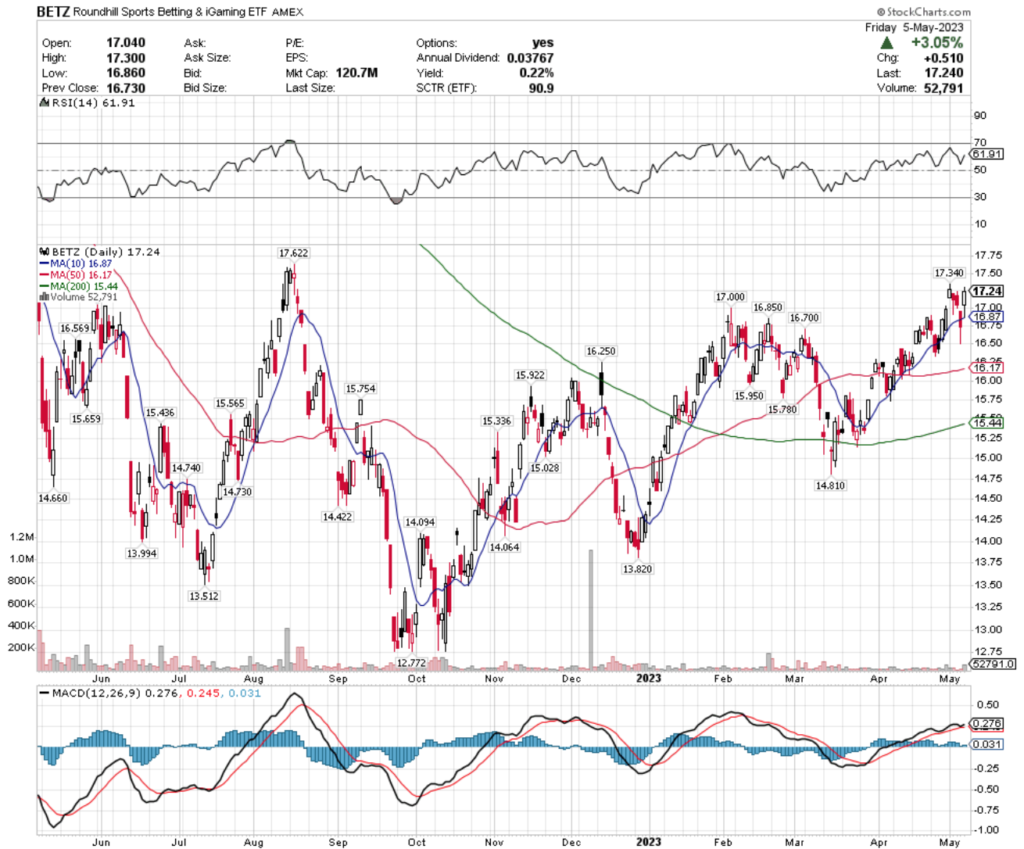
They too have an RSI that is on the overbought end of neutral at ~62, while investors show uncertainty & have been trading in low volume.
Their MACD lines are pressed right against one another & their modest 0.22% distribution yield for long-term shareholders will provide limited cushion against losses, making it important to have an insurance policy in place, whether it be through buying puts, selling calls or another strategy, while waiting to see how they behave at support levels.
BETZ has support at the $17, $16.87 (10 day moving average), $16.85 & $16.70/share price levels, with resistance at the $17.34, $17.62, $17.66 & $18.20/share price ranges.
SCHF, the Schwab International Equity ETF has improved +9.92% over the past year, adding +31.17% from their 52-week low in October of 2022 (ex-distributions).
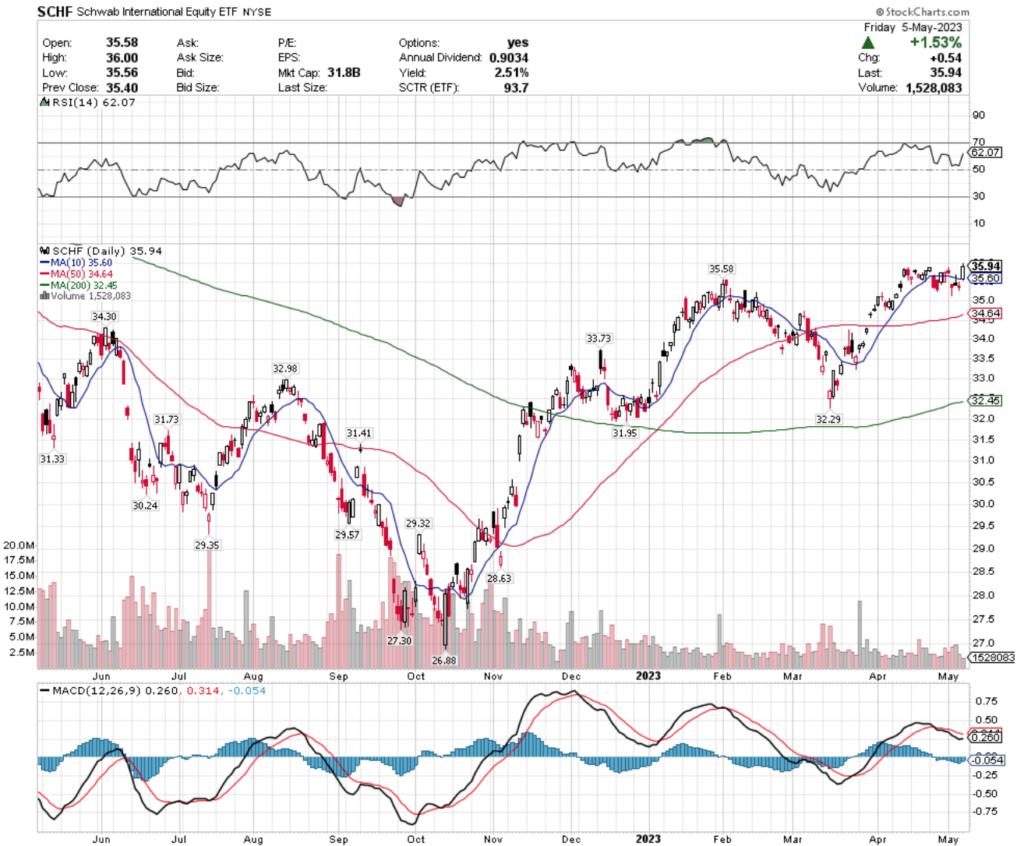
They too have an RSI in the low 60’s, signaling a rise towards overbought conditions, with very unconvincing low volume in 2023, compared to the year prior.
Their MACD is heading in the direction of a bullish crossover in the near-term, if the momentum from Friday’s +1.53% gap up is sustained in early next week.
While they offer a 2.51% cushion in terms of a distribution yield for long-term shareholders, a defensive options position would be better suited for while you wait to see how they behave around their support levels in the coming weeks.
SCHF has support at the $35.60 (10 day moving average), $35.58, $34.64 (50 day moving average) & $34.30/share price levels, with resistance at the $35.96, $36.04, $36.23 & $36.49/share price levels.
Diversified Commodity Strategy (PDBC), U.S. Broker Dealers & Securities Exchanges (IAI), U.S. Preferred Stocks (PFF) & Chinese Technology (CQQQ) Are All Bearishly Lagging The Market
PDBC, the Invesco Optimum Yield Diversified Commodity Strategy No K-1 ETF has fallen -18.11% over the past year, dropping -33.19% from their 52-week high in June of 2022, but reclaiming +3.66% from their 52-week low in March of 2023 (ex-distributions).
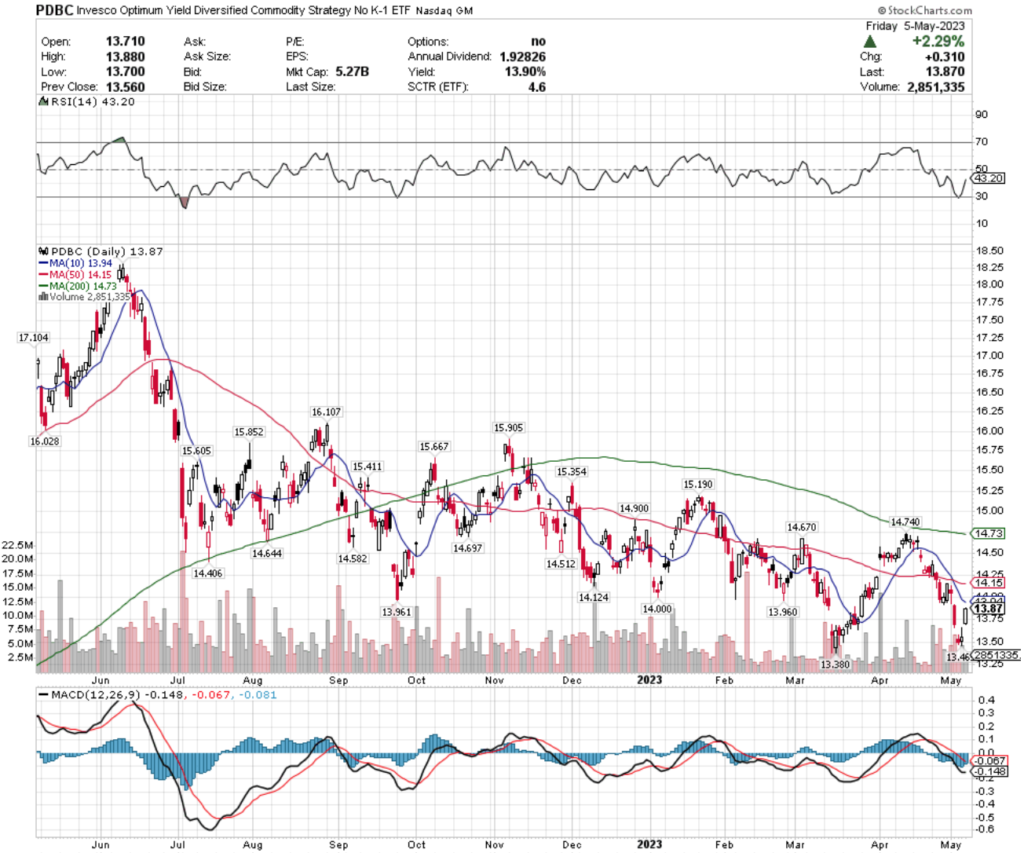
Friday’s +2.29% gap up helped to jolt their RSI from almost oversold levels up to the oversold end of neutral at 43.
Their MACD is beginning to move towards a bullish crossover in the near-term if they are able to maintain any momentum into the new week, but their weaker than average volumes cast doubt on that happening.
PDBC pays a 13.9% distribution year to long-term shareholders, which will provide a cushion against losses until the $11.94/share level, if the shares are held for a year or longer.
However, it would be wisest to wait & see how they behave against their support levels, or else to take a near-term approach with an options strategy while waiting to purchase shares at a less volatile time in the markets.
PDBC has support at the $13.47, $13.38, $13.02 & $11.74/share price levels (using a two year chart), with resistance at $13.94 (10 day moving average), $13.96, $14 & $14.12/share price levels.
IAI, the iShares U.S. Broker-Dealers & Securities Exchanges ETF has nudged forward +0.63% over the past year, dropping -16.69% from their 52-week high in February 2023, while regaining +9.14% since their 52-week low in July of 2022 (ex-distributions).
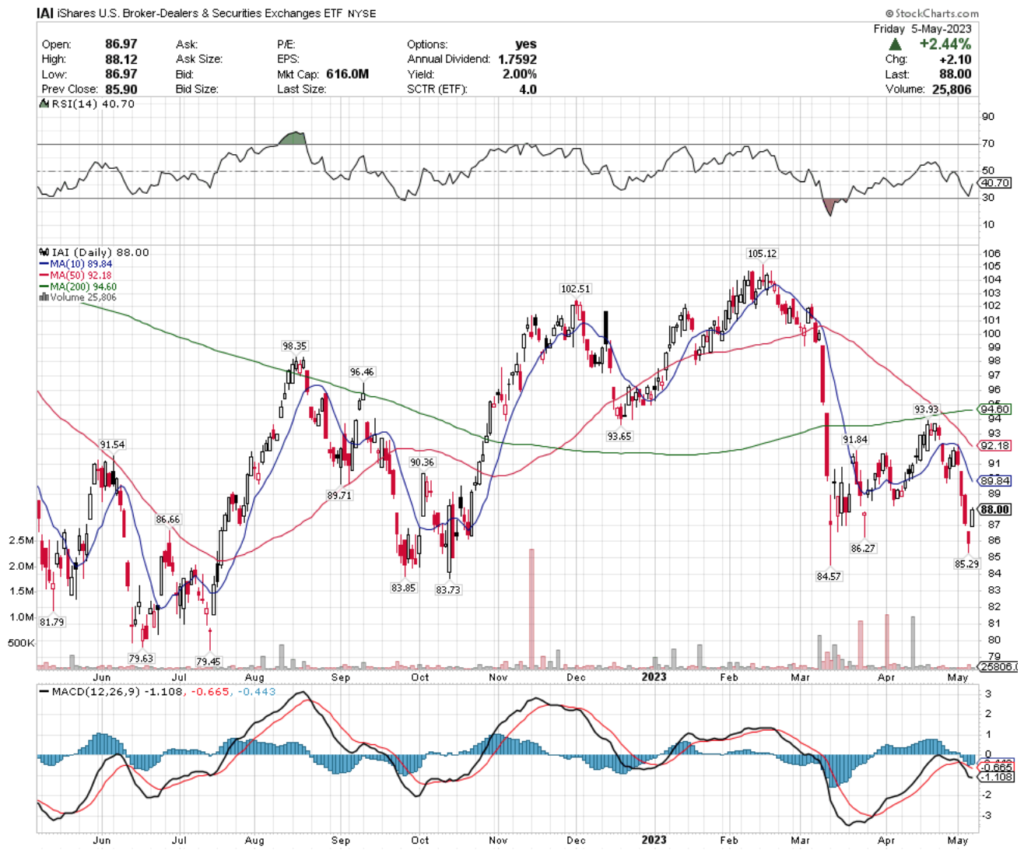
With similar technicals to PDBC, IAI’s RSI also rebounded nicely from near oversold territory to the oversold end of neutral at 40 due to Friday’s +2.44% gap up day.
They also are lacking in volume compared to the year prior, signaling uncertainty in where shareholders value their shares, with a MACD that could bullishly crossover this week, if there is some momentum carried over into the new week from Friday’s price action.
Unfortunately, IAI’s distribution yield for long-term holders is only 2%, providing much less cushion from losses, meaning it is best to play a defensive options strategy now, or wait to see how their support levels hold up in the near-term before entering a position.
IAI has support at the $86.66, $86.27, $85.29 & $84.57/share price limits, with resistance at the $89.71, $89.84 (10 day moving average), $90.36 & $91.54/share price levels.
PFF, the iShares U.S. Preferred Stock ETF has shed -4.96% over the past year, falling -15.93% from their 52-week high in August of 2022 & only gaining +4.09% since their 52-week low in October of 2022 (ex-distributions).
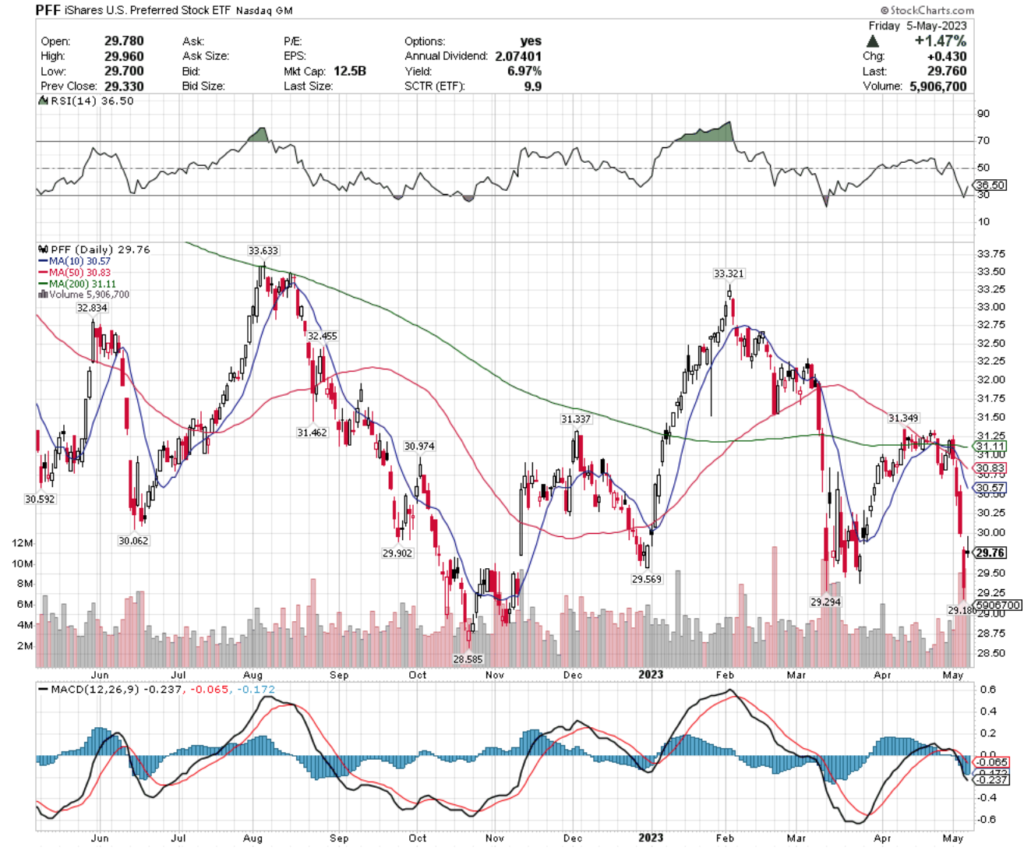
The situation for PFF looks a bit more dire than the previous two names.
Their MACD is in bearish freefall, after 5 straight steep declining sessions before Friday’s +1.47% recovery.
Volumes have recently been above average & their RSI is still closer to oversold than neutral, signaling more future losses in the near-term.
PFF does pay a 6.97% distribution yield, which will cover some losses, but a defensive options strategy with a “wait & see” approach to long shares looks best in the near-term while we wait to see how it behaves at its support levels.
PFF has support at the $29.57, $29.29, $29.18 & $28.59/share price levels, with resistance at the $29.90, $30.06, $30.57 (10 day moving average) & $30.83/share (50 day moving average) price levels.
CQQQ, the Invesco China Technology ETF inched forward +2.27% over the past year, however they fell -20.36% from their 52-week high in June of 2022, but have improved +38.85% since their 52-week low in October of 2022 (ex-distributions).
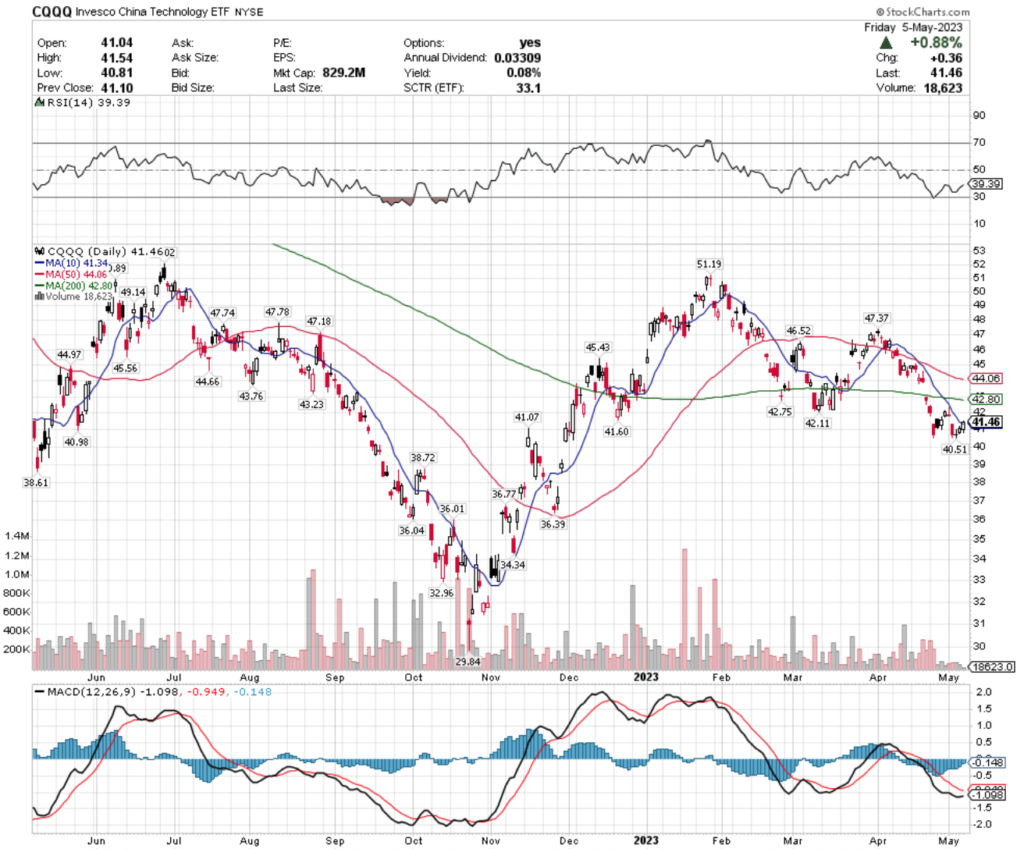
CQQQ is beginning to show signs of an impending bullish MACD crossover, however their recent performance was on extremely light volume compared to the year’s average.
Their RSI is moving back towards the oversold end of neutral, but there appears to be a tough test in the form of a shooting star candle at the top of the window that they are trying to fill.
With such a small 0.08% distribution yield for long-term shareholders, this is another one in the “Wait & see” or trade options defensively around name until we see how its support levels hold up in the near-term.
CQQQ has support at the $41.34 (10 day moving average), $41.07, $40.98 & $40.51/share price levels, with resistance at the $41.60, $42.11, $42.75 & $42.80/share (200 day moving average) price levels.
Tying It All Together
Next week’s data kicks off with Wholesale Inventories reported at 10 am on Monday, followed by Fed Senior Loan Survey data at 2 pm.
We also continue quarterly earnings calls on Monday, featuring Paypal, Cabot, Devon Energy, KKR, Novavax, Six Flags, Skyworks Solutions, Tyson Foods & Western Digital, plus others.
Tuesday the NFIB Optimism Index data is released at 6 am.
AirBnb is the big earnings call on Tuesday, with reports from Affirm Holdings, Aramark, Fisker, FoxCorp, H&R Block, Hostess Brands, Mannkind, Occidental Petroleum, Rackspace Technology, Squarespace, Under Armour, WeWork, Wynn Resorts & more.
Much anticipated Consumer Price Index, Core CPI, CPI Y-o-Y & Core CPI Y-o-Y data will be reported at 8:30 am on Wednesday.
Wednesday’s earnings will feature Disney, Cheesecake Factory, Jazz Pharmaceuticals, Reynolds Consumer Products, Roblox, The Trade Desk, Traeger, Valvoline, Wendy’s, Wolverine World Wide & many other companies.
On Thursday the Producer Price Index, Core PPI, PPI Y-o-Y, Core PPI Y-o-Y, Initial Jobless Claims & Continuing Jobless Claims data are all released at 8:30 am.
Thursday’s earnings calls include CyberArk Software, Dillard’s, JD.com, Krispy Kreme, U.S. Foods, Utz Brands & more.
Friday wraps the week up with Import Price Index & Import Price Index Minus Fuel data at 8:30 am, followed by Consumer Sentiment (preliminary) at 10 am, with Embecta & Spectrum Brands reporting earnings.
See you back here next week!
*** I DO NOT OWN SHARES OR OPTIONS CONTRACT POSITIONS IN SPY, QQQ, IWM, EWI, BETZ, BOTZ, SCHF, PDBC, IAI, PFF, or CQQQ AT THE TIME OF PUBLISHING THIS ARTICLE ***