SPY, the SPDR S&P 500 ETF lost -0.25% over the past week & remained in the same range that it’s been in for the past month & a half.
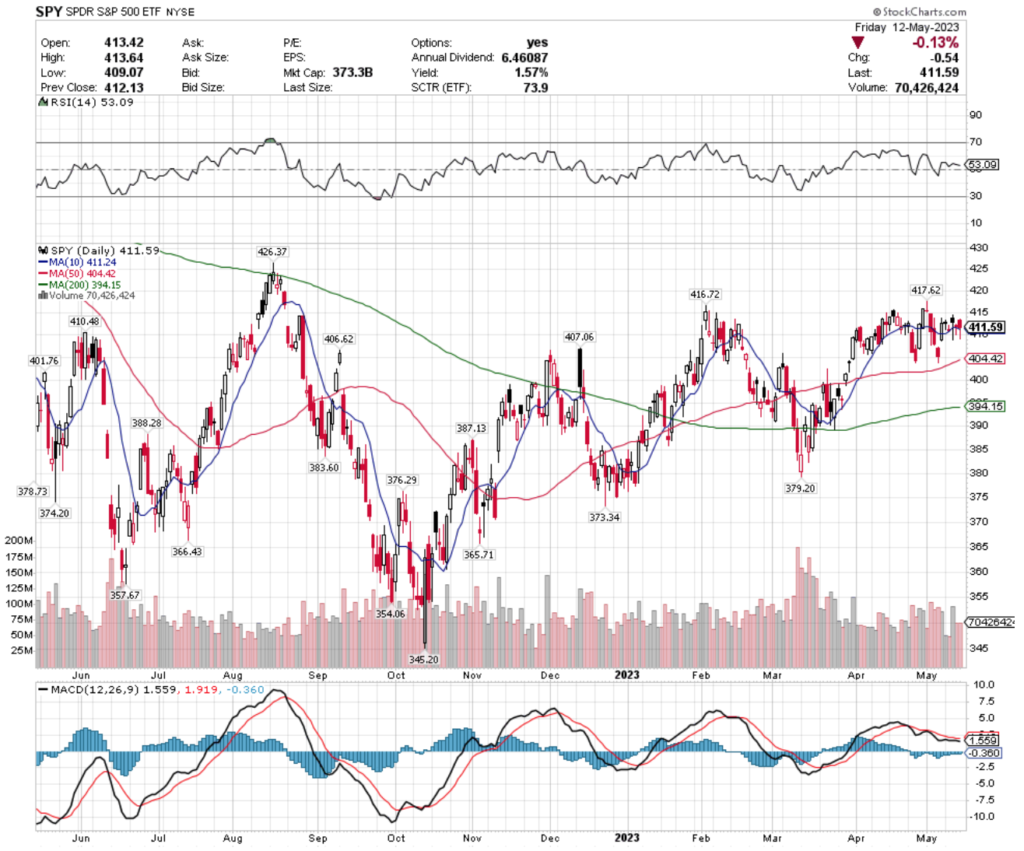
Uncertainty is still in the air, as the last few days’ candlesticks could characterize the past week as “the week of the hanging man”.
SPY’s RSI is still neutral at 53, with volumes slightly dipping from the previous weeks, but remaining in-line with the year prior’s average volume range.
Their MACD is still bearish, but both lines are moving relatively flat as a result of the previous month’s trading range still being in tact.
SPY has support at the $411.24 (10 day moving average), $410.48, $407.06 & $406.62/share price levels, with resistance at the $416.49, $416.72, $417.62 & $426.37/share price levels.
QQQ, the Invesco QQQ Trust ETF climbed +0.66% over the past week, after getting off to a slow start on Monday followed by an upside pivot on Wednesday.
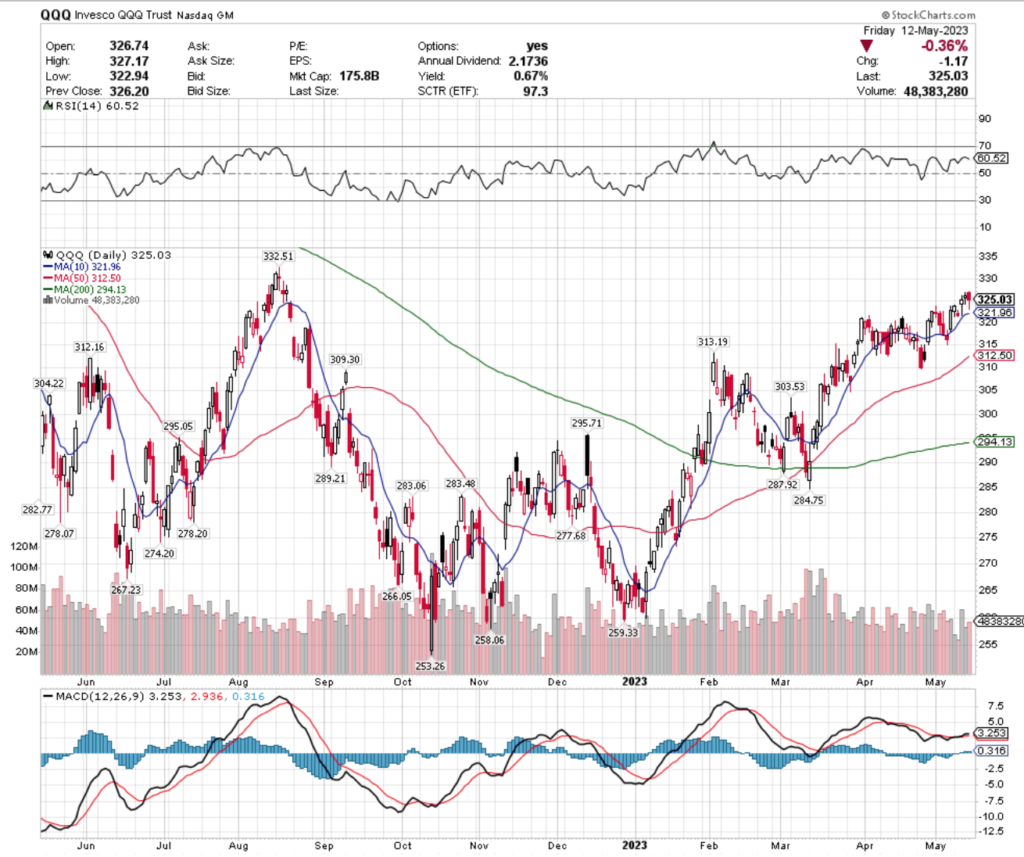
Much like SPY, their past week is also marred with uncertainty when you look at the candles, with Wednesday & Friday being hanging men & Thursday being a spinning top, all of whom’s real bodies stayed relatively in-line with one another.
QQQ’s RSI is on the oversold end of neutral at 60.52, but their volume has waned a bit compared to the year prior’s average this past week.
Their MACD is also relatively flat, with both lines sitting atop one another waiting for the catalyst that will send it in one direction or another.
QQQ has support at the $321.96 (10 day moving average), $313.19, $312.96 (50 day moving average) & $312.16/share price levels, with resistance at the $331.19, $332.51, $346.78 & $368.99/share price levels (resistance levels required a 2 year chart view).
IWM, the iShares Russell 2000 ETF declined -0.99% over the past week, as investors fled from smaller cap names, mostly in favor of the larger NASDAQ components.
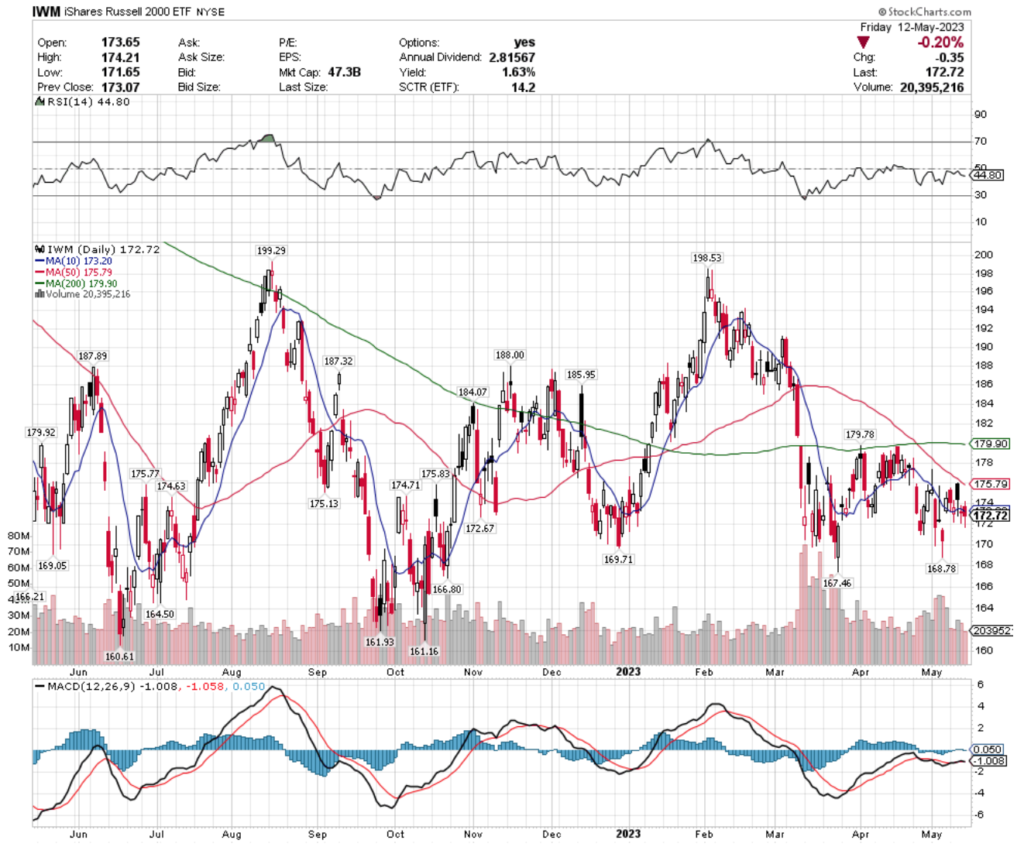
They too were not spared the uncertainty, with a week filled with hanging men & spinning top candlesticks as traders & investors await a signal as to which direction to move in.
Their RSI is on the more oversold end of neutral at 44.8, but trading volumes have remained relatively close to average compared to the year prior.
Their MACD is also in the same state of limbo as SPY’s & QQQ’s, although it is currently giving a slightly bullish reading.
IWM has support at the $172.67, $169.71, $169.05 & $168.78/share price levels, with resistance at the $173.20 (10 day moving average), 174.63, $174.71 & $175.13/share price levels.
Let’s dive into some of the best & worst performing market sectors & geo-locations based on this week’s technical analysis ratings!
Mexico (MEXX), U.S. Home Construction (ITB), Brazil Small Caps (BRF) & Global Gold Miners (RING) Are All Bullishly Leading The Market
MEXX, the Direxion Daily MSCI Mexico Bull 3x Shares ETF has climbed an impressive +84.8% over the past year, gaining an even more impressive +158.51% since their 52-week low in May of 2022 (ex-distributions).
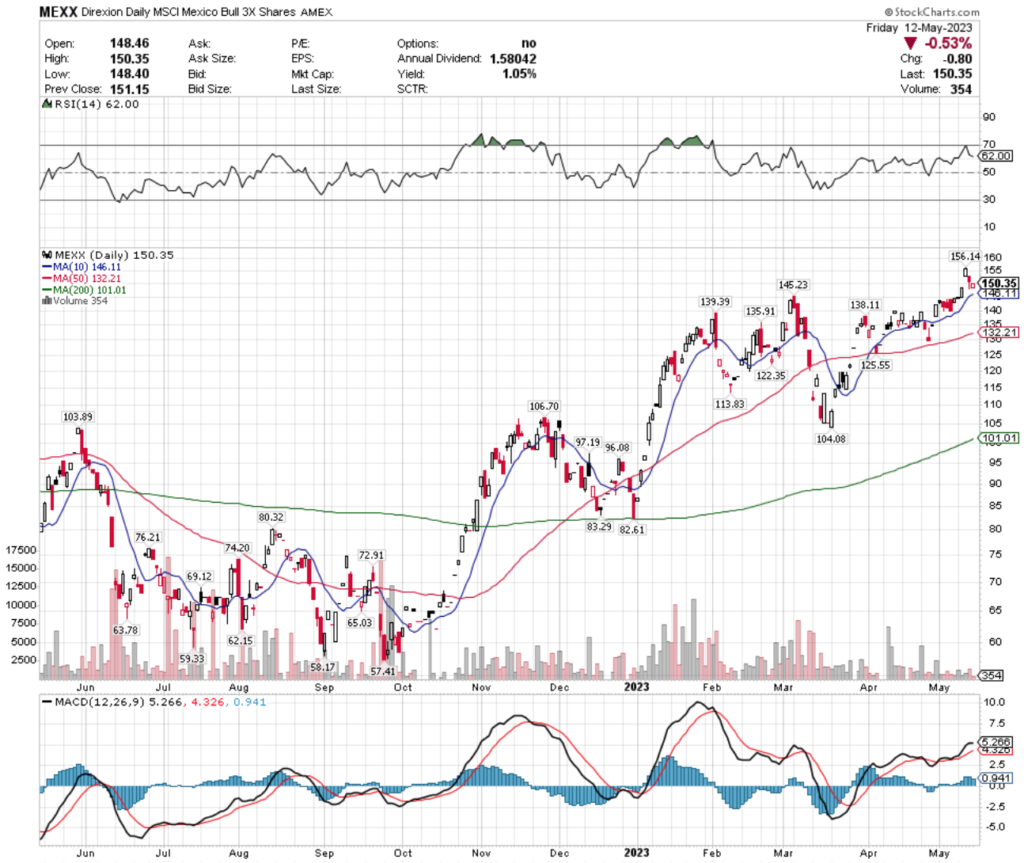
After a year of explosive growth, MEXX’s volumes have declined to well below average compared to the year prior, signaling uncertainty in the near-term by investors.
Their RSI at 62 is on the overbought end of neutral & their MACD is beginning to show signs of a near-term bearish crossover, after two days of declines to fill the window following Wednesday’s gap up.
MEXX offers a 1.05% distribution yield to long-term holders, which will not provide much cushion against any impending consolidation or correction from their current high range for the past year.
This makes it important for investors to have a defensive options strategy in place for insurance such as buying puts or selling calls while they watch to see how MEXX behaves around support levels.
MEXX has support at the $146.11 (10 day moving average), $145.23, $139.39 & $138.11/share price levels, as they try to break out & above their $156.14, $159.55 & $162.16/share resistance levels (latter 2 are from 2019).
For investors who find too much risk in a 3x leveraged ETF, it is possible to get Mexico exposure via the EWW ETF, which was featured in our 4/23/2023 Weekly Notes.
ITB, the iShares U.S. Home Construction ETF has added +30.94% over the past year, improving +57.58% since their 52 week low in June of 2022 (ex-distributions).
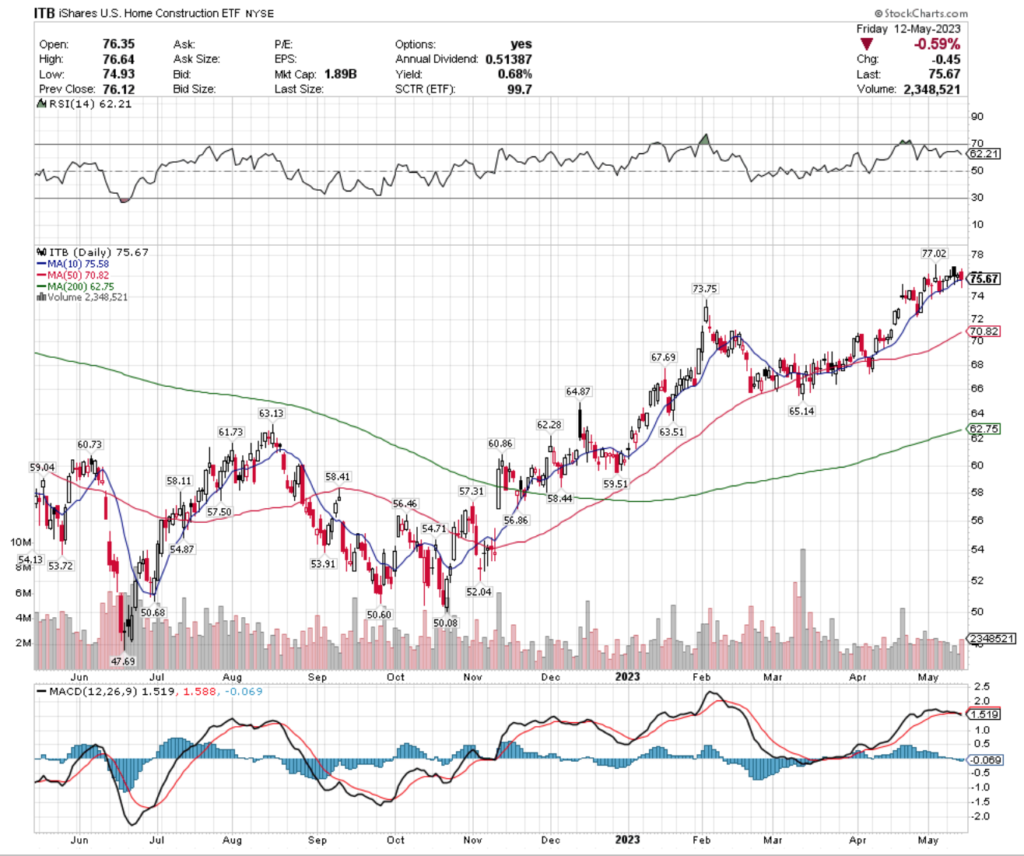
Much like MEXX, ITB & the U.S. Home Construction industry have been very bullish over the past year, but their volumes have waned less in recent days vs. MEXX & are much closer to average compared to the year prior’s levels.
This past week they remained relatively rangebound, with all of the real bodies of their candlesticks remaining at the same general price level, as traders & investors look for a catalyst to push them in one direction or another.
Their RSI is on the overbought end of neutral at 62, but their MACD has bearishly crossed over after spending the past week in a consolidation range.
With a modest 0.68% distribution yield for long-term holders there is limited cushion against losses from these steep price levels, making an insurance strategy against losses appealing while watching to see how they behave around their support levels in the near-term.
ITB has support at the $75.58 (10 day moving average), $73.75, $70.82 (50 day moving average) & $67.69, with resistance overhead at the $77.02, $77.51 & $82.52/share price levels (last 2 resistance levels are from 2021).
We also featured XHB, the SPDR S&P Homebuilders ETF in our 4/30/2023 weekly market review notes.
BRF, the VanEck Vectors Brazil Small-Cap ETF has fallen -3.89% over the past year, while rebounding +26.05% since their 52-week low in March of 2023 (ex-distributions).
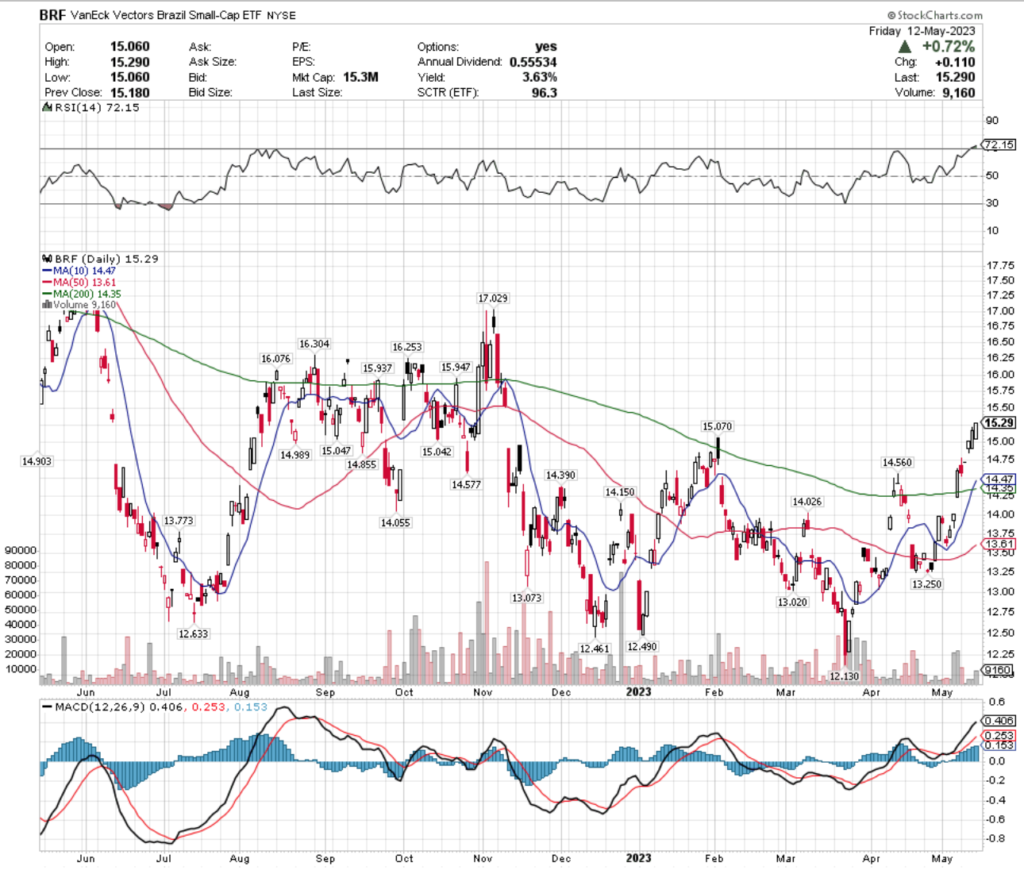
While they have fallen over the past year, their recent recovery in 2023 has shown strength compared to other ETFs, giving them a higher ranking in our system.
Their RSI is overbought currently at 72 after Wednesday’s gap up, but investor sentiment is signaling weakness in the past week as their volumes feel to below average compared to the year prior & their last three candlesticks all remained relatively closely aligned with one another’s real bodies.
Their MACD is still bullish & their 10 day moving average crossed through their 200 day moving average on Thursday of this past week.
With a 3.63% cushion against losses from their distribution yield for long-term shareholders, there is more protection against losses than some other names in this article, but a defensive options strategy would be wise to have as their RSI is signaling a near-term cooldown.
BRF has support at the $15.07, $15.05, $15.04 & $14.99/share price levels, as they try to resistance at the $15.94, $15.95, $16.08 & $16.25/share price levels.
In our April 2, 2023 Market Notes we also covered the BRZU ETF, the Direxion Daily Brazil Bull 2x Shares ETF, which some traders & investors may find more suitable for their portfolio strategy.
RING, the iShares MSCI Global Gold Miners ETF, has gained +7.15% over the past year, adding +55.3% since their 52-week low in September of 2022 (ex-distributions).
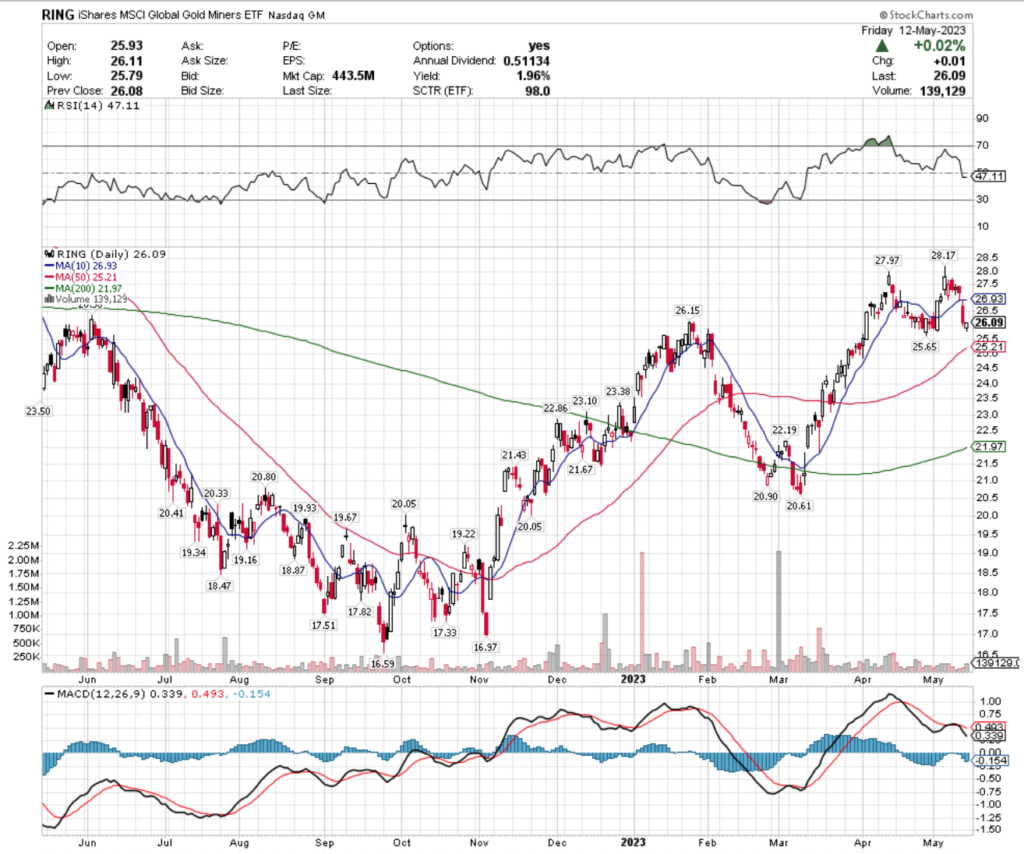
Their MACD has been in bearish decline over the past week, as their RSI dipped just under neutral to 47.
Recent volumes are showing indecisiveness in where investors value their shares, falling to below average levels for the year prior, with their past week’s candlesticks signaling an impending slide that was capped off with a hammer to close Friday’s session & temporarily slow their losses.
RING offers a 1.96% distribution yield, which provides a slight cushion for long-term holders, but like the other names mentioned above, they are best approached with a defensive options strategy while watching how they behave at their support levels in the near-term.
RING has support at the $25.65, $25.21 (50 day moving average), $23.50 & $23.38/share price level, with resistance at the $26.15, $26.36, $26.93 (10 day moving average) & $27.97/share price levels.
Cannabis (POTX), Oil Services (OIH), U.S. Aerospace & Defense (ITA) & Hong Kong (EWH) Are All Bearishly Lagging The Market
POTX, the Global X Cannabis ETF has fallen -62.09% over the past year, dropping -65.78% since their 52-week high in May of 2022, but recovering +3.2% since their 52-week low in April of 2023 (ex-distributions).
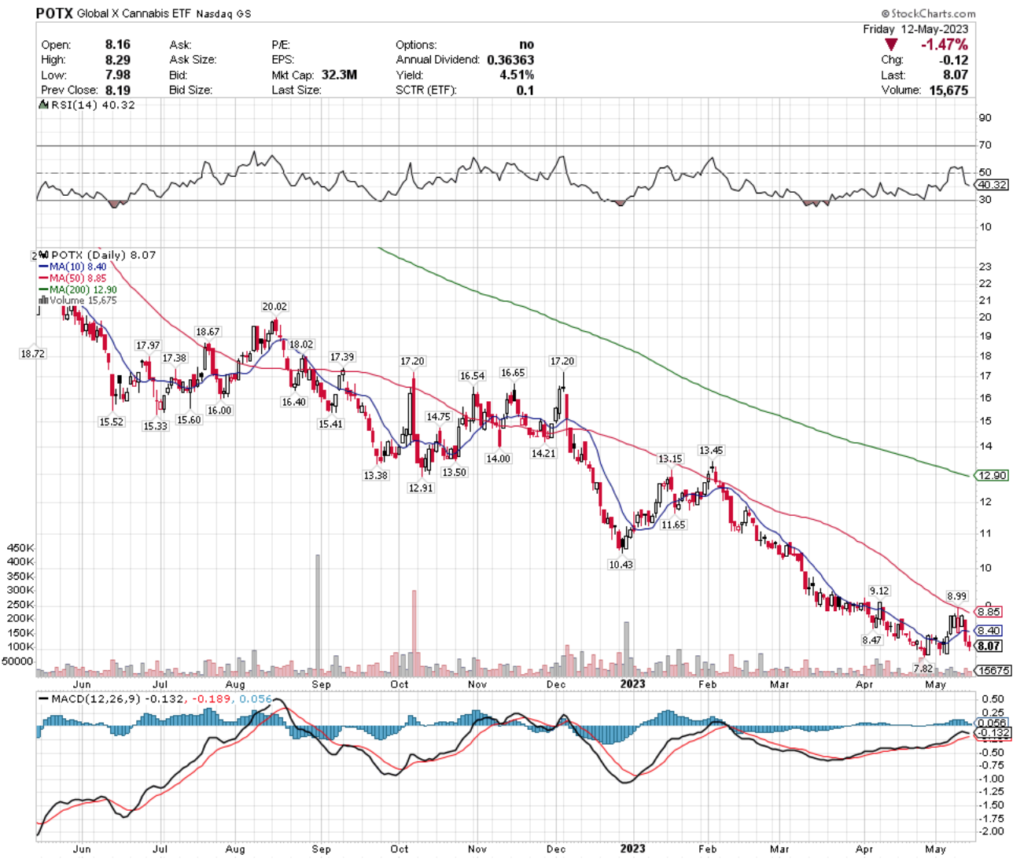
This year has been very bearish for the cannabis industry as a whole & POTX is looking to rebound off of their recent 52-week low.
Their RSI is on the oversold end of neutral at 40, but their MACD looks primed to cross bearishly in the coming trading sessions.
Volumes recently have been below average compared to the year prior, signaling uncertainty among investors.
POTX offers a 4.51% distribution yield for long-term holders, which can help protect against future losses, but in the near-term a defensive options strategy can generate profits for investors while they wait to see how POTX behaves at support levels.
POTX has support at the $7.82 (all time lowest since their inception in 2020), with resistance at the $8.40 (10 day moving average), $8.47, $8.85 (50 day moving average) & $8.99/share price levels.
OIH, the VanEck Vectors Oil Services ETF has lost -2.61% over the past year, falling -24.77% since their 52-week high in January 2023, but has regained +29.23% since their 52-week low in July of 2022 (ex-distributions).
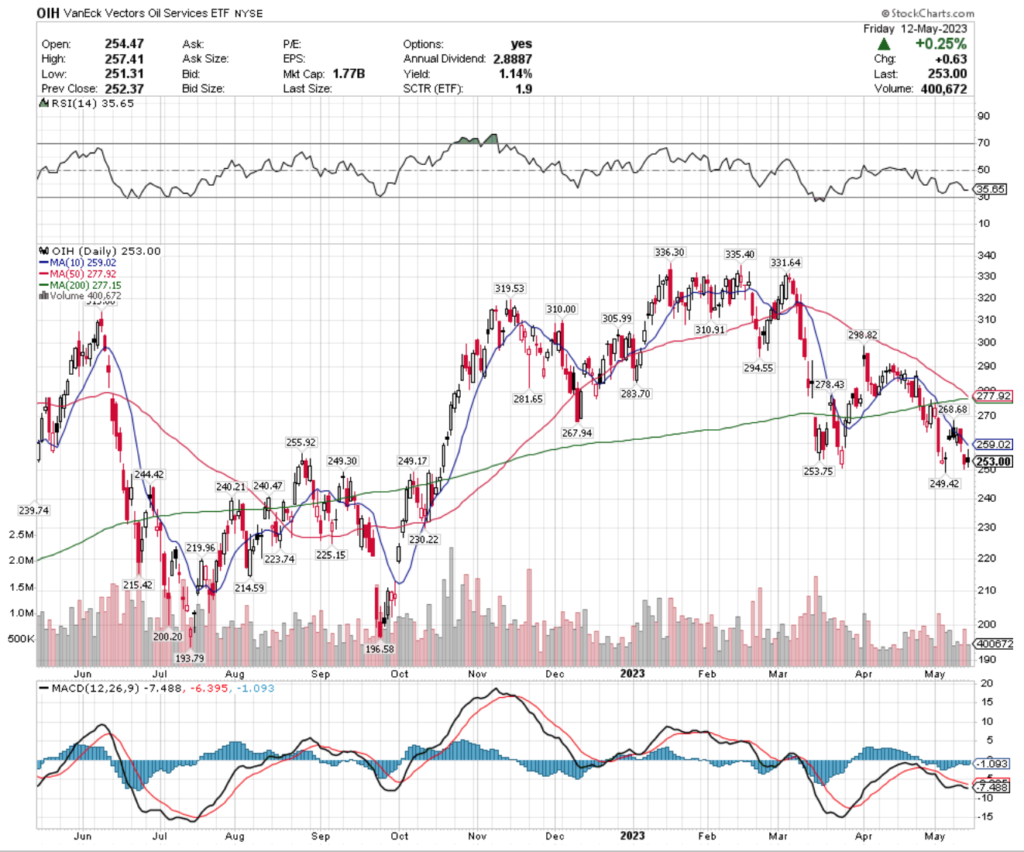
Their RSI is closing in on oversold levels, which is supported by their impending death cross (bearish crossover of the 50 & 200 day moving average), which will add to the declines that began with Thursday’s gap down.
Their MACD is still bearish, but attempting to flatten out for a bullish crossover, but recent trading volumes are below average compared to the year prior, signaling weakness in the near-term as investors are not overly eager to buy shares at these price levels.
OIH offers a 1.14% distribution yield for long-term holders, but again, like everything else in this article, the best course of action currently is to wait & see their behavior around support levels, while employing a defensive strategy using options as an insurance policy.
OIH has support at the $249.42, $249.30, $249.17 & $244.42/share price levels, with resistance at the $253.75, $255.92, $259.02 (10 day moving average) & $267.94/share price levels.
ITA, the iShares U.S. Aerospace & Defense ETF has gained +13.61% over the past year, losing -6.14% from their 52-week high in March of 2023 & improving +21.83% since their 52-week low in September of 2022 (ex-distributions).
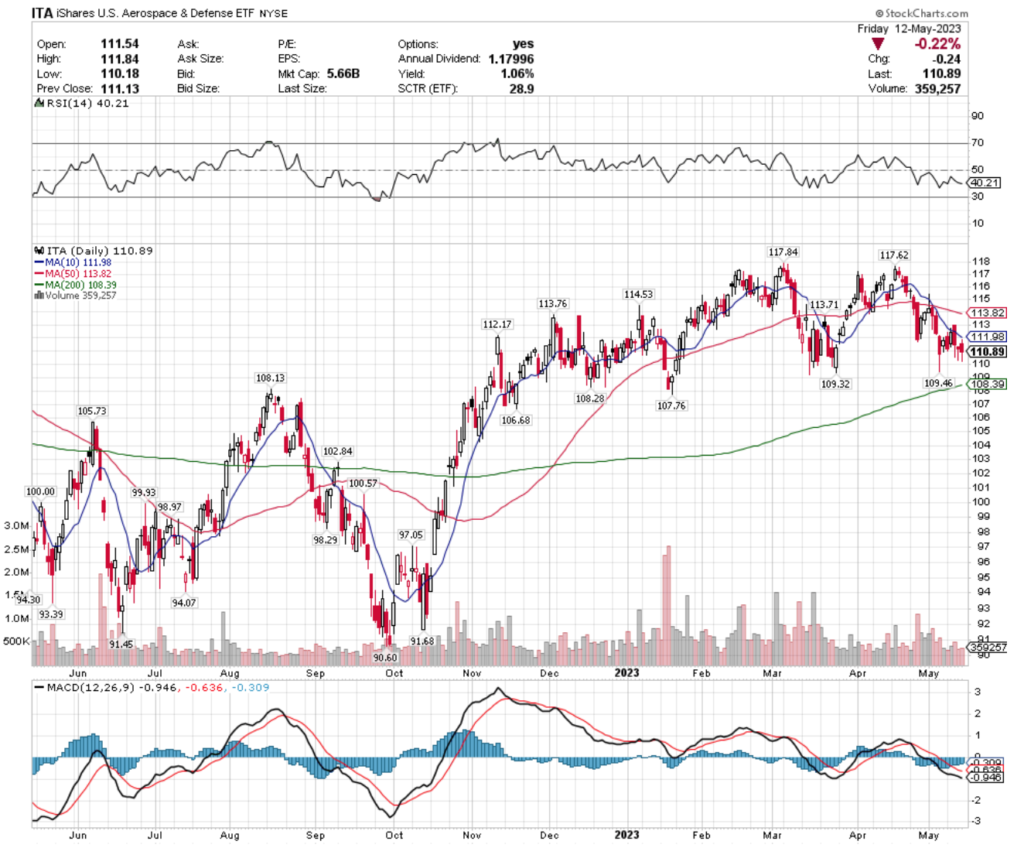
Their MACD has been bearish for the past month, as their price has been in steady decline, with their RSI on the oversold end of neutral at 40.
Recent trading volumes are slightly below average compared to the year prior, signaling caution from investors.
ITA’s 1.06% distribution yield is not enough cushion to protect against any further near-term declines, making it wise to have a defensive strategy as insurance against losses, while watching their behavior around the near-term support levels.
ITA has support at the $109.46, $109.32, $108.28 & $108.13/share price levels, with resistance at the $111.98, $112.17, $113.71 & $113.76/share price levels.
EWH, the iShares MSCI Hong Kong ETF has fallen -3.13% over the past year, dropping -12.19% since their 52-week high in January of 2023, but improving +24% since their 52-week low in October of 2022 (ex-distributions).
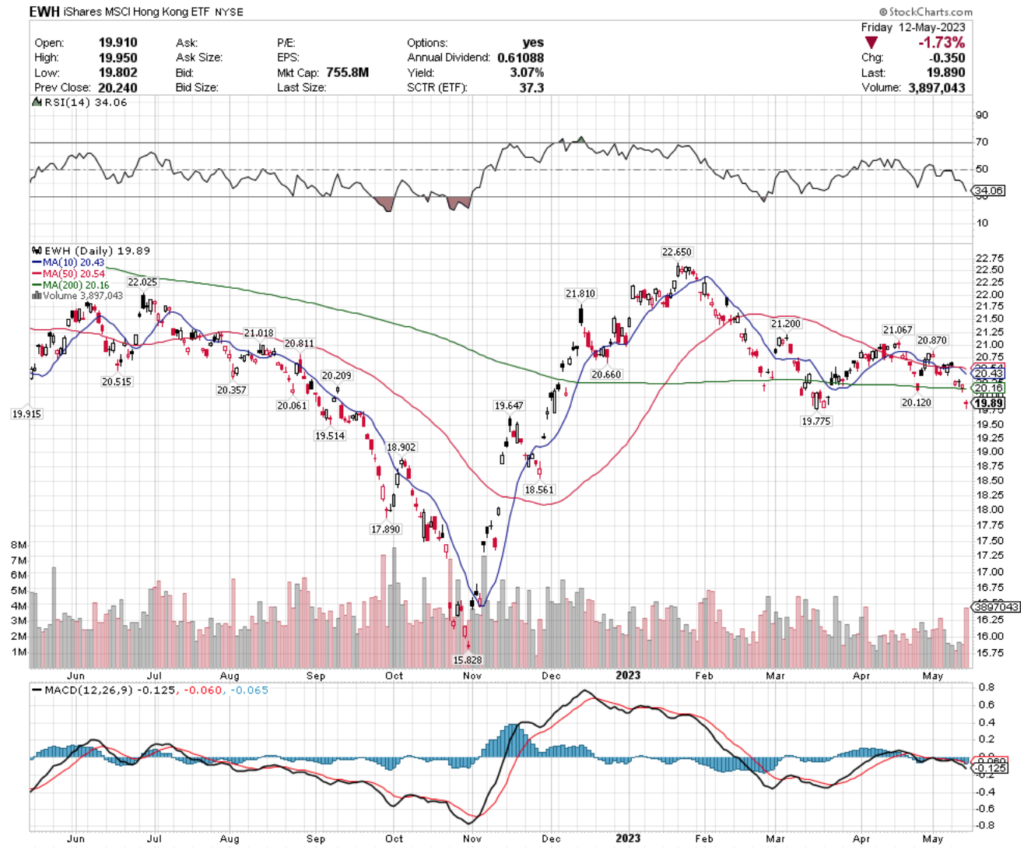
Their RSI is very bearish & approaching oversold territory quickly, after 2 gap downs in the past week, which are setting the tone for the week ahead to be bearish at worst & at best finding them establishing a new, lower price range.
Their MACD is also bearish, and recent trading volumes have been relatively close to average compared to the year prior, signaling that there may be more losses incurred in the near-term.
With a 3.07% distribution yield for long-term holders, there is some protection against losses, but this is another instance where an insurance policy using options is the best idea in the near-term while watching their behavior at their support levels.
EWH has support at the $19.78, $19.65, $19.51 & $18.90/share price levels, with resistance at the $19.92, $20.12, $20.16 (200 day moving average) & $20.21/share price levels.
Tying It All Together
Next week’s data announcements kick off Monday morning at 8:30 am with the Empire Manufacturing Survey data & Chicago Fed President Goolsbee speaking on TV, followed by Minneapolis Fed President Kashkari speaking at 9:15 am.
Monday’s earnings reports include Catalent, Lordstown Motors, Tower Semiconductor & Navitas Semiconductor.
Tuesday is a bit busier, beginning at 8:15 am with Cleveland Fed President Mester Speaking, U.S. Retail Sales & Retail Sales Minus Autos reported at 8:30 am, Industrial Production & Capacity Utilization at 9:15 am, and at 10 am Business Inventories, Home Builder Confidence Index data & Fed Chair Barr testifying.
Also on Tuesday at 10:30 am Richmond Fed President Barkin speaks, followed by New York Fed President Williams at 12:15 pm, Chicago Fed President Goolsbee on TV at 2:30 pm & Atlanta Fed President Bostic & Chicago Fed President Goolsbee speaking on a panel at 7pm.
Tuesday’s earnings calls include Home Depot, Baidu, Sea Limited, Tencent Music, Tupperware & others.
Wednesday has a slower pace on the data front, with Housing Starts & Building Permits data reported at 8:30 am.
Cisco Systems reports earnings on Wednesday, along with Bootbarn Holdings, Copart, Jack In the Box, Synopsys, Take-Two Interactive, Target, TJX, Trip.com Group, Wix.com & more.
On Thursday at 8:30 am the Philadelphia Fed Factory Survey & Initial Jobless Claims data are reported, followed by Fed Governor Philip Jefferson speaking at 9:15 am, Fed Vice Chair for Supervision Barr Testifying at 9:30 am, and at 10 am Existing Home Sales & U.S. Leading Economic Indicators data will be reported.
Walmart is set to report earnings on Thursday, as well as Alibaba Group Holding, Applied Materials, Bath & Body Works, Bilibili, Canada Goose, Deckers Outdoor, Dole, Ross Stores, The Children’s Place & many more.
Friday winds the week down with New York Fed President Williams speaking at 8:45 am & at 11 am Fed Chairman Powell & former Fed Chairman Bernanke will be speaking on a panel.
Friday’s bigger earnings reports include Deere & Footlocker.
See you back here next week!
*** I DO NOT OWN SHARES OR OPTIONS CONTRACT POSITIONS IN SPY, QQQ, IWM, MEXX, ITB, BRF, RING, POTX, OIH, ITA, or EWH AT THE TIME OF PUBLISHING THIS ARTICLE ***