Following yesterday’s analysis of SPY ETF’s relationship between their Price & 200 Day Moving Average it seemed worthwhile to apply the same methodology to the other three major indexes.
The methodology for obtaining the data for each index is the same as the one outlined in the link above (for those who missed the SPY post), seeking to find how peaks & troughs of the major index ETF’s have been impacted both by time between the two points & distance covered in the declines based on the relationship between the securities’ prices & 200 day moving averages on the day of the peak.
QQQ ETF’s Price:200 Day Moving Average’s Relationship To Peaks & Troughs Over The Past Five Years
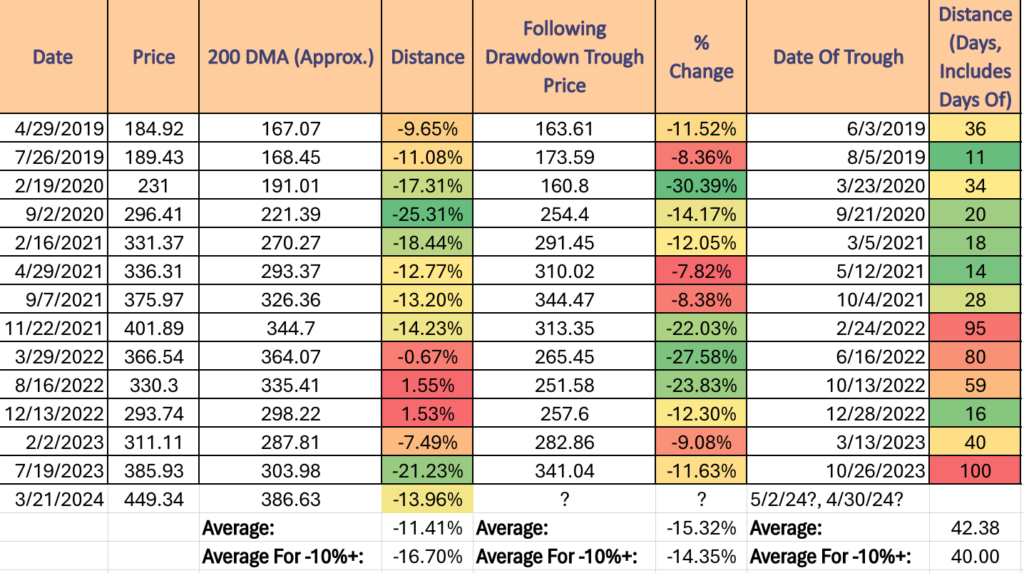
Some interesting findings on QQQ from the past five years:
The average approximated distance between the 200 Day Moving Average & price was -11.41% for all dates used, but the average for all differences that were 10%+ between the 200 DMA & price was -16.7%.
The average decline for all peaks & troughs was -15.32%, while the average decline from all peaks & troughs when the price was 10%+ higher than the 200 DMA was slightly better at -14.35%.
The average number of days between all peaks & troughs considered in the table was 42.38, but when the price was 10%+ above the 200 DMA the troughs came in 2 days sooner at 40 days.
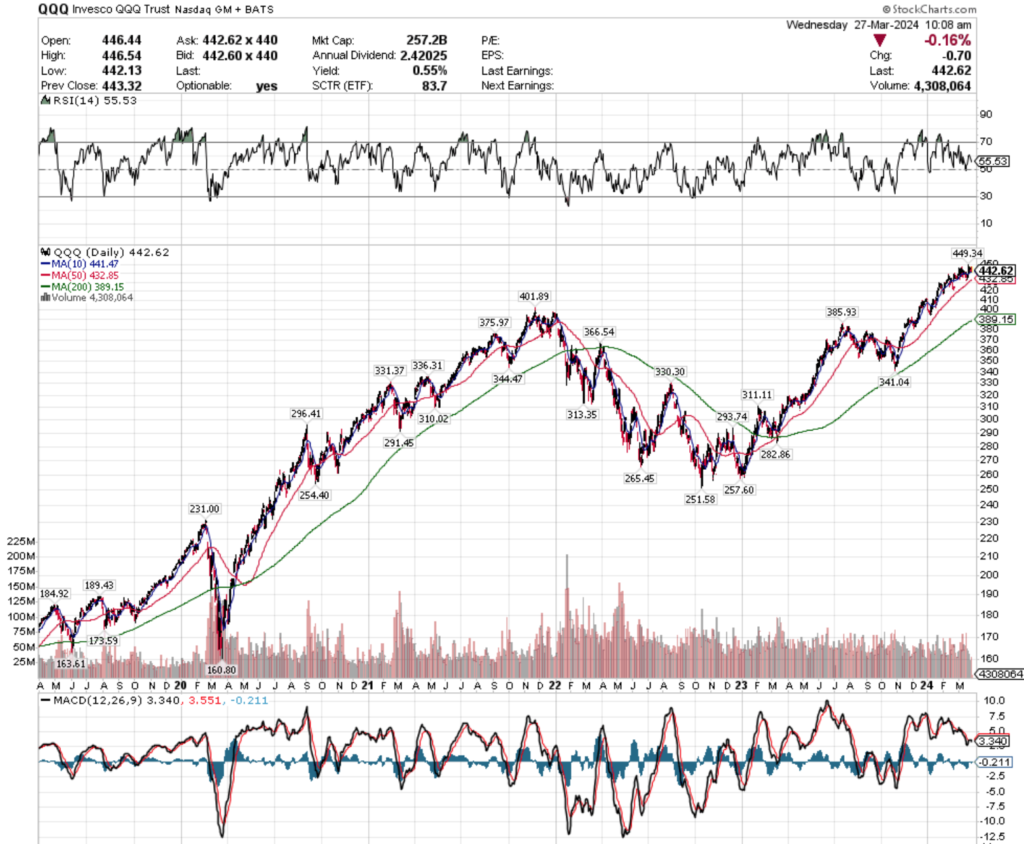
QQQ’s most recent peak was at $449.34 while their 200 DMA was $386.63, which was reached on 3/21/24 (same date as SPY) & reflects a -13.96% difference between their price & their 200 day moving average.
Applying the average days between peaks & troughs, that would result in a trough 40-43 days out, which would fall in the range of 4/30/24 to 5/2/24.
IWM ETF’s Price:200 Day Moving Average’s Relationship To Peaks & Troughs Over The Past Five Years
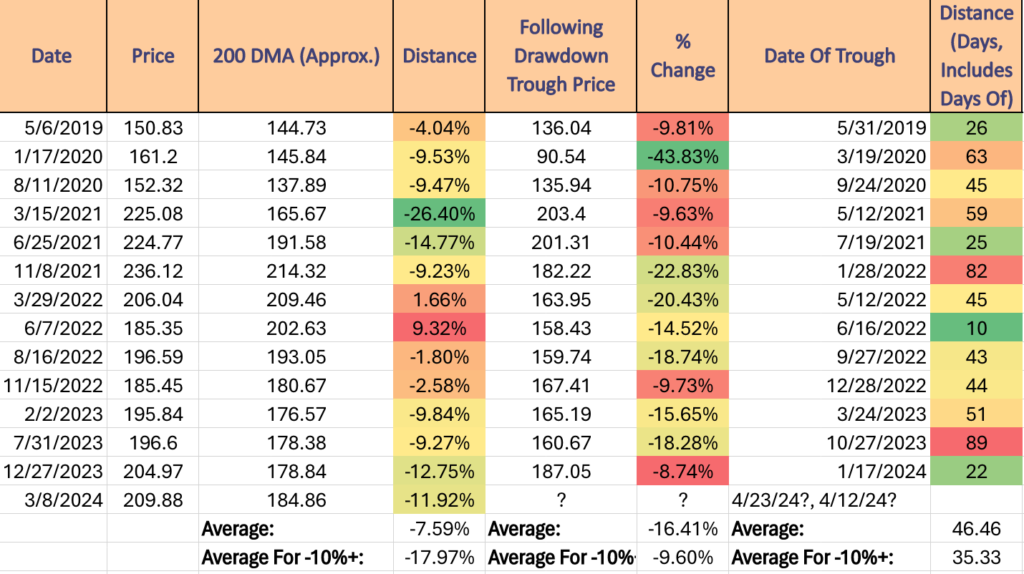
The average approximate distance between IWM’s price & 200 day moving average was -7.59%, but when only looking at days with a 10%+ range between them it becomes -17.97%.
Oddly enough (due to the more oscillating in a range nature we frequently note in our weekly posts compared to SPY & QQQ), the average declines for all dates included in IWM’s data is -16.41% peak-to-trough, while when the difference between price & 200 DMA is 10%+ the decline is reduced to only -9.6% on average.
This relation continues when applied to the number of days between peaks & troughs, with the average for all days being 46.46, while when only counting the days where the price peak occurred while the price was 10%+ different from the 200 DMA the number of days between peak & trough is reduced to only 35.33.
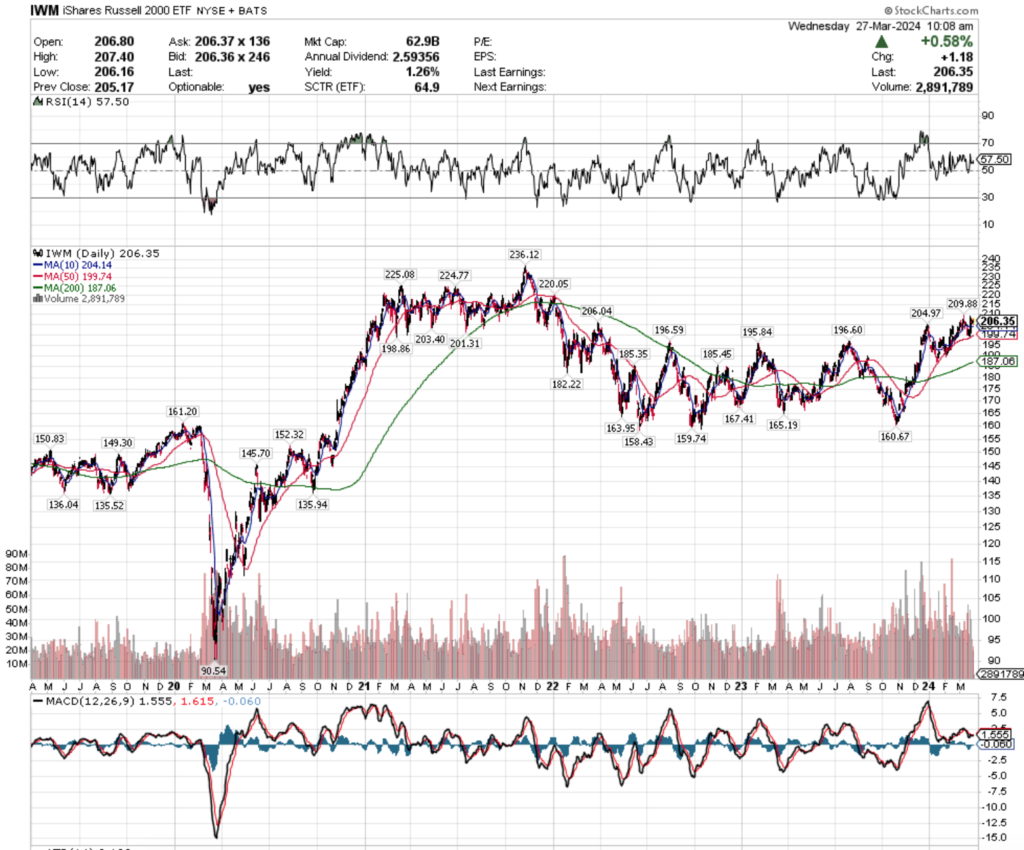
IWM‘s most recent peak was on 3/8/2024 at $209.88/share while their 200 DMA was ~$184.86, reflecting a -11.92% difference between the price & 200 DMA.
Applying the average days between peaks & troughs results in a rather wide date range, where 4/12/24 would be about where a 10%+ spread on price:200 DMA would be the case, to 4/23/24 using the average for all peaks & troughs.
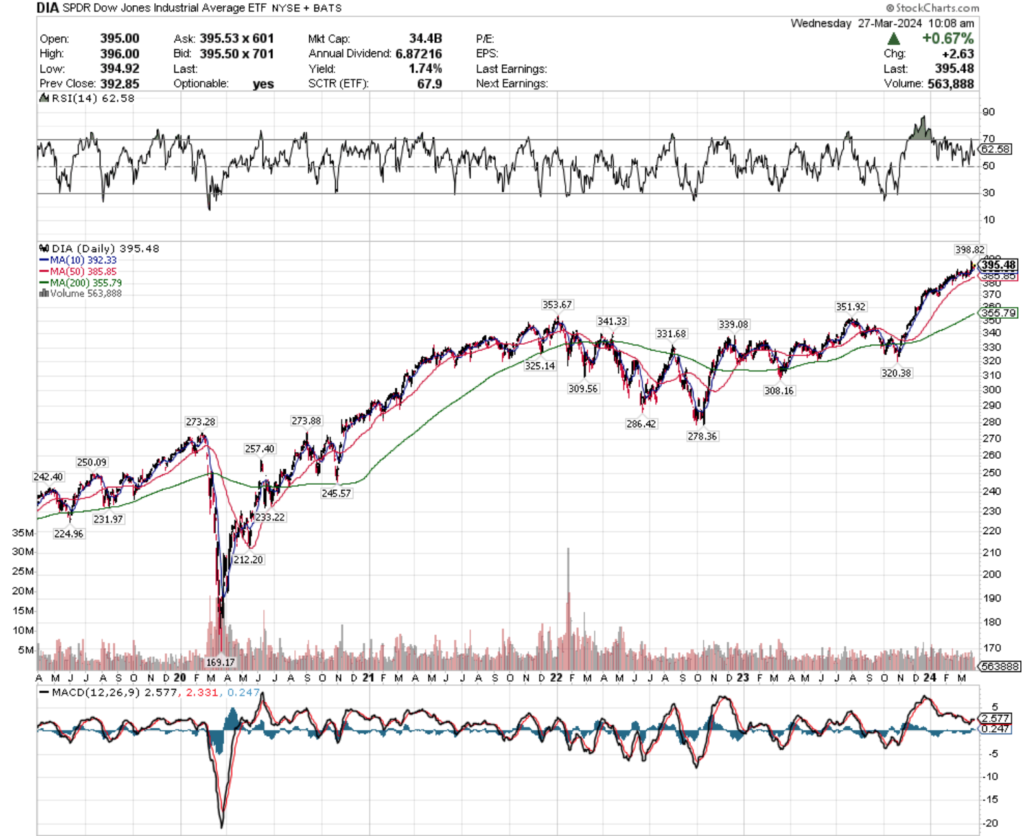
DIA ETF’s Price:200 Day Moving Average’s Relationship To Peaks & Troughs Over The Past Five Years
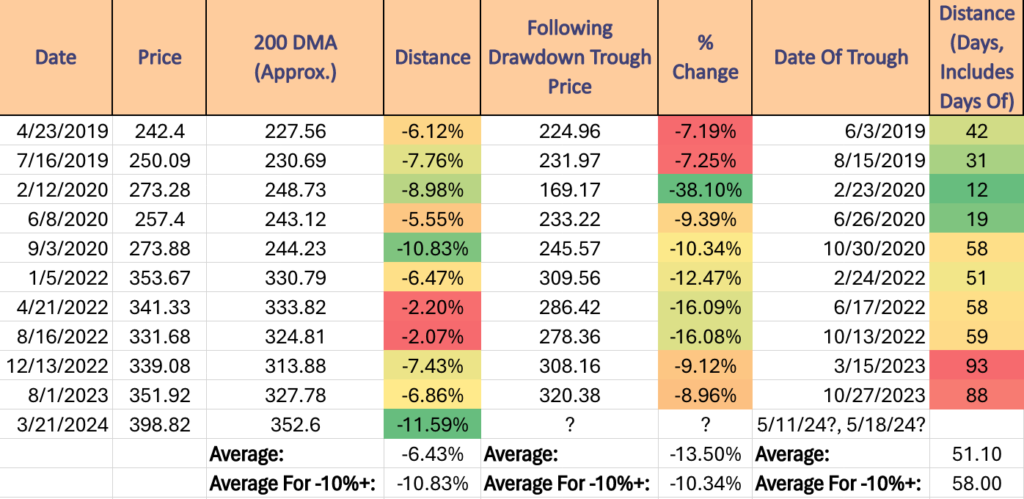
The average distance between DIA‘s price & 200 DMA is -6.43% for all dates in the table above, but when only averaging dates with a 10%+ spread between the two it becomes -10.83%.
The average decline between all peaks & troughs above is -13.5%, while when the spread between the price & 200 DMA is 10%+ it goes down to only -10.34% on average.
The average number of days between peaks & troughs in the table above is 51.1, but when the spread between the price & 200 DMA is 10%+ it increases by a calendar week to 58.
DIA’s most recent peak was 3/21/24 at $398.82/share, while their 200 DMA was $352.6, which is a spread of -11.59% between the two.
Applying the average number of days between all peaks & troughs results in 5/11/24, while using only the dates with the 10%+ spread between price & 200 DMA results in an estimated average date of 58.
While this is not an exact science & is relying on averages across time periods that were all very different, it is certainly food for thought & something interesting to keep an eye on over the next couple of months.
*** I DO NOT OWN SHARES OR OPTIONS CONTRACTS IN SPY, QQQ, IWM OR DIA AT THE TIME OF PUBLISHING THIS ARTICLE – THIS IS NOT INVESTING ADVICE, JUST SOMETHING INTERESTING TO LOOK AT WHILE DOING YOUR OWN DUE DILIGENCE – ALL DATA WAS GATHERED VIA STOCKCHARTS.COM ***