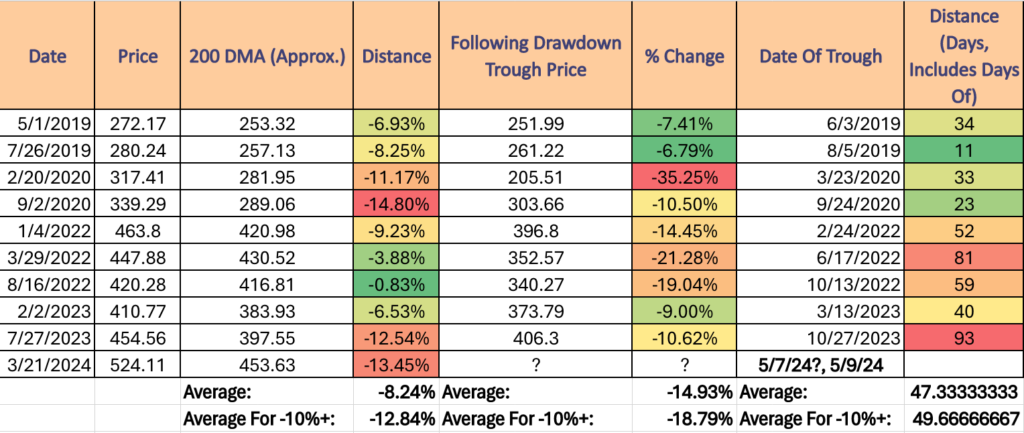
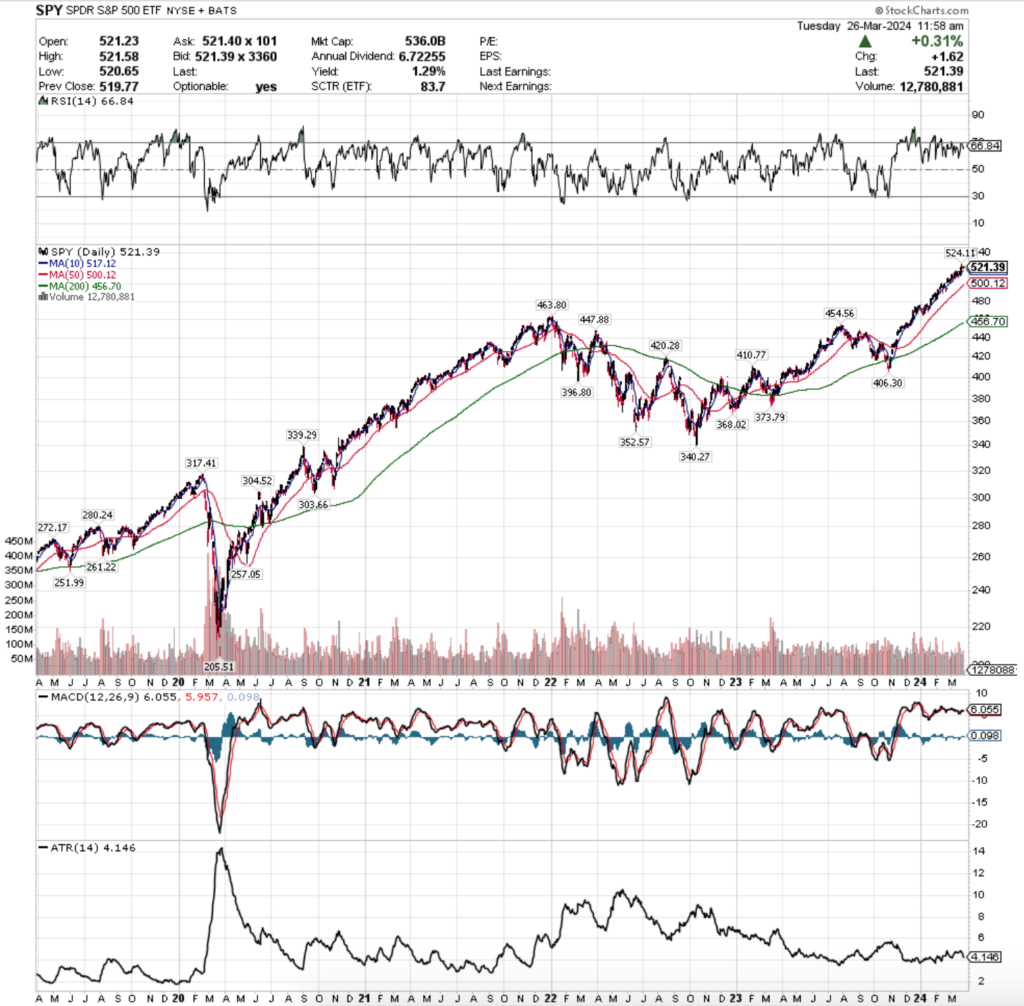
This morning while looking at charts I took a look into the relationship between the price level of SPY at various peaks over the past 5 years in relation to where the 200 day moving average was (approximated via the “inspect chart” for each date) at the time.
After calculating the percent change from price to 200 DMA the next closest major trough was added in with the total percent decline between the peak & trough prices & then counted the total days that were between the two dates (with the option of “Include End Date” selected from the date counter).
Some of the interesting findings:
The average approximated distance between the 200 Day Moving Average & the price was -8 .24% for all dates used, but the average for all differences that were 10%+ was -12.84% between the price & the 200 DMA.
The average decline for all peaks & troughs was -14.93%, while the average decline for all peaks & troughs when the price was 10%+ above the 200 DMA was -18.79%.
The average number of days between all peaks & troughs was 47.33, while the average number of days between all peaks & troughs for dates when the 200 DMA was -10%+ below the current SPY share price was 49.67.
SPY’s most recent peak price was $524.11 while their 200 DMA was ~$453.63, which was reached on 3/21/2024 & reflects a ~-13.45% difference between the price & the 200 day moving average.
Applying the average days between peaks & troughs, that would result in the next trough being 5/7/24 (5/8/24 technically, as the 7th is a Sunday), or 5/9-5/10.
While this is not an exact science & is relying on averages across time periods that were all very different, it is certainly food for thought & something interesting to keep an eye on over the next month & a half.
*** I DO NOT OWN SHARES OR OPTIONS CONTRACT POSITIONS IN SPY AT THE TIME OF PUBLISHING THIS ARTICLE – ALL DATA WAS GATHERED VIA STOCKCHARTS.COM ***