The VIX closed at 16.78, indicating an implied one day move of +/-1.06% & an implied one month move of +/-4.85% for the S&P 500.
Highest Technical Rated S&P 500 Components Per 12/23/2024’s Close:
1 – PLTR
2 – TSLA
3 – UAL
4 – AVGO
5 – AXON
6 – TPR
7 – CCL
8 – VST
9 – GDDY
10 – RCL
Lowest Technical Rated S&P 500 Components Per 12/23/2024’s Close:
1 – MRNA
2 – CE
3 – SMCI
4 – CVS
5 – DVN
6 – NUE
7 – MCHP
8 – DG
9 – REGN
10 – INTC
Highest Volume Rated S&P 500 Components Per 12/23/2024’s Close:
1 – SNA
2 – FDX
3 – APA
4 – LW
5 – LEN
6 – CCL
7 – VRTX
8 – WMT
9 – CTAS
10 – HOLX
Lowest Volume Rated S&P 500 Components Per 12/23/2024’s Close:
1 – SMCI
2 – JNPR
3 – LYV
4 – EPAM
5 – LVS
6 – TPL
7 – APH
8 – GEV
9 – FICO
10 – CFG
Highest Technical Rated ETFs Per 12/23/2024’s Close:
1 – TSLT
2 – TSLR
3 – TSLL
4 – VCAR
5 – TSL
6 – WANT
7 – BITW
8 – MAGX
9 – WEBL
10 – BZQ
Lowest Technical Rated ETFs Per 12/23/2024’s Close:
1 – TSLZ
2 – TSDD
3 – MSOX
4 – TSLQ
5 – TSLS
6 – SARK
7 – MRNY
8 – MSOS
9 – WEED
10 – MJUS
Highest Volume Rated ETFs Per 12/23/2024’s Close:
1 – TGRW
2 – RBUF
3 – DVND
4 – JUNP
5 – KOCT
6 – EZM
7 – FIVA
8 – SQLV
9 – PAWZ
10 – REAI
Lowest Volume Rated ETFs Per 12/23/2024’s Close:
1 – OUT
2 – ABHY
3 – FDCE
4 – USCL
5 – ZTEN
6 – SECR
7 – OVLH
8 – XNOV
9 – JEMB
10 – GVUS
Highest Technical Rated General Stocks Per 12/23/2024’s Close:
1 – NUKK
2 – QUBT
3 – LAES
4 – RGTI
5 – NVNI
6 – KULR
7 – QMCO
8 – UMAC
9 – CBDS
10 – LEEEF
Lowest Technical Rated General Stocks Per 12/23/2024’s Close:
1 – LTRPB
2 – GTI
3 – CYN
4 – QTTB
5 – SOBR
6 – LMPX
7 – GOEV
8 – ZCAR
9 – CRKN
10 – UPC
Highest Volume Rated General Stocks Per 12/23/2024’s Close:
1 – OCC
2 – TRAW
3 – CHEK
4 – GTBP
5 – RELI
6 – PIK
7 – DRCT
8 – NCRA
9 – RAPT
10 – MGOL
Lowest Volume Rated General Stocks Per 12/23/2024’s Close:
1 – OIBZQ
2 – FLMMF
3 – OIIIF
4 – FHSEY
5 – MFON
6 – CIAFF
7 – JWEL
8 – FGI
9 – CNNEF
10 – GBNY
*** THE LIST ABOVE IS STRICTLY FOR INFORMATIONAL PURPOSES – I MAY OR MAY NOT HAVE OR INITIATE A LONG, SHORT, OR LONG/SHORT POSITION IN ANY NAME ABOVE AT ANY TIME ***
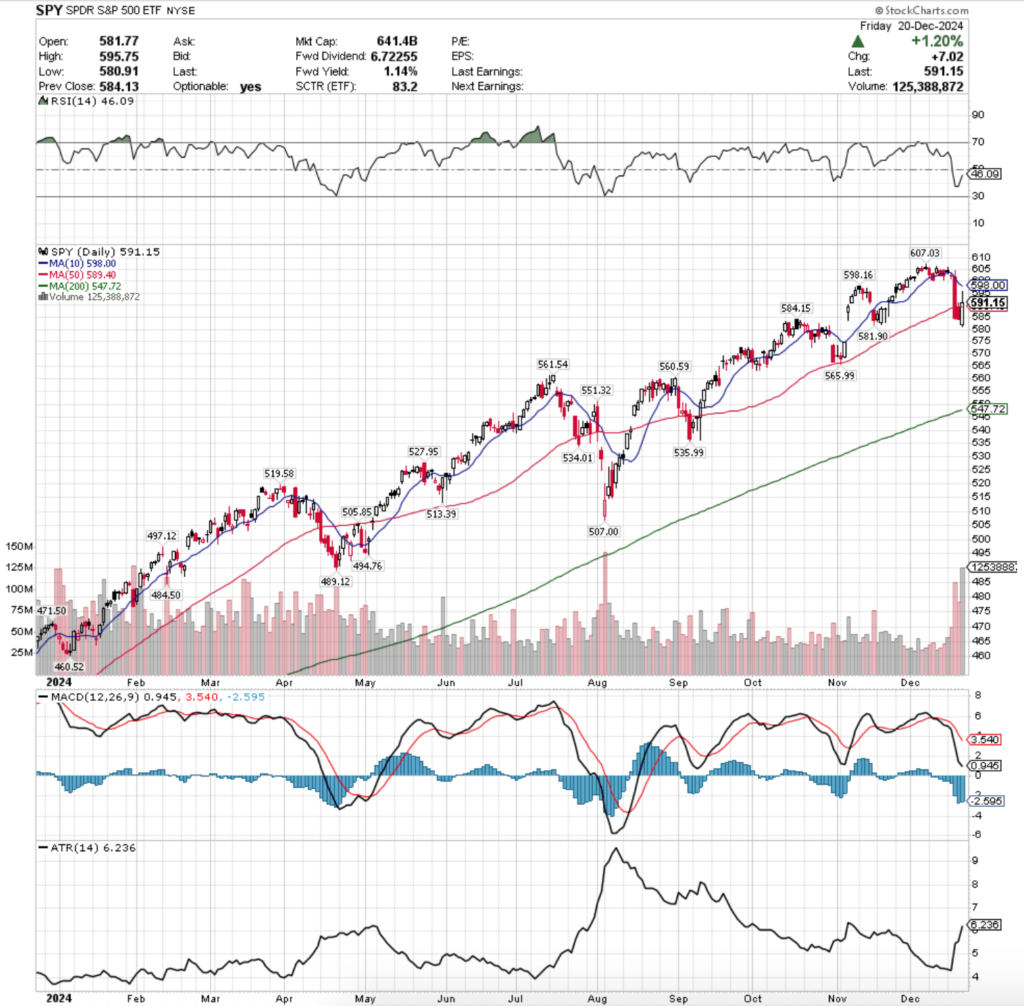
SPY, the SPDR S&P 500 ETF slipped -2.16% last week, while the VIX closed the week at 18.36, indicating an implied one day move of +/-1.16% & a one month implied move of +/-5.31% for SPY.
SPY ETF – SPDR S&P 500 ETF’S Technical Performance Over The Past Year
Their RSI is trending back towards the neutral mark of 50 & currently sits at 46.09 following Friday’s advancing session, while their MACD is still bearish, but the histogram is declining less rapidly than earlier in the week.
Volumes were +44.71% above the prior year’s average (83,872,000 vs. 57,959,641), as market participants began jumping out of the pool following Wednesday’s FOMC interest rate decision & Fed Chair Powell’s press conference.
Monday kicked the week off on an ominous note, as the session opened higher, tested a little bit above Friday’s opening price, before heading lower on low volume to close below the open straddling the 10 day moving average’s support.
The session also resulted in a spinning top, which indicates there was a bit of indecision in the air on the part of market participants.
Tuesday the theme continued, as the session opened lower & was unable to fight higher to cross the 10 DMA’s resistance, closing the day as a doji on slightly higher volume than Monday, indicating that uncertainty & caution were still in the air, but there was brief equilibrium.
Wednesday is where things really began to unravel, as the session opened lower with the 10 Day Moving Average, briefly tested higher, before crumbling on a wide range decline on the week’s second highest volume following Chair Powell’s remarks.
What’s more alarming is how easily it broke down the support of the 50 day moving average & managed to close beneath it, which will cause the 50 DMA to curl over bearishly like the 10 DMA already has.
Thursday the pain continued, as the session opened higher & in line with the 50 DMA & briefly tested higher, before unraveling & closing just below Wednesday’s close.
While the slightly lower close means that it was not a bearish harami, it was hardly a vote of confidence & a sign that profit taking may be morphing into a more serious downwards movement in the near-to-mid term when you consider that the session’s volume had only narrowly lower volume than the prior day.
Friday’s price action also continued the skeptical view of the strength behind SPY’s recent moves.
The day opened on a lower note from Thursday, but managed to draw in the most market participants of the week, powering it above the 50 DMA’s resistance & almost reaching the 10 DMA intraday, before profits were taken & the price closed just above the 50 DMA’s support.
While Friday formed a bullish engulfing pattern with Thursday’s candle & the volume & +1.2% advance are all nice, it is still wise to approach this short week & next week with caution.
Particularly as while the volume spike & wide daily range can indicate a reversal is on the horizon, that doesn’t seem likely beyond a brief movement following the squeeze/covering Friday session.
Especially given that there’s likely not going to be much volume this week which will likely continue into next week due to the holidays creating shorter weeks.
Without some type of volume catalyst it doesn’t seem there would be any near-term rallies, particularly when you factor in the limited earnings calls & market data reports that are due for release.
Watching the relationship between Price, the 10 DMA & the 50 DMA will be a key area of focus, particularly as the window created in early November following the US Presidential Election has yet to fully fill & SPY’s oscillators are not signaling strength at the moment.
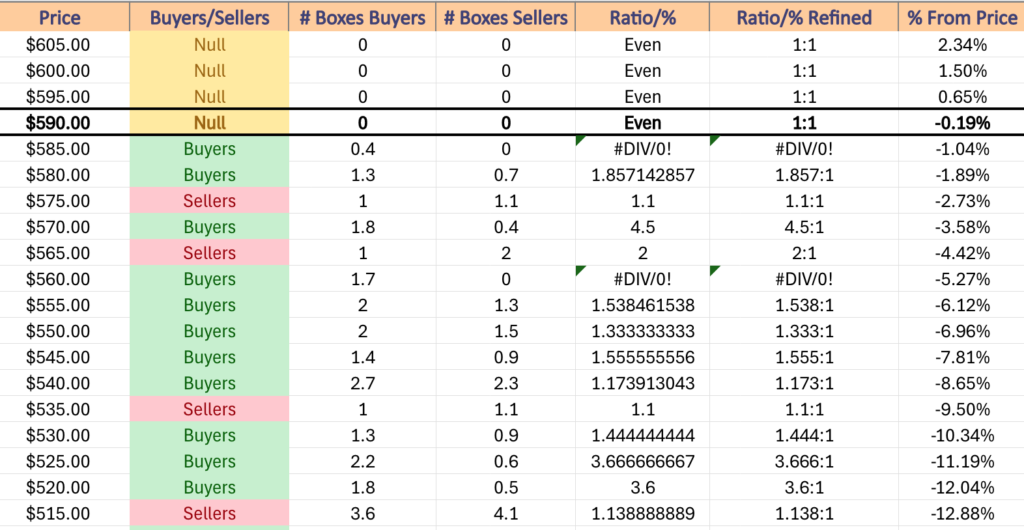
It will also be worth watching how SPY interacts with its support levels, especially given that the first one has been relatively untested & the following two are slightly more sturdy but close enough to the current price that based on the price action of last week can easily break down, leading to the fourth level, which has been Seller dominated 2:1 over the past 2-3 years.
This will also open SPY up to being ~3% from its 200 day moving average’s support, which is an important long-term trend mark.
SPY has support at the $589.40 (50 Day Moving Average, Volume Sentiment: Buyers, 0.4:0*), $584.15 (Volume Sentiment: Buyers, 1.86:1), $581.90 (Volume Sentiment: Buyers, 1.86:1) & $565.99/share (Volume Sentiment: Sellers, 2:1) price levels, with resistance at the $598.00 (10 Day Moving Average, Volume Sentiment: NULL, 0:0*), $598.16 (Volume Sentiment: NULL, 0:0*) & $607.03/share (All-Time High, Volume Sentiment: NULL, 0:0*) price levels.
Price Level:Volume Sentiment For SPY ETF Over The Past 2-3 Years
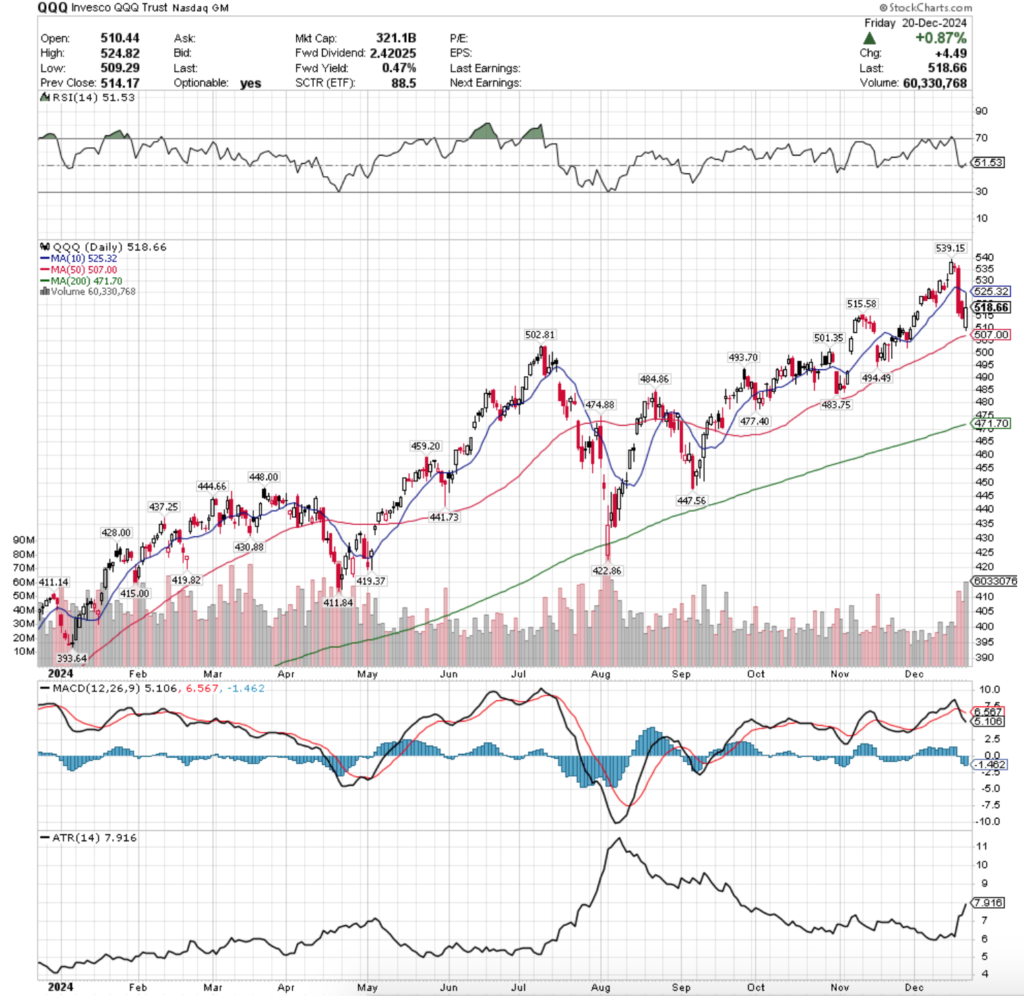
QQQ ETF – Invesco QQQ Trust ETF’s Technical Performance Over The Past Year
Their RSI is trending higher & sits at 51.53, while their MACD is bearish.
Volumes were +19.35% last week vs. the previous year’s average (44,446,000 vs. 37,240,478), as market participants were eager to get out of the pool on Wednesday & Thursday, but covering activity squeezed prices higher heading into the weekend.
QQQ opened the week on a more optimistic note than SPY, but it wasn’t without some caution signals.
Particularly of note was the low volume on Monday that helped QQQ hit a fresh all-time high despite it being a more solid advancing session than SPY’s.
Tuesday’s spinning top candle arrived on low volume as well & formed a bearish harami pattern with the prior day’s candle, which is when folks began heading to the door.
Wednesday opened slightly lower, but also on the second highest volume of the week ripped down straight through the support of the 10 day moving average.
Confirmation came on Thursday when on similar volume (slightly lower) the session opened briefly higher, before continuing to decline lower than Wednesday’s lower & price broke down below the $515/share mark.
Like SPY, QQQ’s Friday morning coffee came with a side order of lower, but it was able to briefly rally intraday to test the 10 DMA’s resistance, got rejected & closed in the middle of Thursday’s range.
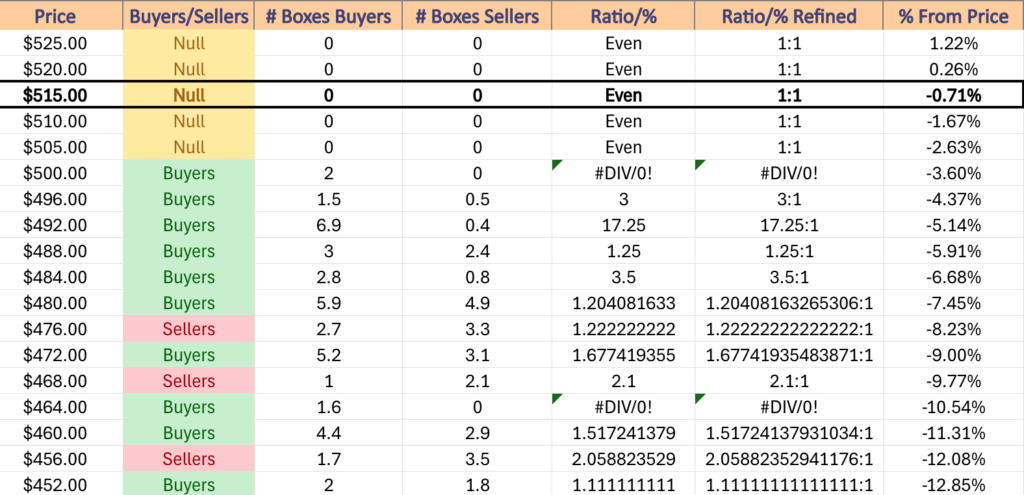
This week it will be worth watching how the relatively untested $515.58/share support level holds up, as it’s recently broken down & prices are only above it due to Friday’s session, which while it may normal constitute a reversal opportunity, seems unlikely given that it occurred heading into tumbleweed volume week(s).
The next area of focus will be on the 50 DMA, not just as it is the next support level, but because once that support breaks down QQQ will be on unstable footing.
While QQQ has more local support touch-points than SPY, at the price levels we see now if the 50 DMA breaks down they may not be as resilient of support levels as originally thought if the moving mid-term trend has broken (as we’ve seen three times already in 2024).
QQQ has support at the $515.58 (Volume Sentiment: NULL, 0:0*), $507 (50 Day Moving Average, Volume Sentiment: NULL, 0:0*), $502.81 (Volume Sentiment: Buyers, 2:0*) & $501.35/share (Volume Sentiment: Buyers, 2:0*) price levels, with resistance at the $525.32 (10 Day Moving Average, Volume Sentiment: NULL, 0:0*) & $539.15/share (All-Time High, Volume Sentiment: NULL, 0:0*) price levels.
Price Level:Volume Sentiment For QQQ ETF Over The Past 2-3 Years
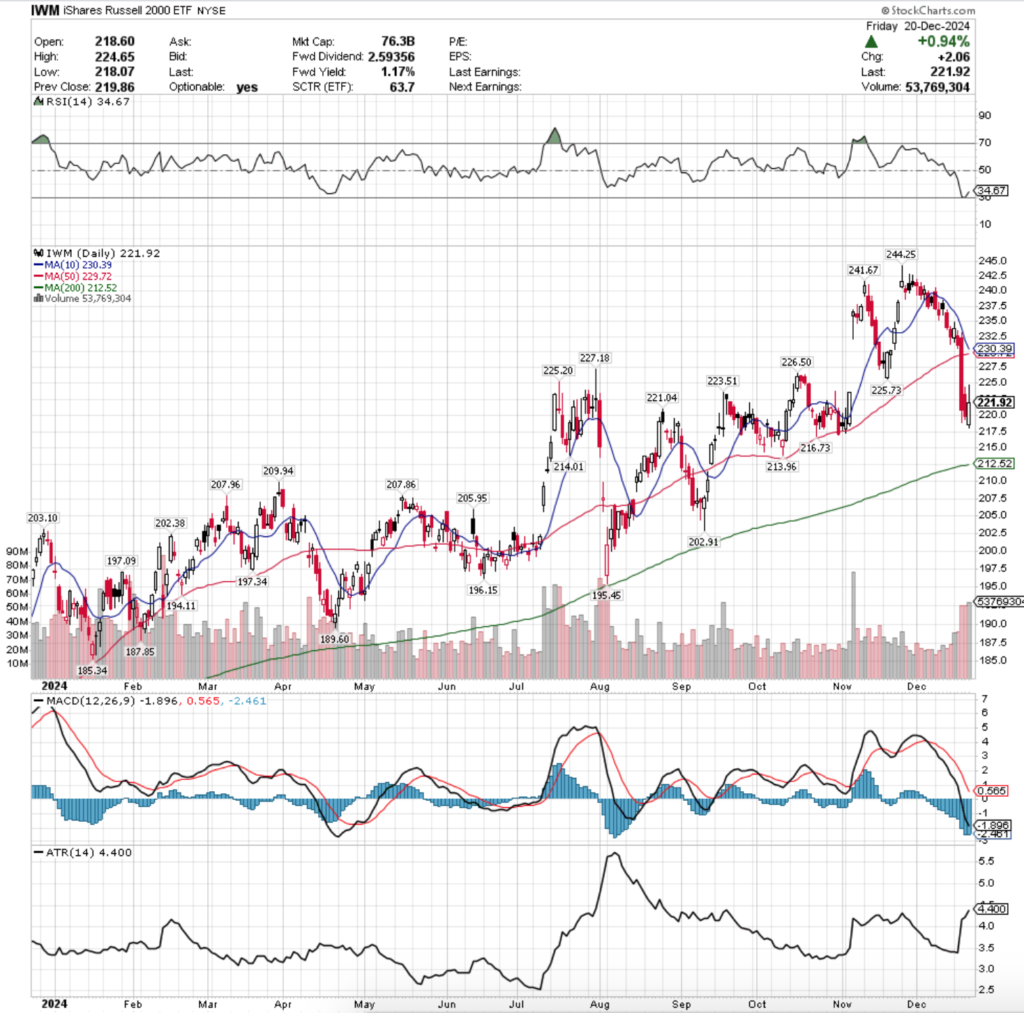
IWM, the iShares Russell 2000 ETF declined -4.78% last week, as investors were eager to jump out of the components of the small cap index.
IWM ETF – iShares Russell 2000 ETF’s Technical Performance Over The Past Year
Their RSI is rebounding from the oversold 30 mark & sits currently at 34.67, while their MACD is still bearish & near the lowest levels on its histogram.
Volumes were +40.84% above the prior year’s average last week (44,674,000 vs. 31,720,637), which is alarming given that two of the top three highest volume days were declining sessions & IWM had already been in decline for three weeks before this.
Looking at their MACD you can observe that they’ve been falling since around Thanksgiving time, so that much outflow is reason for concern.
IWM’s chart for the week closely resembles SPY & QQQ’s in terms of intraday action, so in the spirit of the holidays we’ll give the gift of brevity here.
Monday’s weak volumes on an advancing day that did not reach high enough to test the resistance of the 10 day moving average set the stage for the declines of the prior few weeks to continue, and they did on Tuesday, on volume that was slightly higher than Monday’s.
Wednesday put the nails in IWM’s coffin, as the day did manage to test the 10 DMA’s resistance, but proceeded to decline through the 50 DMA & showed more weakness than SPY & QQQ in relation to the price:moving averages relationship.
Thursday & Friday also mimicked SPY & QQQ, but more damage was done in the days leading up to them.
This coming week keep an eye on the 10 & 50 day moving averages, anticipating a bearish crossover by Christmas.
From there broader market sentiment will become more important, as while IWM’s steady oscillating around an average price to slowly climb higher gives them more support levels than other indexes, if the larger cap names are showing severe weakness the small cap names won’t be spared from pain as well.
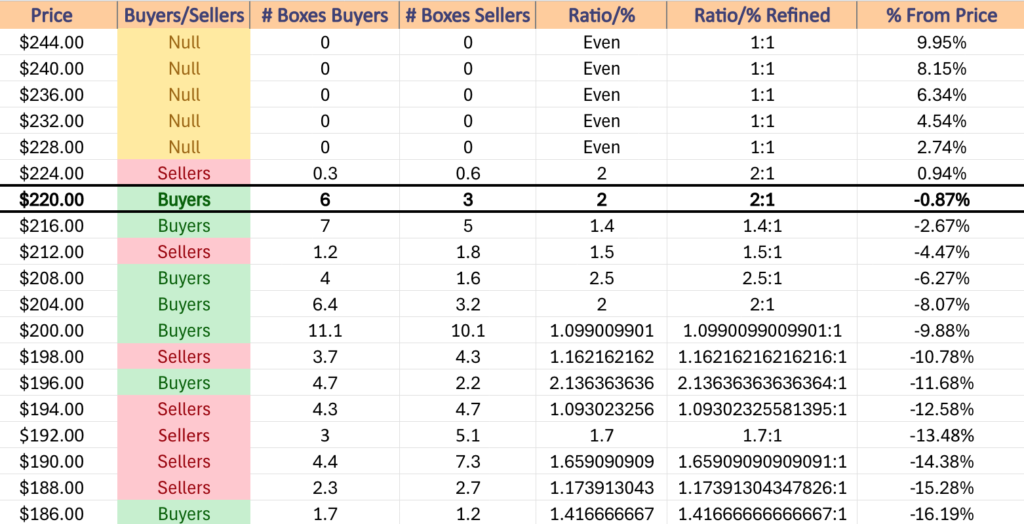
It should also be noted that IWM is only 4.24% above its 200 DMA’s support, which if that longer term trend breaks down may lead to further declines, particularly as it currently sits in a price zone that is historically Seller dominated 1.5:1 which may cause more of a further breakdown based on how the other indexes behave.
IWM has support at the $221.04 (Volume Sentiment: Buyers, 2:1), $216.73 (Volume Sentiment: Buyers, 1.4:1), $214.01 (Volume Sentiment: Sellers, 1.5:1) & $213.96/share (Volume Sentiment: Sellers, 1.5:1) price levels, with resistance at the $223.51 (Volume Sentiment: Buyers, 2:1), $225.20 (Volume Sentiment: Sellers, 2:1), $225.73 (Volume Sentiment: Sellers, 2:1) & $226.50/share (Volume Sentiment: Sellers, 2:1) price levels.
Price Level:Volume Sentiment For IWM ETF Over The Past 2-3 Years
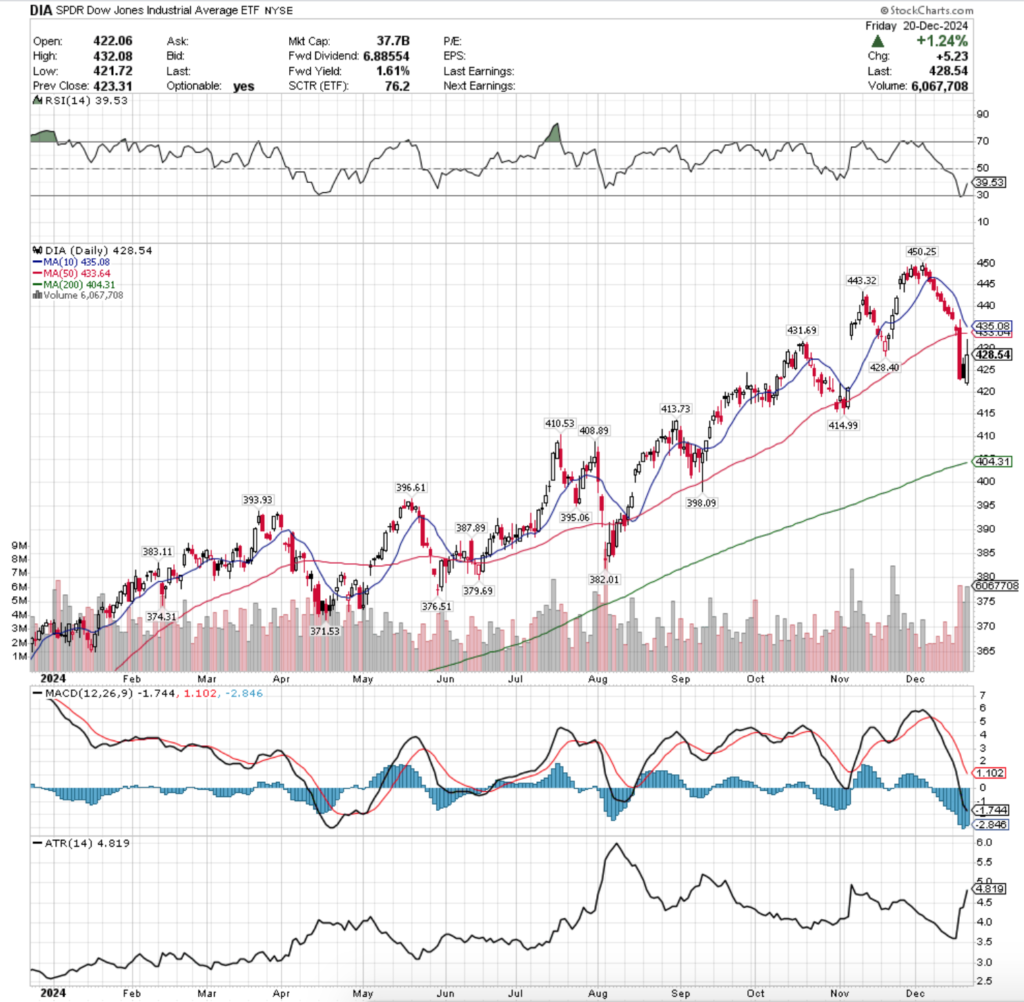
DIA ETF – SPDR Dow Jones Industrial Average ETF’s Technical Performance Over The Past Year
Their RSI is climbing higher after bouncing off of the oversold 30 level last week & sits at 39.53 due to the last two sessions of the week, while their MACD is bearish & near the lower end of its histogram.
Volumes were +30.13% above the previous year’s average (4,456,000 vs. 3,424,382), which is a bearish signal given that there was only one actual bullish session on the week.
The primary difference between DIA’s week & IWM’s vs. SPY/QQQ’s is that Tuesday’s session that was supported by the 50 day moving average was on a gap down & that Thursday’s session was advancing, but that it opened higher than it closed, forming what appears as a bullish harami, but that is bearish when you consider the price action of the day.
For the sake of brevity, this week watch for the impending 10 & 50 day moving average bearish crossover, which will likely push prices lower to close the window created by the US election’s gap up.
Should this happen & oscillators get stretched out lower, keep an eye out for an emerging head & shoulders pattern with the $431.69/share from October being the left shoulder.
There isn’t as much support nearby for DIA vs. IWM, but given that DIA is the blue chip index it may not matter much, given that the component stocks are names that are most likely to be bought & held over the long-term anyways.
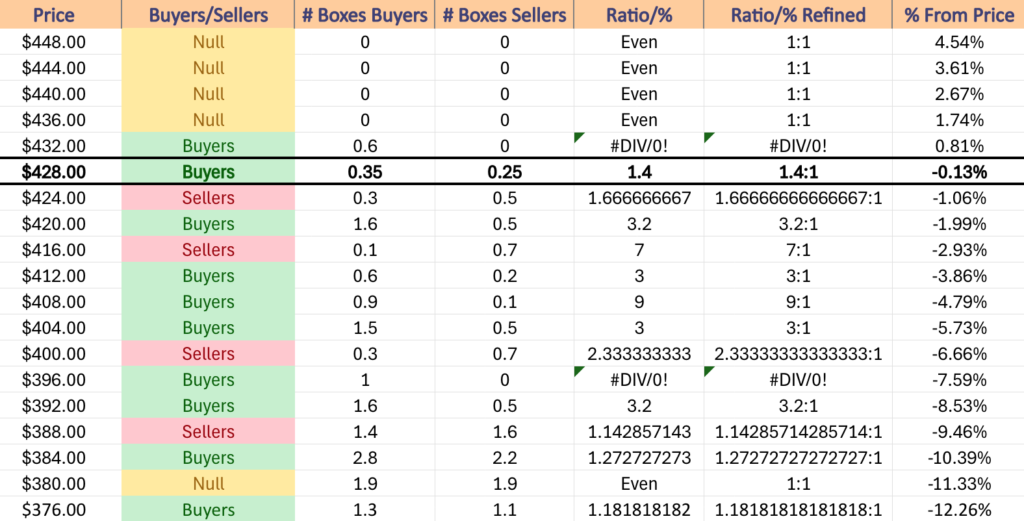
In the event of declines, it is worthwhile assessing the strength of their support levels using the table below & the ratios contained in it in order to gauge when market participants may step in to stop losses.
DIA has support at the $428.40 (Volume Sentiment: Buyers, 1.4:1), $414.99 (Volume Sentiment: Buyers, 3:1), $413.73 (Volume Sentiment: Buyers, 3:1) & $410.53/share (Volume Sentiment: Buyers, 9:1) price levels, with resistance at the $431.69 (Volume Sentiment: Buyers, 1.4:1), $433.64 (50 Day Moving Average, Volume Sentiment: Buyers, 0.6:0*), $435.08 (10 Day Moving Average, Volume Sentiment: NULL, 0:0*) & $443.32/share (Volume Sentiment: NULL, 0:0*) price levels.
Price Level:Volume Sentiment For DIA ETF Over The Past 3-4 Years
The Week Ahead
It looks to be a quiet holiday week ahead!
Monday the week kicks off with Consumer Confidence, Durable-Goods Orders & Durable-Goods minus transportation data at 8:30 am, followed by New Home Sales at 10 am.
There are no earnings reports scheduled for Monday, Tuesday or Wednesday & Tuesday the market closes at 1pm.
Tuesday & Wednesday have no major data announcements as it is the Christmas Holiday.
Initial Jobless Claims data are released Thursday morning at 8:30 am.
Friday winds the week down with Advanced U.S. Trade Balance in Goods, Advanced Retail Inventories & Advanced Wholesale Inventories data at 8:30 am.
There are no earnings reports on Thursday or Friday this week either.
See you back here next week!
*** I DO NOT OWN SHARES OR OPTIONS CONTRACT POSITIONS IN SPY, QQQ, IWM OR DIA AT THE TIME OF PUBLISHING THIS ARTICLE ***
The VIX closed at 14.69, indicating an implied one day move of +/-0.93% & an implied one month move of +/-4.25% for the S&P 500.
Highest Technical Rated S&P 500 Components Per 12/16/2024’s Close:
1 – PLTR
2 – TSLA
3 – WBD
4 – AXON
5 – UAL
6 – CCL
7 – RCL
8 – GDDY
9 – VST
10 – NOW
Lowest Technical Rated S&P 500 Components Per 12/16/2024’s Close:
1 – CE
2 – MRNA
3 – SMCI
4 – QRVO
5 – ENPH
6 – INTC
7 – MCHP
8 – REGN
9 – HII
10 – CVS
Highest Volume Rated S&P 500 Components Per 12/16/2024’s Close:
1 – ADBE
2 – NDSN
3 – AJG
4 – WBD
5 – CI
6 – KR
7 – UNH
8 – HIG
9 – UBER
10 – WDC
Lowest Volume Rated S&P 500 Components Per 12/16/2024’s Close:
1 – JNPR
2 – SMCI
3 – CDNS
4 – APD
5 – PYPL
6 – ENPH
7 – IVZ
8 – MCO
9 – DFS
10 – ALB
Highest Technical Rated ETFs Per 12/16/2024’s Close:
1 – TSLR
2 – TSLT
3 – TSLL
4 – VCAR
5 – TSL
6 – BTFX
7 – BITW
8 – WANT
9 – WEBL
10 – BITX
Lowest Technical Rated ETFs Per 12/16/2024’s Close:
1 – MSOX
2 – TSLZ
3 – TSDD
4 – TSLQ
5 – TSLS
6 – MSOS
7 – WEED
8 – MJUS
9 – MRNY
10 – WEBS
Highest Volume Rated ETFs Per 12/16/2024’s Close:
1 – MSSS
2 – MDPL
3 – PWER
4 – SMI
5 – MBCC
6 – FMCX
7 – FTXL
8 – QQQS
9 – DTD
10 – IIGD
Lowest Volume Rated ETFs Per 12/16/2024’s Close:
1 – SEPT
2 – ZTWO
3 – PSCQ
4 – FCA
5 – GPRF
6 – USCA
7 – OVLH
8 – SMCO
9 – SIXJ
10 – NUGO
Highest Technical Rated General Stocks Per 12/16/2024’s Close:
1 – CBDS
2 – RGTI
3 – QUBT
4 – AGFY
5 – LAES
6 – XCUR
7 – CMRX
8 – UMAC
9 – UAMY
10 – MNPR
Lowest Technical Rated General Stocks Per 12/16/2024’s Close:
1 – TFFP
2 – EQC
3 – LICN
4 – CLRB
5 – RLMD
6 – QTTB
7 – EFSH
8 – CRVO
9 – SPGC
10 – LUXH
Highest Volume Rated General Stocks Per 12/16/2024’s Close:
1 – SPGC
2 – PALI
3 – TRUG
4 – AYRO
5 – OUT
6 – TRVI
7 – NMGX
8 – GOEV
9 – WKEY
10 – APVO
Lowest Volume Rated General Stocks Per 12/16/2024’s Close:
1 – BRYFF
2 – RSCF
3 – FBAK
4 – VASO
5 – CHXMF
6 – WAI
7 – ADXN
8 – MFGCF
9 – TMGEF
10 – MRAI
*** THE LIST ABOVE IS STRICTLY FOR INFORMATIONAL PURPOSES – I MAY OR MAY NOT HAVE OR INITIATE A LONG, SHORT, OR LONG/SHORT POSITION IN ANY NAME ABOVE AT ANY TIME ***
The VIX closed at 13.92, indicating an implied one day move of +/-0.88% & an implied one month move of +/-4.02% for the S&P 500.
Highest Technical Rated S&P 500 Components Per 12/12/2024’s Close:
1 – PLTR
2 – TSLA
3 – WBD
4 – AXON
5 – UAL
6 – CCL
7 – RCL
8 – GDDY
9 – VST
10 – NOW
Lowest Technical Rated S&P 500 Components Per 12/12/2024’s Close:
1 – CE
2 – MRNA
3 – SMCI
4 – QRVO
5 – ENPH
6 – INTC
7 – MCHP
8 – REGN
9 – HII
10 – CVS
Highest Volume Rated S&P 500 Components Per 12/12/2024’s Close:
1 – ADBE
2 – NDSN
3 – AJG
4 – WBD
5 – CI
6 – KR
7 – UNH
8 – HIG
9 – UBER
10 – WDC
Lowest Volume Rated S&P 500 Components Per 12/12/2024’s Close:
1 – JNPR
2 – SMCI
3 – CDNS
4 – APD
5 – PYPL
6 – ENPH
7 – IVZ
8 – MCO
9 – DFS
10 – ALB
Highest Technical Rated ETFs Per 12/12/2024’s Close:
1 – TSLR
2 – TSLT
3 – TSLL
4 – VCAR
5 – TSL
6 – BTFX
7 – BITW
8 – WANT
9 – WEBL
10 – BITX
Lowest Technical Rated ETFs Per 12/12/2024’s Close:
1 – MSOX
2 – TSLZ
3 – TSDD
4 – TSLQ
5 – TSLS
6 – MSOS
7 – WEED
8 – MJUS
9 – MRNY
10 – WEBS
Highest Volume Rated ETFs Per 12/12/2024’s Close:
1 – MSSS
2 – MDPL
3 – PWER
4 – SMI
5 – MBCC
6 – FMCX
7 – FTXL
8 – QQQS
9 – DTD
10 IIGD-
Lowest Volume Rated ETFs Per 12/12/2024’s Close:
1 – SEPT
2 – ZTWO
3 – PSCQ
4 – FCA
5 – GPRF
6 – USCA
7 – OVLH
8 – SMCO
9 – SIXJ
10 – NUGO
Highest Technical Rated General Stocks Per 12/12/2024’s Close:
1 – CBDS
2 – LEEED
3 – RGTI
4 – QUBT
5 – AGFY
6 – LAES
7 – XCUR
8 – CMRX
9 – UMAC
10 – UAMY
Lowest Technical Rated General Stocks Per 12/12/2024’s Close:
1 – TFFP
2 – EQC
3 – CLRB
4 – RLMD
5 – QTTB
6 – EFSH
7 – CRVO
8 – UPC
9 – LUXH
10 – ONCO
Highest Volume Rated General Stocks Per 12/12/2024’s Close:
1 – SPGC
2 – PALI
3 – TRUG
4 – AYRO
5 – OUT
6 – TRVI
7 – NMGX
8 – GOEV
9 – WKEY
10 – APVO
Lowest Volume Rated General Stocks Per 12/12/2024’s Close:
1 – BRYFF
2 – RSCF
3 – HWNI
4 – FBAK
5 – VASO
6 – CHXMF
7 – WAI
8 – ADXN
9 – MFGCF
10 – TMGEF
*** THE LIST ABOVE IS STRICTLY FOR INFORMATIONAL PURPOSES – I MAY OR MAY NOT HAVE OR INITIATE A LONG, SHORT, OR LONG/SHORT POSITION IN ANY NAME ABOVE AT ANY TIME ***
XLE, the Energy Select Sector SPDR Fund ETF has advanced +9.8% over the past year, gaining +14.46% since their 52-week low in January of 2024, while currently sitting -8.7% below their 52-week high set in April of 2024 (all figures exclude distributions).
Some of their top holdings include Exxon Mobil Corp. (XOM), Chevron Corp (CVX), ConocoPhillips (COP), Williams Cos. Inc. (WMB), EOG Resources Inc. (EOG), ONEOK Inc. (OKE), Schlumberger Ltd. (SLB), Phillips 66 (PSX), Kinder Morgan Inc. (KMI) & Marathon Petroleum Corp. (MPC)
Below is a brief technical analysis of XLE, as well as a price level:volume sentiment analysis of the price levels XLE has traded at over the ~2 years.
Included in this data is also their recent support & resistance levels so that readers can gain insight into how strong/weak these support/resistance levels may be in the future, based on past investor behavior.
It is not intended to serve as financial advice, but rather as an additional tool to reference while performing your own due diligence on XLE.
XLE, The Energy Select Sector SPDR Fund ETF’s Technical Performance Broken Down
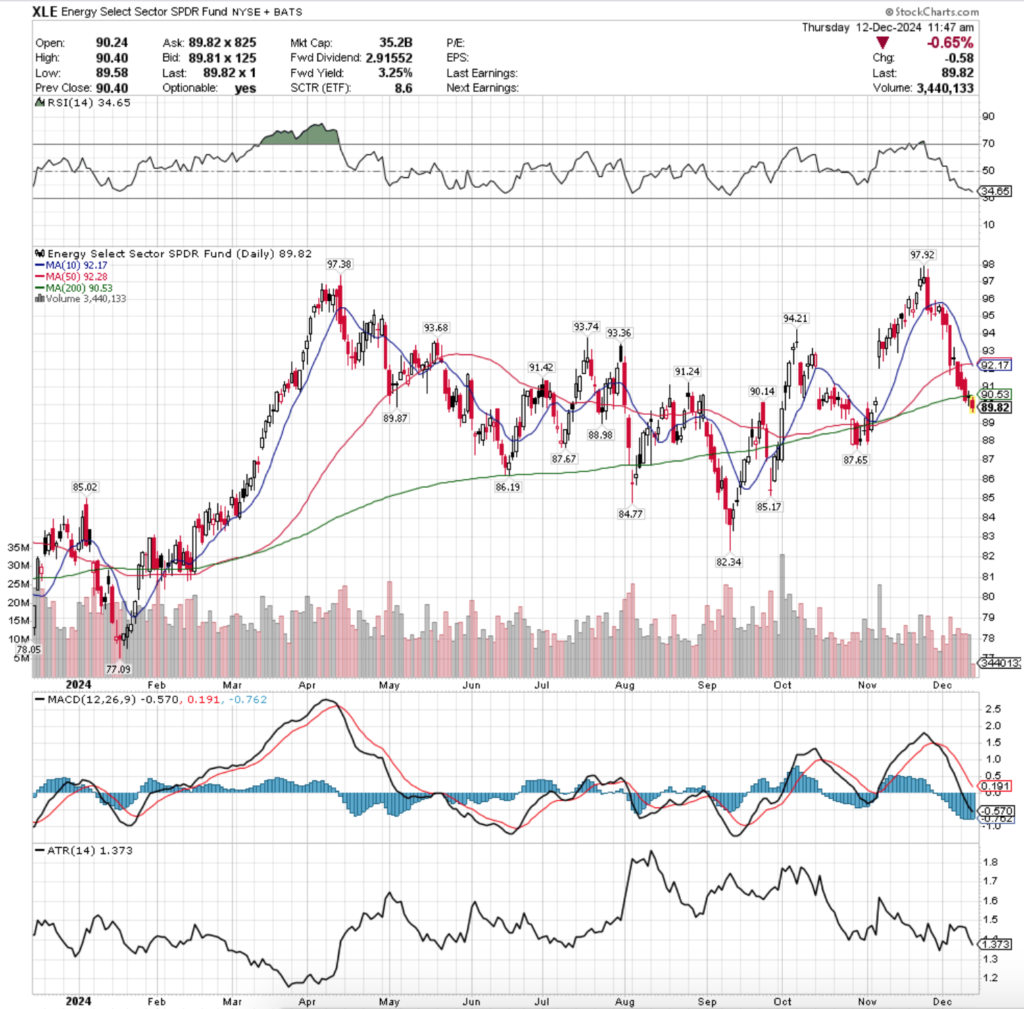
XLE ETF – SPDR Energy Select Sector SPDR Fund ETF’s Technical Performance Over The Past Year
Their RSI is trending towards the oversold 30-level & sits at 34.65, while their MACD is bearish following the declines of the past two weeks.
Volumes over the past week & a half have been -19.86% lower than the previous year’s average level (11,968,750 vs. 14,934,861.66), as market participants as a whole have been less active than normal while major indexes sit near all-time highs.
Last Monday continued the steep slide that XLE’s prices took in the previous week after the previous Friday’s session took a breather with a spinning top candle, indicating uncertainty among market participants.
The next day the selling continued with the session closing to form a bearish harami pattern with the prior day’s session.
Wednesday confirmed that risk-off was still on, when the session opened lower & on the highest volume of the past couple of weeks drifted down to briefly cross the 50 day moving average’s support, but was able to recover a little bit to close just above the 50 DMA.
Thursday there was a brief moment of calm again as the eye of the storm produced a doji candle that opened and closed as a slightly advancing session, but while the volume behind it was stronger than all but one of the previous week’s sessions, it was not strong enough to mark a reversal.
Friday ended the week with a risk-off into the weekend session, as the day opened lower & broke through the 50 DMA’s support on stronger volume than Thursday’s advancing session, indicating that the bearish sentiment was no where near over yet.
Monday opened higher & tested briefly above the resistance of the 50 day moving average, before ultimately tumbling lower.
This Tuesday exposed the real lack of confidence in the energy sector, as much like Monday the session opened higher, but proceeded to decline through the support of the 200 day moving average, marking extreme bearish sentiment as the long-term trend line was broken.
Wednesday currently looks to be another eye of the hurricane type of session, as the session opened in-line with the 200 DMA, tested higher & lower but ultimately closed as a doji.
Despite having similar volume to the two prior days’ sessions, there was not enough push for XLE’s trend to reverse, which led to today’s gap down open that as of 12:35 PM has produced a -0.45% daily return.
Given how strong this decline has been it is important to understand how investors have behaved historically at different price levels XLE has traded at in order to assess the strength of their support/resistance levels.
The section below lays out how the buyers & sellers have met at each price level XLE has traded at over the past ~2 years.
While it is not indicative of future performance, history repeats itself & or rhymes & this can be used as a barometer to anticipate how market participants may behave when faced with these price levels again.
Price Level:Volume Sentiment Analysis For XLE, The Energy Select Sector SPDR Fund ETF
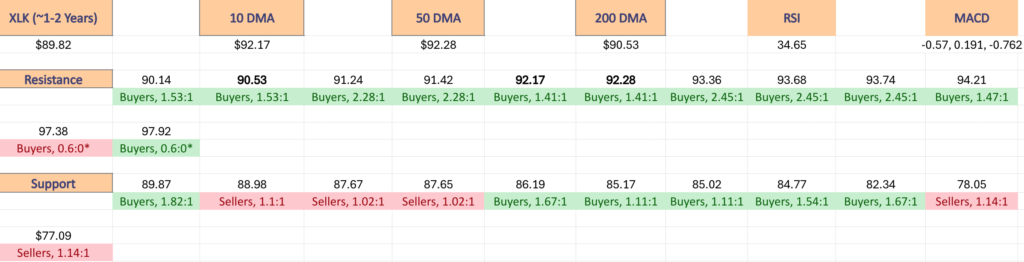
The top table below shows the support & resistance levels of XLE from the past year’s chart, as well as their price level:volume sentiment at each from data covering the past ~2 years, using Wednesday 11/20/24’s mid-session price for their price & moving averages/other technicals.
The moving averages are denoted with bold.
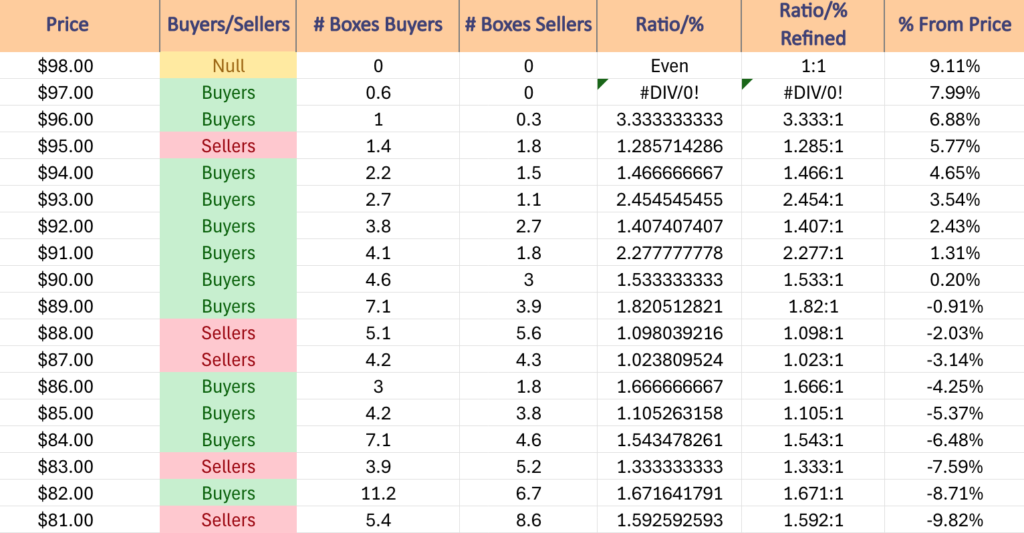
The next charts show the volume sentiment at each individual price level XLE has traded at over the past ~2 years.
Beneath them is a copy & pasteable list of the same data, where the support/resistance levels are denoted in bold.
All ratios with “0” in the denominator are denoted with a “*”.
NULL values are price levels that had limited trading volume, whether it be due to gaps, quick advances or they are at price extremes; in the event that they are retested & there is more data they would have a distinct “Buyers”, “Sellers” or “Even” title.
This is not intended as financial advice, but rather another tool to consider when performing your own research & due diligence on XLE.
Price Level:Volume Sentiment For XLE ETF Over The Past ~1-2 Years With Their Past Year’s Support/Resistance Levels
XLE ETF’s Price Level:Volume Sentiment Over The Past ~1-2 Years
Price Level:Volume Sentiment For XLE ETF Over The Past ~1-2 Years
$98 – NULL – 0:0*, +9.11% From Current Price
$97 – Buyers – 0.6:0*, +7.99% From Current Price
$96 – Buyers – 3.33:1, +6.88% From Current Price
$95 – Sellers – 1.29:1, +5.77% From Current Price
$94 – Buyers – 1.47:1, +4.65% From Current Price
$93 – Buyers – 2.45:1, +3.54% From Current Price
$92 – Buyers – 1.41:1, +2.43% From Current Price – 10 & 50 Day Moving Averages**
$91 – Buyers – 2.28:1, +1.31% From Current Price
$90 – Buyers – 1.53:1, +0.2% From Current Price – 200 Day Moving Average*
$89 – Buyers – 1.82:1, -0.91% From Current Price – Current Price Level*
$88 – Sellers – 1.1:1, -2.03% From Current Price
$87 – Sellers – 1.02:1, -3.14% From Current Price
$86 – Buyers – 1.67:1, -4.25% From Current Price
$85 – Buyers – 1.11:1, -5.37% From Current Price
$84 – Buyers – 1.54:1, -6.48% From Current Price
$83 – Sellers – 1.33:1, -7.59% From Current Price
$82 – Buyers – 1.67:1, -8.71% From Current Price
$81 – Sellers – 1.59:1, -9.82% From Current Price
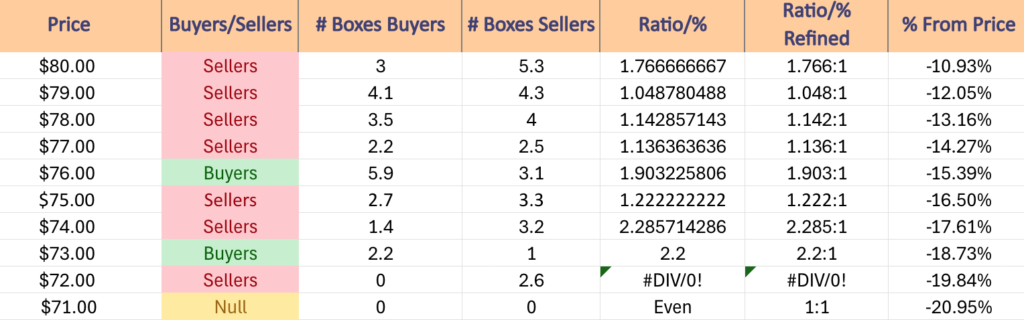
$80 – Sellers – 1.77:1, -10.93% From Current Price
$79 – Sellers – 1.05:1, -12.05% From Current Price
$78 – Sellers – 1.14:1, -13.16% From Current Price
$77 – Sellers – 1.14:1, -14.27% From Current Price
$76 – Buyers – 1.9:1, -15.39% From Current Price
$75 – Sellers – 1.22:1, -16.5% From Current Price
$74 – Sellers – 2.29:1, -17.61% From Current Price
$73 – Buyers – 2.2:1, -18.73% From Current Price
$72 – Sellers – 2.6:0*, -19.84% From Current Price
$71 – NULL – 0:0*, -20.95% From Current Price
*** I DO NOT OWN SHARES OR OPTIONS CONTRACT POSITIONS IN XLE AT THE TIME OF PUBLISHING THIS ARTICLE ***
The VIX closed at 14.18, indicating an implied one day move of +/-0.89% & an implied one month move of +/-4.1% for the S&P 500.
Highest Technical Rated S&P 500 Components Per 12/10/2024’s Close:
1 – PLTR
2 – TSLA
3 – AXON
4 – UAL
5 – RCL
6 – TPL
7 – CCL
8 – GDDY
9 – WBD
10 – TPR
Lowest Technical Rated S&P 500 Components Per 12/10/2024’s Close:
1 – CE
2 – MRNA
3 – QRVO
4 – INTC
5 – MPWR
6 – MCHP
7 – HII
8 – ENPH
9 – SMCI
10 – DVN
Highest Volume Rated S&P 500 Components Per 12/10/2024’s Close:
1 – AJG
2 – WBA
3 – ORCL
4 – OMC
5 – KR
6 – IPG
7 – HSY
8 – HOLX
9 – GOOGL
10 – URI
Lowest Volume Rated S&P 500 Components Per 12/10/2024’s Close:
1 – WYNN
2 – IEX
3 – RL
4 – JNPR
5 – APD
6 – VLTO
7 – K
8 – ANSS
9 – FTV
10 – DFS
Highest Technical Rated ETFs Per 12/10/2024’s Close:
1 – TSLR
2 – TSLL
3 – TSLT
4 – VCAR
5 – GXLM
6 – TSL
7 – BITW
8 – WANT
9 – BTFX
10 – WEBL
Lowest Technical Rated ETFs Per 12/10/2024’s Close:
1 – TSLZ
2 – TSDD
3 – TSLQ
4 – MSOX
5 – TSLS
6 – MRNY
7 – SARK
8 – YANG
9 – KORU
10 – UVIX
Highest Volume Rated ETFs Per 12/10/2024’s Close:
1 – KNOW
2 – RAYC
3 – BILD
4 – AIBD
5 – UIVM
6 – RAAX
7 – XYLE
8 – GENT
9 – AFIF
10 – FLSP
Lowest Volume Rated ETFs Per 12/10/2024’s Close:
1 – FDVL
2 – BBEM
3 – UNIY
4 – GVUS
5 – GPRF
6 – KCSH
7 – USCL
8 – JAJL
9 – ZTRE
10 – WABF
Highest Technical Rated General Stocks Per 12/10/2024’s Close:
1 – COMS
2 – CBDS
3 – QUBT
4 – RGTI
5 – LEEED
6 – UMAC
7 – CMRX
8 – XCUR
9 – SATL
10 – QBTS
Lowest Technical Rated General Stocks Per 12/10/2024’s Close:
1 – PGTK
2 – EQC
3 – BIOR
4 – EFSH
5 – RLMD
6 – CRVO
7 – LICN
8 – DEVS
9 – APLT
10 – LUXH
Highest Volume Rated General Stocks Per 12/10/2024’s Close:
1 – CPIX
2 – PCSA
3 – OUT
4 – DTCK
5 – CMRX
6 – VRAR
7 – ANGH
8 – RNVA
9 – ICCT
10 – QURE
Lowest Volume Rated General Stocks Per 12/10/2024’s Close:
1 – CXHMF
2 – BETRF
3 – AAGR
4 – PMCOF
5 – CVAT
6 – WXPF
7 – BRVMF
8 – AMNI
9 – LCGMF
10 – JWEL
*** THE LIST ABOVE IS STRICTLY FOR INFORMATIONAL PURPOSES – I MAY OR MAY NOT HAVE OR INITIATE A LONG, SHORT, OR LONG/SHORT POSITION IN ANY NAME ABOVE AT ANY TIME ***
The VIX closed at 14.19, indicating an implied one day move of +/-0.89% & an implied one month move of +/-4.1% for the S&P 500.
Highest Technical Rated S&P 500 Components Per 12/9/2024’s Close:
1 – PLTR
2 – TSLA
3 – AXON
4 – UAL
5 – TPL
6 – VST
7 – RCL
8 – LULU
9 – TPR
10 – CCL
Lowest Technical Rated S&P 500 Components Per 12/9/2024’s Close:
1 – CE
2 – MRNA
3 – QRVO
4 – INTC
5 – MCHP
6 – WBA
7 – HII
8 – MPWR
9 – ENPH
10 – BIIB
Highest Volume Rated S&P 500 Components Per 12/9/2024’s Close:
1 – HSY
2 – OMC
3 – IPG
4 – WAB
5 – AJG
6 – CTAS
7 – MDLZ
8 – CMSCA
9 – AON
10 – PLTR
Lowest Volume Rated S&P 500 Components Per 12/9/2024’s Close:
1 – DXCM
2 – K
3 – KEYS
4 – WDC
5 – PFG
6 – DLTR
7 – ERIE
8 – MCO
9 – HUM
10 – EA
Highest Technical Rated ETFs Per 12/9/2024’s Close:
1 – TSLR
2 – TSLL
3 – TSLT
4 – VCAR
5 – TSL
6 – GXLM
7 – BITW
8 – DEFG
9 – WANT
10 – BTFX
Lowest Technical Rated ETFs Per 12/9/2024’s Close:
1 – TSLZ
2 – TSDD
3 – MSOX
4 – TSLQ
5 – YANG
6 – TSLS
7 – SARK
8 – KORU
9 – MRNY
10 – UVIX
Highest Volume Rated ETFs Per 12/9/2024’s Close:
1 – KCSH
2 – SMCF
3 – ESGG
4 – HIYS
5 – FLSP
6 – DFND
7 – OGSP
8 – AZTD
9 – XYLE
10 – RSBT
Lowest Volume Rated ETFs Per 12/9/2024’s Close:
1 – SIXJ
2 – FDTB
3 – BHYB
4 – ZTEN
5 – FDCE
6 – GGUS
7 – MEMS
8 – ESMV
9 – GSID
10 – FDGR
Highest Technical Rated General Stocks Per 12/9/2024’s Close:
1 – HUIZ
2 – XCUR
3 – QUBT
4 – CBDS
5 – LEEED
6 – SATL
7 – LDTC
8 – RGTI
9 – UMAC
10 – AGFY
Lowest Technical Rated General Stocks Per 12/9/2024’s Close:
1 – CLVR
2 – EQC
3 – CIPI
4 – EFSH
5 – RLMD
6 – SAVA
7 – APLT
8 – ELAB
9 – LUXH
10 – LICN
Highest Volume Rated General Stocks Per 12/9/2024’s Close:
1 – LDTC
2 – IPHA
3 – HUIZ
4 – SLG
5 – OUT
6 – MAMA
7 – ZEO
8 – MGX
9 – MTBLY
10 – SONN
Lowest Volume Rated General Stocks Per 12/9/2024’s Close:
1 – CIAFF
2 – DBIN
3 – AAGR
4 – TRBMF
5 – CPFXF
6 – BBSRF
7 – FMCB
8 – GRCMF
9 – RIINF
10 – CVAT
*** THE LIST ABOVE IS STRICTLY FOR INFORMATIONAL PURPOSES – I MAY OR MAY NOT HAVE OR INITIATE A LONG, SHORT, OR LONG/SHORT POSITION IN ANY NAME ABOVE AT ANY TIME ***
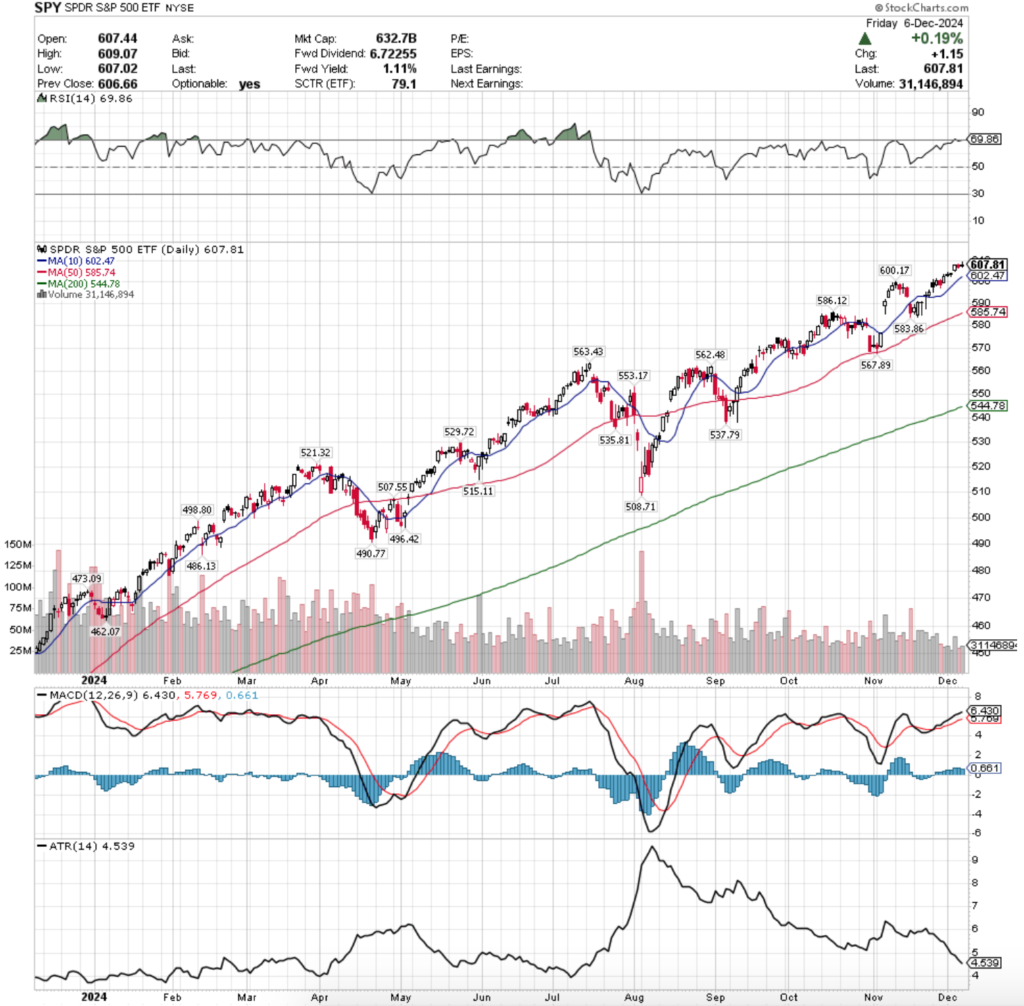
SPY, the SPDR S&P 500 ETF gained +0.87% last week, while the VIX closed at 12.77, indicating an implied one day move of +/-0.81% & an implied one month move of +/-3.69%.
SPY ETF – SPDR S&P 500 ETF’s Technical Performance Over The Past Year
Their RSI is approaching the overbought mark & currently sits at 69.86, while their MACD is bullish, but the histogram is beginning to wane
Volumes were -45.47% lower than the previous year’s average (32,290,000 vs. 59,219,960), as market participants continue to tread cautiously so close to all-time high prices for SPY.
Things are beginning to look like the latter portion of a Jenga game with the low volumes & tight daily ranges that we have been seeing over the past few weeks.
Monday the week began on a quiet note, resulting in a low volume session that ended as a doji, indicating that there was uncertainty, but temporary equilibrium for SPY’s price, with the day’s upper shadow indicating that there was small appetite for the upside.
Tuesday featured more of the same, when the day closed as another doji candle that had a tight range for the session on even less volume than Monday.
Wednesday is where most of the week’s advancing price action came from, on account of the gap up open that came on the strongest volume of the week.
Sentiments returned to cautious on Thursday though & some profits from the gap’s jump were taken, as the session ended in a bearish harami pattern with Wednesday’s candle, indicating that there was fear on the horizon.
This carried into Friday, whose candle resembled that of the ones from earlier in the week & the week ended with a gravestone doji on a +0.19% gain for the day.
This week all eyes will be on Wednesday & Thursday for CPI & PPI data as it will lend clues as to what direction interest rates will move in (or stay the same) in the coming month.
A key thing to watch will be should there be a 1% decline for SPY whether or not the $600.17/share support level holds up, as otherwise the next support level is not until $586.12, which is another -2.34% (totaling ~3.4%).
Another reason that this is important is because in the event that that level does not hold up, prices would likely pass bearishly through the 50 day moving average as well, which would open SPY up to test the window that was created in early November when prices gapped up over the 10 day moving average.
Despite the low volume the market was able to continue on & set a new all-time high last week, but that waning volume sentiment is indicating that there is a lack of confidence at the moment in SPY & it is difficult to see it climbing much higher without more volume & participation.
Due to the nature of SPY’s low volume while near all-time highs there is not much point in examining upside potential from where they sit currently & it is more important to understand how SPY may fall in the event of a decline/profit taking.
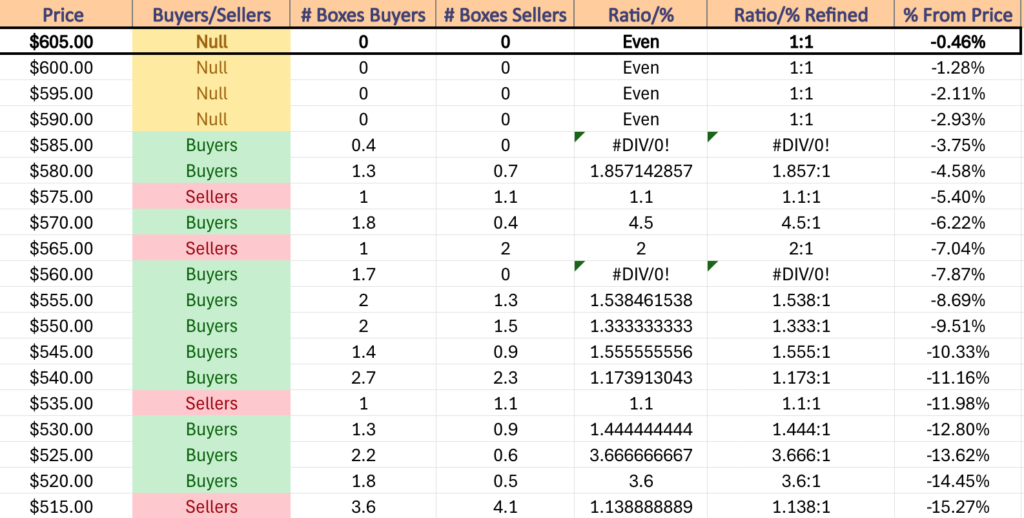
SPY has support at the $602.47 (10 Day Moving Average, Volume Sentiment: NULL, 0:0*), $600.17 (Volume Sentiment: NULL, 0:0*), $586.12 (Volume Sentiment: Buyers, 0.4:0*) & $585.74/share (50 Day Moving Average, Volume Sentiment: Buyers, 0.4:0*) price levels, with resistance at the $609.07/share (All-Time High, Volume Sentiment: NULL, 0:0*) price level.
SPY ETF’s Price Level:Volume Sentiment Over The Past ~2 Years
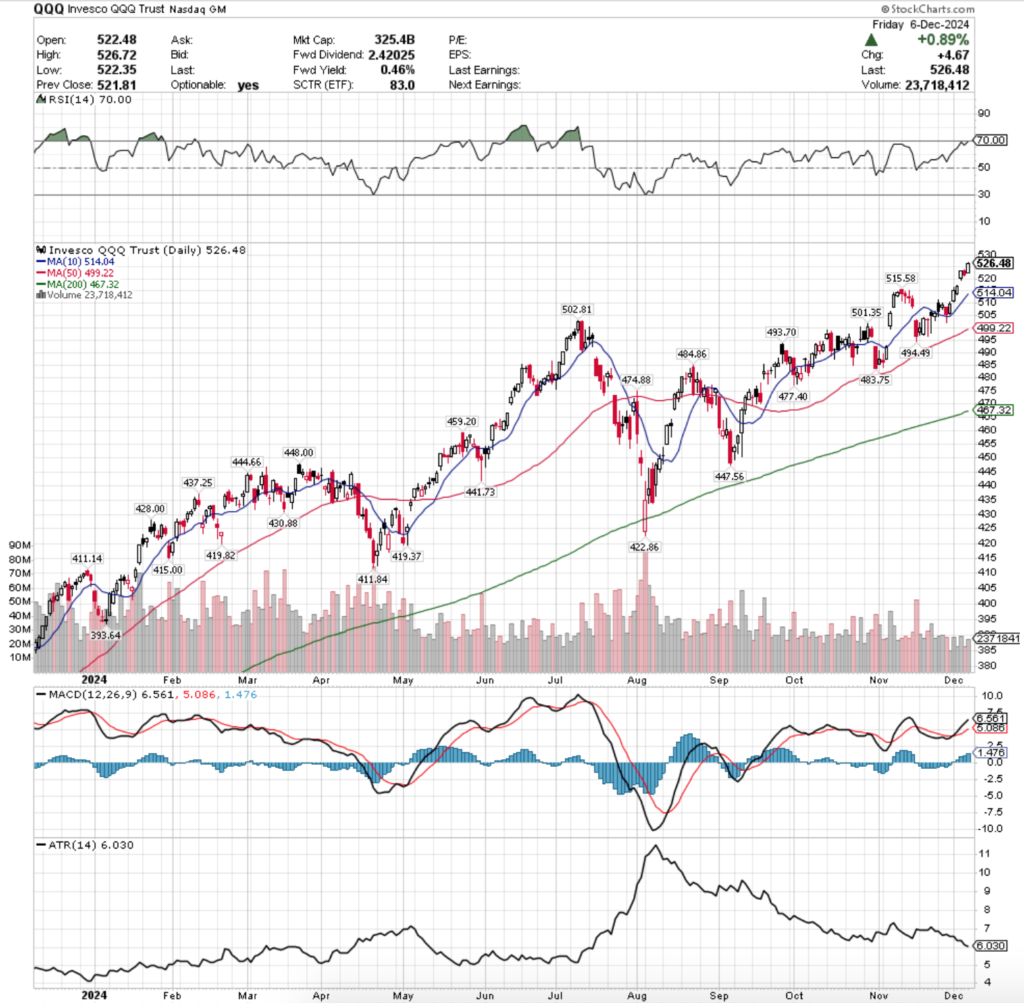
QQQ, the Invesco QQQ Trust ETF advanced +3.28%, as investors favored the tech-heavy index the most out of the major four index ETFs.
QQQ ETF – Invesco QQQ Trust ETF’s Technical Performance Over The Past Year
Their RSI closed at the overbought level of 70 on Friday, while their MACD remains bullish in the wake of Wednesday’s gap up session.
Volumes were -40.9% lower than the prior year’s average (22,354,000 vs. 37,825,929), as market participants were just as wary of QQQ as they were of jumping into SPY.
This should be noted, as SPY’s week featured weak volume but smaller daily ranges covered by their candlesticks compared to the broader sessions of QQQ’s week.
Monday kicked the week off on a gap up open for QQQ, which continued rising on the week’s second highest volume.
Tuesday volumes decreased but the advances continued for QQQ as prices were able to break back above the $515/share price level.
Wednesday opened on a gap up for QQQ much like it did for SPY on the week’s strongest volume, before profit taking commenced on Thursday & QQQ declined.
Friday the week closed on a high note with a new all-time high being set.
This coming week will hope to see higher volumes for QQQ, as it is difficult to continue climbing with such weak participation at all-time highs.
Even if QQQ’s price can manage to notch another all-time high this week, the current environment’s sentiment is running on fumes & is not sustainable for much longer.
QQQ’s next support level is currently -2% below Friday’s closing price, which is just above their 10 day moving average.
Should those break down there aren’t any support levels for an additional -2.5%, at which point price would be wedged between the resistance of the 10 day moving average & the support of the 50 DMA.
It should be noted that most of the support levels for the first ~8-9% of declines from QQQ’s closing price on Friday have not faced significant seller pressure over the past ~2 years, which will be something to be mindful of in the event of retests in the near-future.
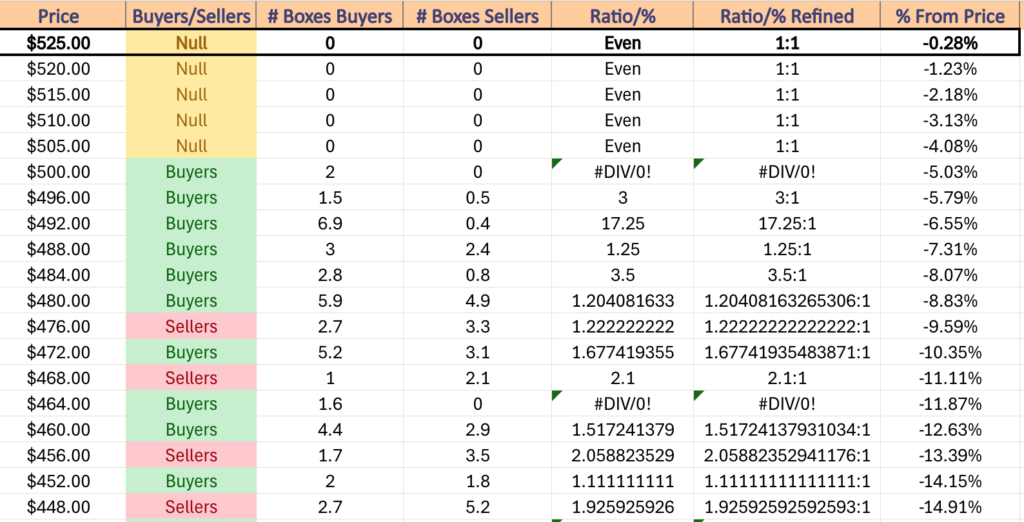
QQQ has support at the $515.58 (Volume Sentiment: NULL, 0:0*), $514.04 (10 Day Moving Average, Volume Sentiment: NULL, 0:0*), $502.81 (Volume Sentiment: Buyers, 2:0*) & $501.35/share (Volume Sentiment: Buyers, 2:0*) price levels, with resistance at the $526.72/share (All-Time High, Volume Sentiment: NULL, 0:0*) price levels.
QQQ ETF’s Price Level:Volume Sentiment Over The Past ~2 Years
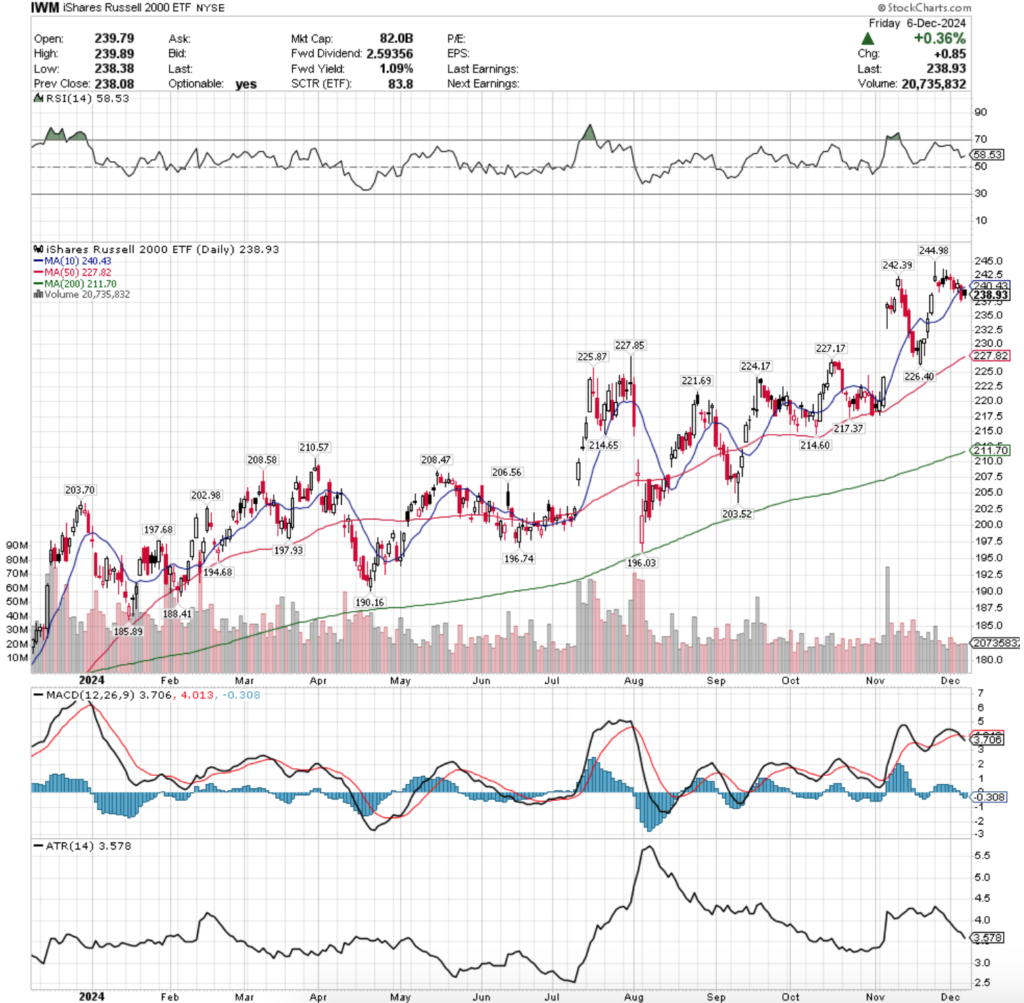
IWM ETF – iShares Russell 2000 ETF’s Technical Performance Over The Past Year
Their RSI is currently at 58.53, while their MACD crossed over the signal line bearishly on Thursday.
Volumes were -33.9% lower than the prior year’s average (21,508,000 vs. 32,537,075), as market participants were even unenthusiastic about the small cap index.
Given that IWM declined on low volume it is not as bad of a sentiment reading than QQQ who advanced on even lower volume, but it is still a signal to take caution.
Monday set the stage for the week of declines, as the highest volume of the week came on a session that resulted in a hanging man candle whose lower shadow extended all the way down to the $240/share level.
Tuesday IWM’s slide continued as the session opened lower, attempted to reach the open of Monday’s session but was unable to & the rest of the session was spent in decline.
Wednesday the bleeding was temporarily halted, but there was a lot of uncertainty in the air given the week’s lowest volume session also resulted in a spinning top candle whose lower shadow was perched atop of the support of the 10 day moving average.
Thursday that support gave way shortly after the session’s open & the $237.50/share level was briefly touched, but IWM was able to close just above it, leading into Friday’s gap up open that proceeded to decline as the day wore on.
Friday’s session formed a bearish harami pattern with Thursday’s, which is troubling entering a new week when the nearest support level for IWM is -4.64% below their closing price on Friday.
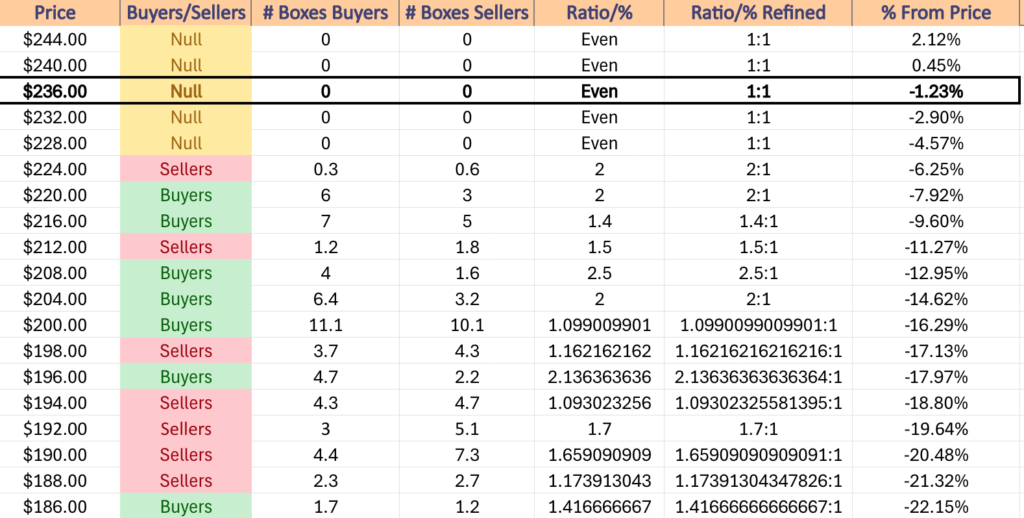
The good news for IWM is that the 50 day moving average and another support level reside in the $227-228/share price range, but the bad news is that over the past ~2 years there has been 2 Sellers for every Buyer at this price level.
This is particularly bad for IWM here as this price level upon being reached has often resulted in further declines, which will be something to be mindful of in the event of a retest.
The good news in the event of a retest is that there are lots of support touch points below it, but to reach those levels the price would have to pass below the 50 day moving average’s support, placing it then below both the 10 & 50 DMAs.
IWM has support at the $227.85 (Volume Sentiment: Sellers, 2:1), $227.82 (50 Day Moving Average, Volume Sentiment: Sellers, 2:1), $227.17 (Volume Sentiment: Sellers, 2:1) & $225.87/share (Volume Sentiment: Sellers, 2:1) price levels, with resistance at the $240.43 (10 Day Moving Average, Volume Sentiment: NULL, 0:0*), $242.39 (Volume Sentiment: NULL, 0:0*) & $244.98/share (All-Time High, Volume Sentiment: NULL, 0:0*) price levels.
IWM ETF’s Price Level:Volume Sentiment Over The Past ~2 Years
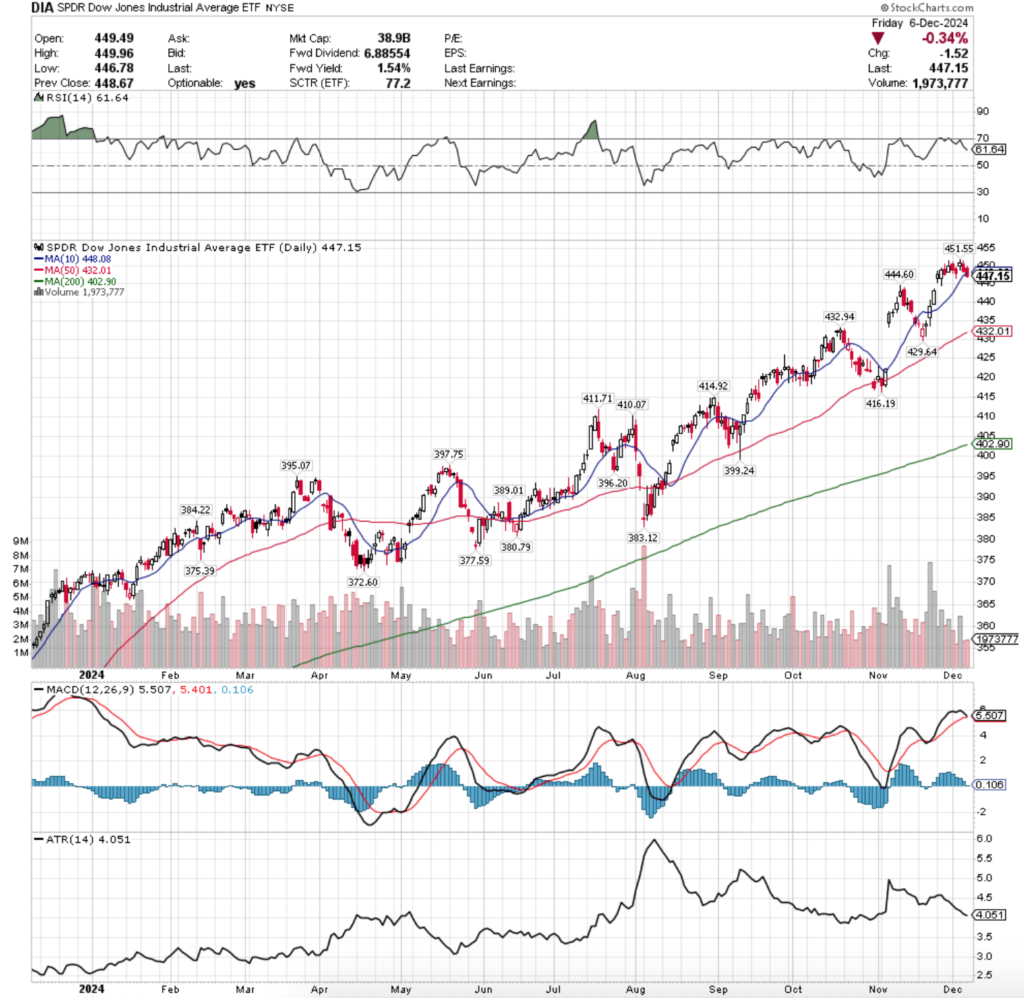
DIA ETF – SPDR Dow Jones Industrial Average ETF’s Technical Performance Over The Past Year
Their RSI is trending back towards neutral & sits currently at 61.64, while their MACD is set to cross over the signal line bearishly on Monday.
Volumes were -31% lower than the previous year’s average (2,388,000 vs. 3,460,000) & market participants were even not diving into the safety of blue chip names near these all-time highs across the major four indexes.
One thing that jumps out immediately when looking at DIA’s chart is that Friday’s close occurred below the support of the 10 day moving average while the price still sits on the island that formed two weeks ago.
Much like IWM, DIA started the week off on a foreboding note with a session that opened higher than Friday’s close, tested slightly higher briefly, before ultimately declining.
Tuesday followed suit & DIA continued lower, but managed to close down only midway through the day’s total range.
Wednesday showed some brief optimism by opening on a gap up, but uncertainty was the story coming into the close as the session ended as a spinning top candle on the highest volume of the week & a new all-time high was hit for DIA.
Thursday the declines continued, although there was an attempt made to reach the high of Wednesday & set another all-time high, but market participants did not want to assume more risk.
Risk-off sentiment continued into the weekend, as the third highest volume of the week came on Friday’s declining session that broke through the support of the 10 DMA.
This week will be important to keep an eye on the window that created the island that DIA’s been trading on for the past two weeks or so, as now that it has broken through the support of the 10 DMA it looks set to potentially fill the gap.
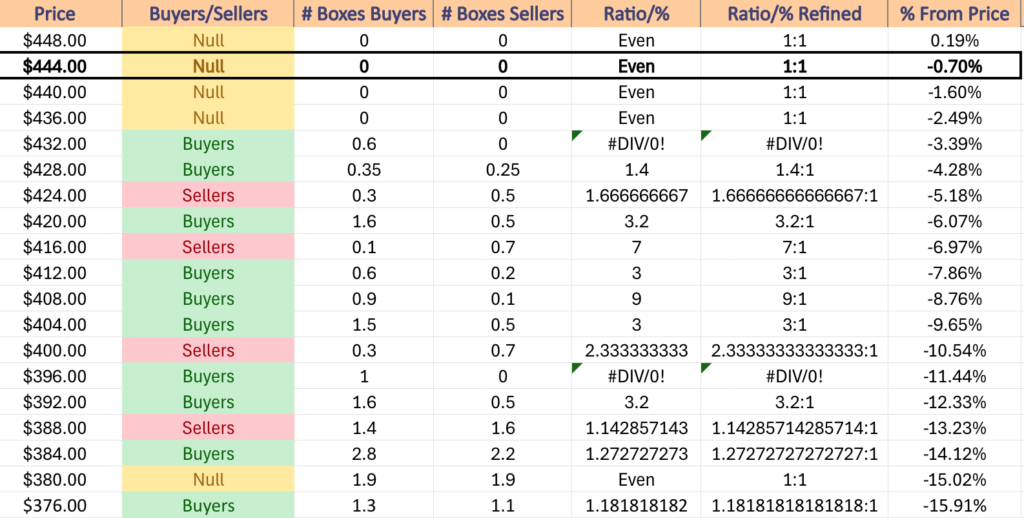
Another area of interest to observe is that if the $444.60/share support level is broken through in the coming days, the next support level doesn’t occur for another -2.6% (-3.6% total from Friday’s closing price).
If that breaks down then price will enter into a range where there have historically been some strong Sellers:Buyers until the $414.92/share support level is reached.
As with all of the others above, when this close to all-time highs & on such weak volumes there is not much point to describing potential upside activity.
DIA has support at the $444.60 (Volume Sentiment: NULL, 0:0*), $432.94 (Volume Sentiment: Buyers, 0.6:0*), $432.01 (50 Day Moving Average, Volume Sentiment: Buyers, 0.6:0*) & $429.64/share (Volume Sentiment: Buyers, 1.4:1) price levels, with resistance at the $448.08 (10 Day Moving Average, Volume Sentiment: ) & $451.55/share (All-Time High, Volume Sentiment: NULL, 0:0*) price levels.
DIA ETF’s Price Level:Volume Sentiment Over The Past ~4 Years
The Week Ahead
Monday kicks the week off with Wholesale Inventories data at 10 am.
Hello Group reports earnings before Monday’s opening bell, followed by Toll Brothers, Braze, C3.ai, Casey’s General, MongoDB, Oracle, Phreesia, Vail Resorts & Yext after the session’s close.
NFIB Optimism Index data is released Tuesday at 6 am, followed by U.S. Productivity (revision) data at 8:30 am.
Tuesday morning features earnings reports from Academy Sports + Outdoors, AutoZone, Designer Brands, Ferguson, G-III Apparel, Ollie’s Bargain Outlet & United Natural Foods, with Dave & Buster’s, GameStop & Stitch Fix reporting after the closing bell.
Wednesday brings us Consumer Price Index, CPI Year-over-Year, Core CPI & Core CPI Year-over-Year data at 8:30 am, followed by Month U.S. Federal Budget data at 2pm.
Cognyte Software, Photronics & REV Group report earnings on Wednesday morning, with Adobe, Nordson & Oxford Industries reporting after the session closes.
Initial Jobless Claims, Producer Price Index, Core PPI, PPI Year-over-Year & Core PPI Year-over-Year data are all scheduled to be released Thursday morning at 8:30 am.
Thursday morning’s earnings report comes from Ciena, with Broadcom, Costco Wholesale & RH reporting after the closing bell.
Friday winds the week down with Import Price Index & Import Price Index minus Fuel data at 8:30 am & there are no noteworthy earnings reports scheduled for the day.
See you back here next week!
*** I DO NOT OWN SHARES OR OPTIONS CONTRACT POSITIONS IN SPY, QQQ, IWM OR DIA AT THE TIME OF PUBLISHING THIS ARTICLE ***
The VIX closed at 12.77, indicating an implied one day move of +/-0.81% & an implied one month move of +/-3.69% for the S&P 500.
Highest Technical Rated S&P 500 Components Per 12/6/2024’s Close:
1 – PLTR
2 – AXON
3 – TSLA
4 – UAL
5 – VST
6 – RCL
7 – TPL
8 – CCL
9 – GDDY
10 – TPR
Lowest Technical Rated S&P 500 Components Per 12/6/2024’s Close:
1 – CE
2 – MRNA
3 – QRVO
4 – MCHP
5 – ENPH
6 – WBA
7 – HII
8 – INTC
9 – MPWR
10 – AES
Highest Volume Rated S&P 500 Components Per 12/6/2024’s Close:
1 – LULU
2 – UNH
3 – EPAM
4 – ULTA
5 – COO
6 – HPE
7 – KMX
8 – QRVO
9 – SNPS
10 – WAB
Lowest Volume Rated S&P 500 Components Per 12/6/2024’s Close:
1 – WYNN
2 – WST
3 – SW
4 – CEG
5 – FRT
6 – K
7 – RMD
8 – DOV
9 – IP
10 – GPN
Highest Technical Rated ETFs Per 12/6/2024’s Close:
1 – TSLR
2 – TSLL
3 – TSLT
4 – GXLM
5 – BITW
6 – VCAR
7 – TSL
8 – DEFG
9 – CONL
10 – BITX
Lowest Technical Rated ETFs Per 12/6/2024’s Close:
1 – TSLZ
2 – TSDD
3 – MSOX
4 – TSLQ
5 – TSLS
6 – SARK
7 – UVIX
8 – WEBS
9 – MRNY
10 – NVDQ
Highest Volume Rated ETFs Per 12/6/2024’s Close:
1 – TBFG
2 – KLXY
3 – KPOP
4 – FEUZ
5 – FCA
6 – CEFA
7 – TMDV
8 – ASIA
9 – HTUS
10 – FLDZ
Lowest Volume Rated ETFs Per 12/6/2024’s Close:
1 – SEPT
2 – CCNR
3 – SIO
4 – GSID
5 – UNIY
6 – PSMD
7 – BHYB
8 – AAPR
9 – CVRD
10 – MDLV
Highest Technical Rated General Stocks Per 12/6/2024’s Close:
1 – QUBT
2 – XCUR
3 – LEEED
4 – UAMY
5 – CBDS
6 – QBTS
7 – RGTI
8 – SATL
9 – UMAC
10 – KULR
Lowest Technical Rated General Stocks Per 12/6/2024’s Close:
1 – CLVR
2 – NXMH
3 – RLMD
4 – EFSH
5 – CETX
6 – APLT
7 – ELAB
8 – ELPW
9 – LUXH
10 – CRKN
Highest Volume Rated General Stocks Per 12/6/2024’s Close:
1 – SLG
2 – UPC
3 – SBET
4 – MAMA
5 – ZBAO
6 – LICN
7 – ALBT
8 – ADD
9 – GXAI
10 – MYNA
Lowest Volume Rated General Stocks Per 12/6/2024’s Close:
1 – CCWOF
2 – PKKFF
3 – ADMT
4 – SVBL
5 – AIJTY
6 – PLLTL
7 – MBXBF
8 – WHLM
9 – VERO
10 – PRMNF
*** THE LIST ABOVE IS STRICTLY FOR INFORMATIONAL PURPOSES – I MAY OR MAY NOT HAVE OR INITIATE A LONG, SHORT, OR LONG/SHORT POSITION IN ANY NAME ABOVE AT ANY TIME ***