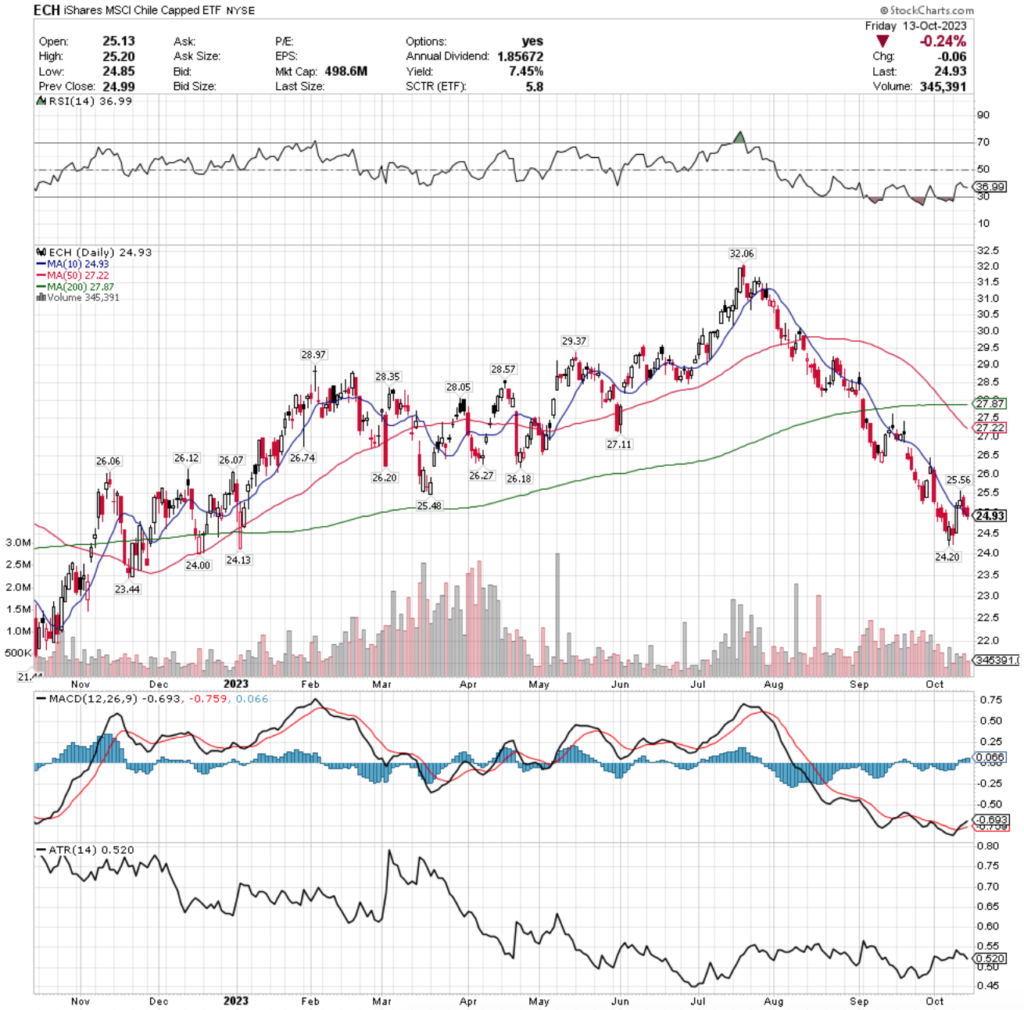
Microsoft Corp. stock trades under the ticker MSFT & has had an excellent past year, advancing +53.32% (ex-dividends).
They currently sit -3.07% below their 52-week high (November 2023) & have climbed +69.83% since their 52-week low from January of 2023.
While this close to their 52-week high & with broader markets looking as stretched thin as they do, it’s a good time to analyze how market participants have behaved at each price level that they have traded at over the past couple of years.
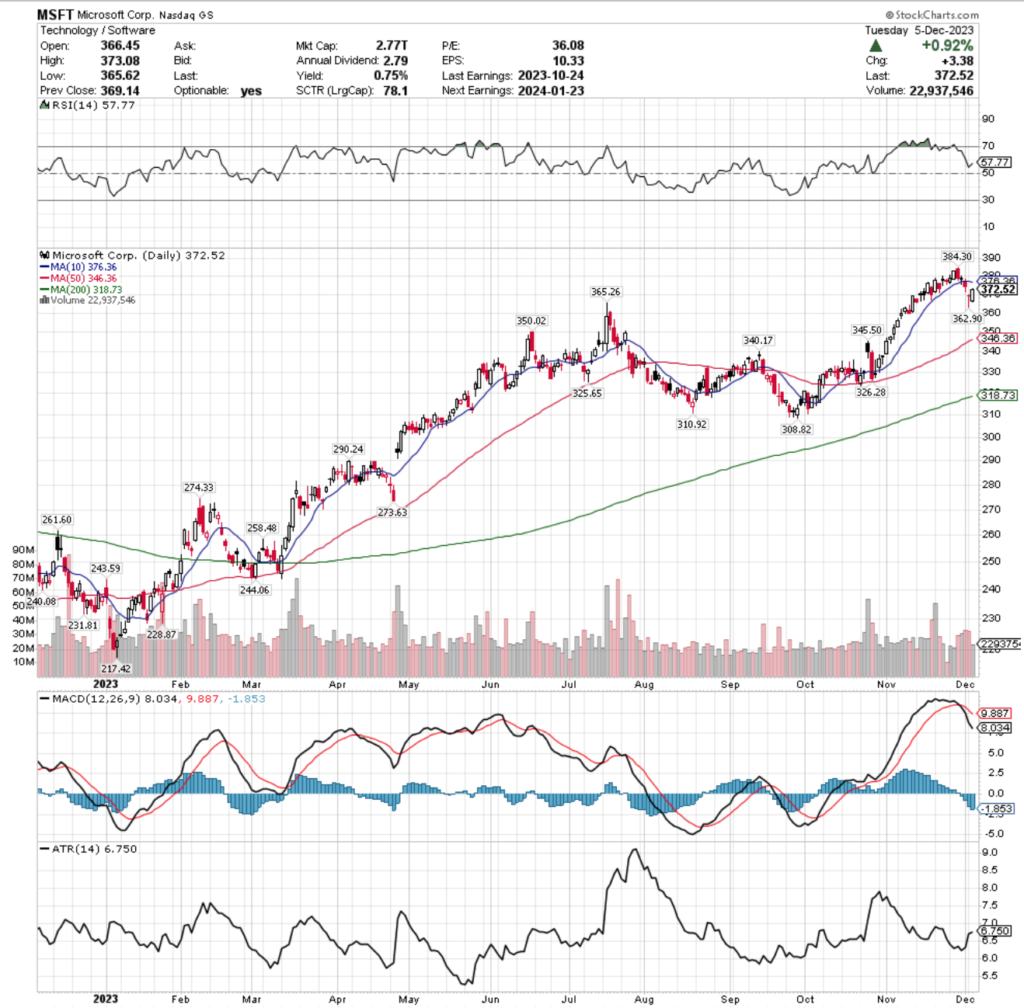
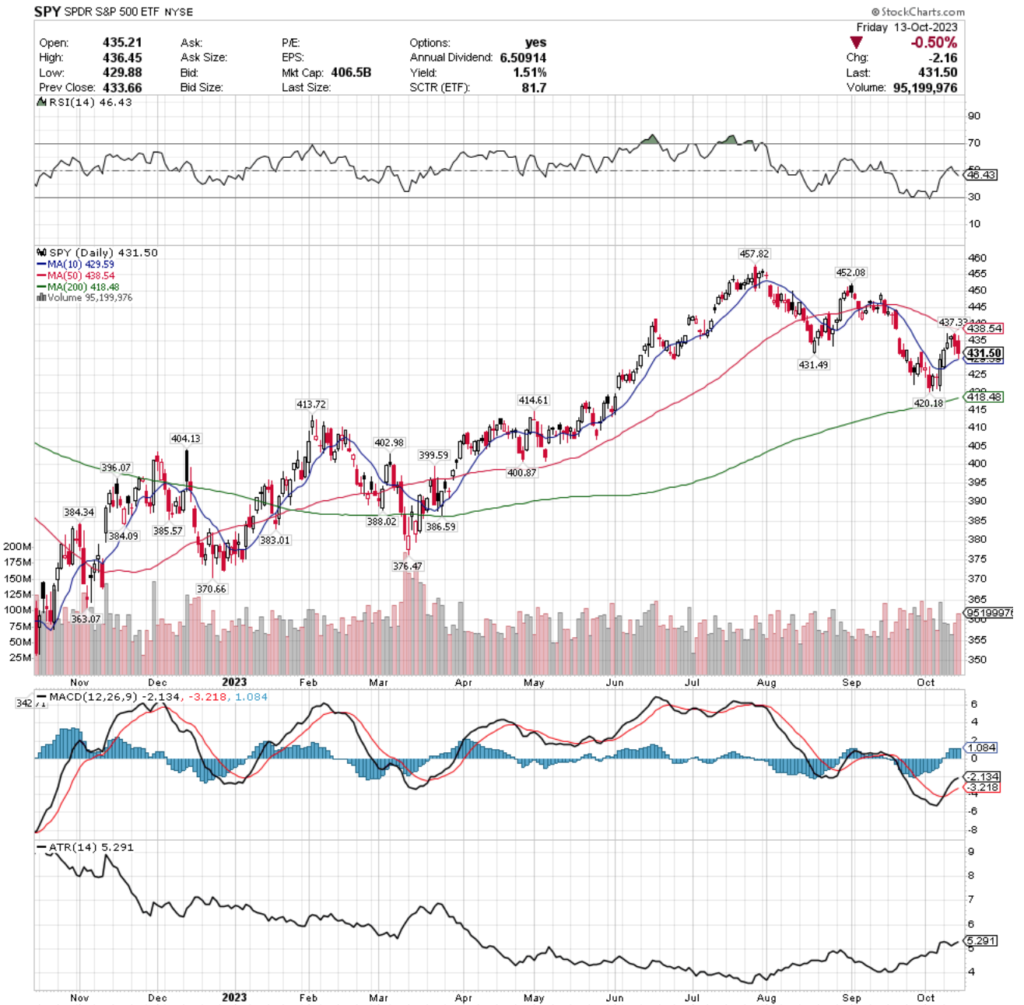
Microsoft Corp. MSFT Stock’s Technical Performance Over The Past Year
After hitting a fresh 52-week high a week & a half ago, MSFT stock has seen folks taking profits off of the table, which has led to their RSI retreating back towards neutral from the overbought range it was in & it now sits at 57.77.
Their MACD has accordingly been bearish for the past week,with the support of the 10 day moving average being broken through on last Thursday’s declining session.
Volumes over the past week (including yesterday) have still been +5.8% above average compared to the year prior (29,527,480 vs. 27,909,797.61), which is worth noting after a week where SPY’s volumes were -23.93% below average, QQQ’s volumes were -31.47% below average, IWM’s volumes were +11.49% above average & DIA’s volumes were -8.7% below average (all compared to the year prior).
This is worth noting as the major indexes are clearly running out of steam & enthusiasm & while MSFT is still trading with above average volume, in the last two weeks it has primarily been dominated by the bears, as profits have been taken.
Over the past week, only last Wednesday’s bullish session’s volume has been noteworthy (for bullish volume), which resulted in a candle that would be characterized as a hanging man with a lower close than open (but still bullish session), except for the fact that the day prior’s bearish session was the establishment of the new 52-week high.
As noted above, it will be important to keep an eye on the resistance that their 10 DMA is now providing on price action & how it fares in relation to the support levels between the price & the 50 DMA, which will continue to move upwards as time passes along.
Another key area to look at is the emergence of a bearish head & shoulders pattern emerging, with the head being the 52-week high set last week & the left shoulder being either formed in July or June of 2023 (5-6 months back).
The moving averages will likely be what helps extend a consolidation range to fulfill the H&S pattern (should it play out), as the 200 DMA is currently approaching the previous consolidation ranges that led into the run up to the 52-week high from the left shoulder(s).
Friday’s candlestick is also telling, as it resulted in a dragonfly doji on a gap down session & set the stage for Monday’s session to be bullish & fill in the window created by the gap (dead cat bounce).
With such poor volume in terms of seller volume to buyer volume, more declines appear to be on the near-term horizon.
MSFT stock’s Average True Range is also flashing warning lights, with yesterday’s bullish session flattening out the indicator line, after the declining sessions prior showed it returning back to its mean.
While they have multiple support touch-points from their previous consolidation range noted above, it is important now to see how strong each of those price levels have been historically.
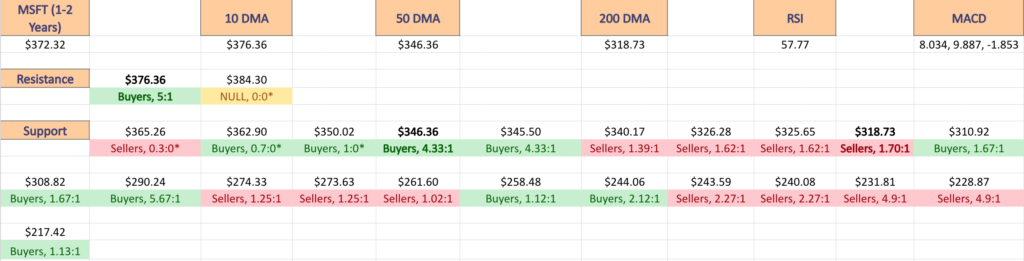
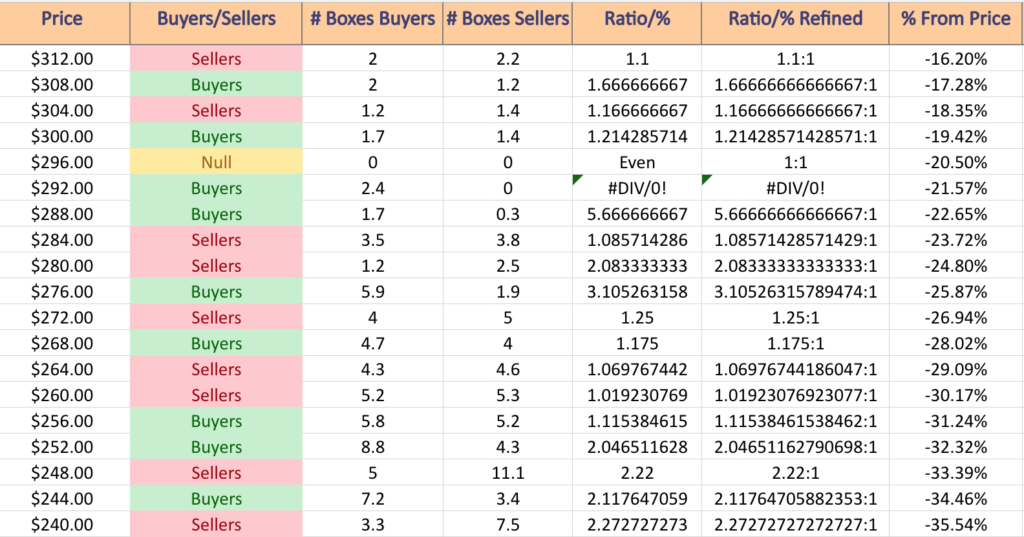
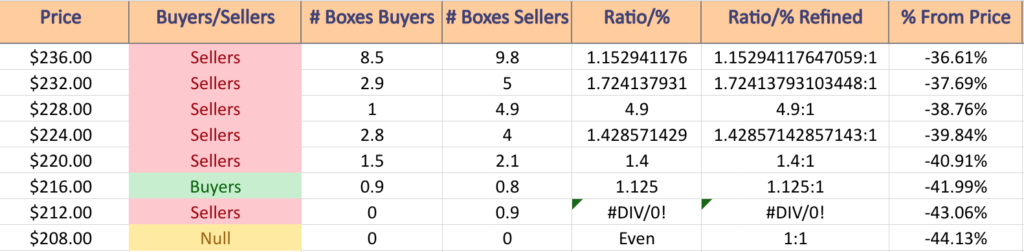
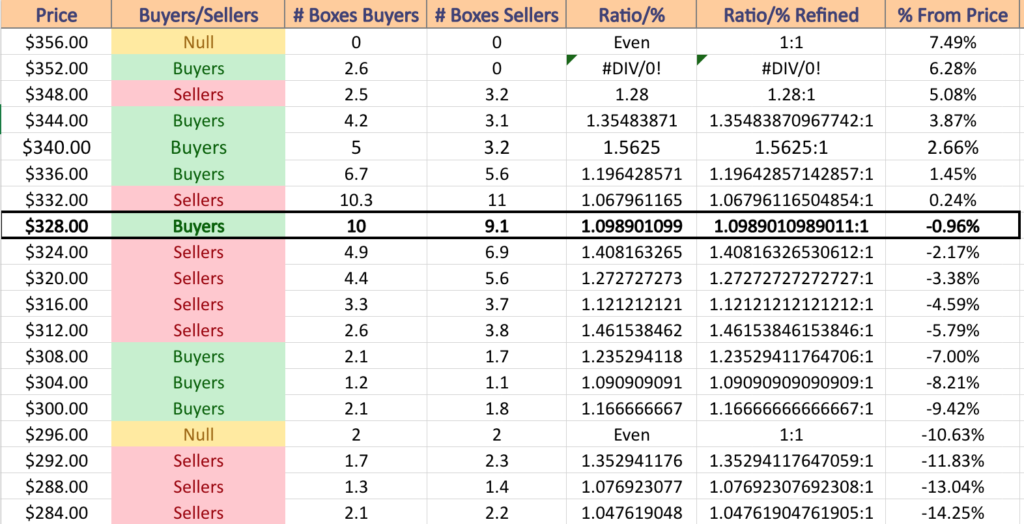
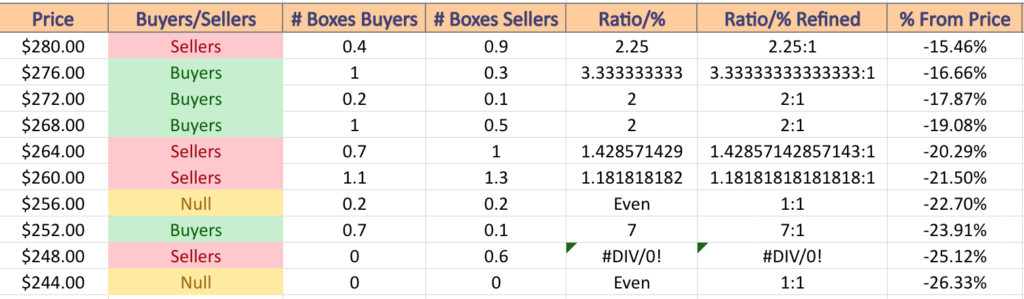
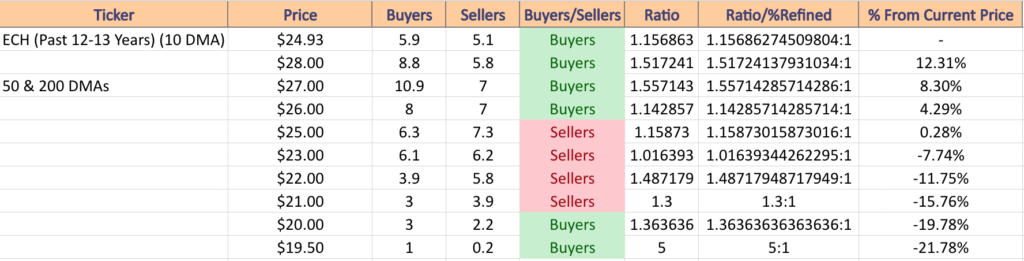
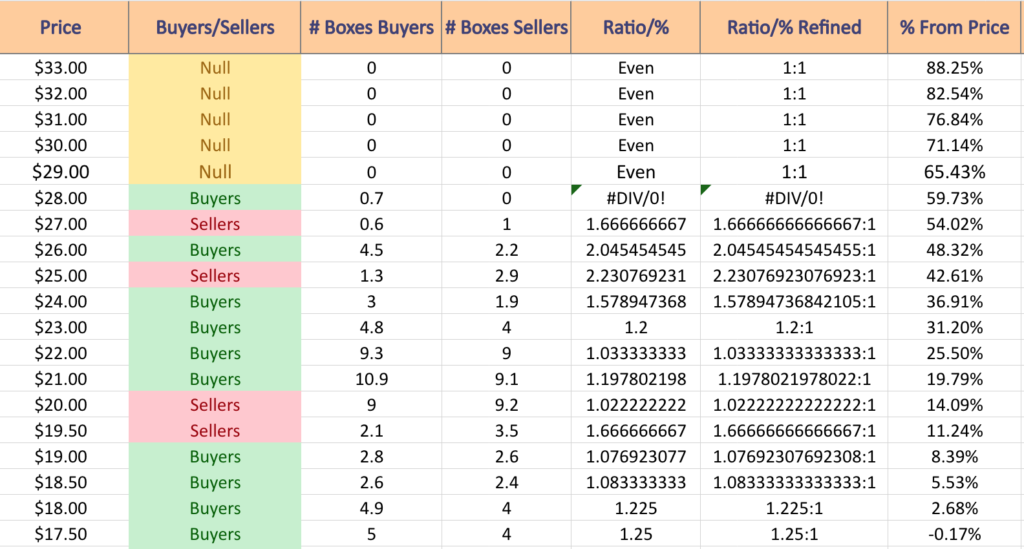
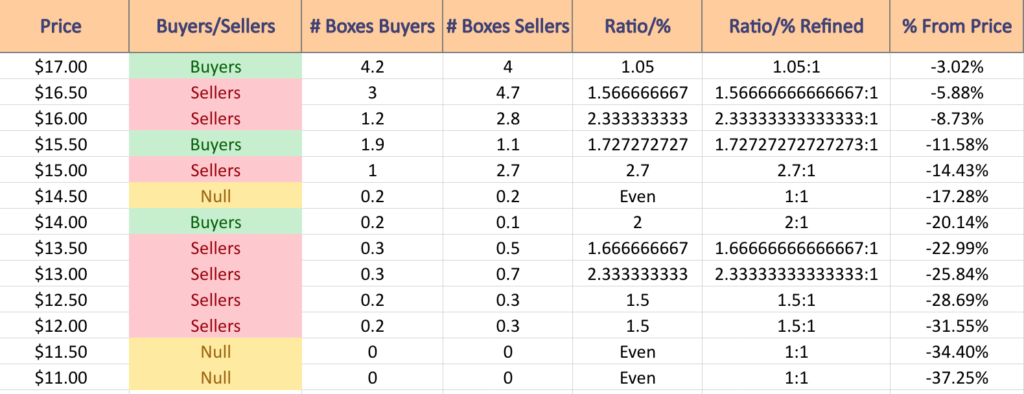
Below is the Buyers:Sellers (and vice-versa) ratio for the price levels that MSFT stock has traded at over the past 1-2 years & can serve as a guide to how strong/weak each of the support levels (& resistance levels) may be in the near-term, based on the behavior of market participants in the recent past.
It should be read as a barometer reading (not a thermometer), as while history does not repeat itself, it does often rhyme.
Microsoft Corp. MSFT Price Level:Volume Sentiment
Microsoft Corp. MSFT Stock’s Price Level:Volume Sentiment At Key Support & Resistance Levels Over The Past 1-2 Years
Microsoft Corp. MSFT Stock’s Price Level:Volume Sentiment Over The Past 1-2 Years
Microsoft Corp. MSFT Stock’s Price Level:Volume Sentiment Over The Past 1-2 Years
Microsoft Corp. MSFT Stock’s Price Level:Volume Sentiment Over The Past 1-2 Years
$388 – NULL – 0:0*; +4.21% From Current Price Level
$384 – NULL – 0:0*; +3.14% From Current Price Level
$380 – Buyers – 0.4:0*; +2.06% From Current Price Level
$376 – Buyers – 5:1; +0.99% From Current Price Level – 10 Day Moving Average*
$372 – Sellers – 2.3:0*; -0.09% From Current Price Level – Current Price Box*
$368 – Buyers – 1.36:1; -1.16% From Current Price Level
$364 – Sellers – 0.3:0*; -2.23% From Current Price Level
$360 -Buyers – 0.7:0*; -3.31% From Current Price Level
$356 – Buyers – 3.33:1; -4.38% From Current Price Level
$352 – Buyers – 1.22:1; -5.46% From Current Price Level
$348 – Buyers – 1:0*; -6.53% From Current Price Level
$344 – Buyers – 4.33:1; -7.61% From Current Price Level – 50 Day Moving Average*
$340 – Sellers – 1.39:1; -8.68% From Current Price Level
$336 – Buyers – 2.81:1; -9.76% From Current Price Level
$332 – Buyers – 1.65:1; -10.83% From Current Price Level
$328 – Buyer s- 1.24:1; -11.9% From Current Price Level
$324 – Sellers – 1.62:1; -12.98% From Current Price Level
$320 – Buyers – 1.57:1; -14.05% From Current Price Level
$316 – Sellers – 1.70:1; -15.13% From Current Price Level – 200 Day Moving Average*
$312 – Sellers – 1.1:1; -16.2% From Current Price Level
$308 – Buyers – 1.67:1; -17.28% From Current Price Level
$304 – Sellers – 1.17:1; -18.35% From Current Price Level
$300 – Buyers – 1.21:1; -19.42% From Current Price Level
$296 – NULL – 0:0*; -20.5% From Current Price Level
$292 – Buyers – 2.4:0*; -21.57% From Current Price Level
$288 – Buyers – 5.67:1; -22.65% From Current Price Level
$284 – Sellers – 1.09:1; -23.72% From Current Price Level
$280 – Sellers – 2.08:1; -24.8% From Current Price Level
$276 – Buyers – 3.11:1; -25.87% From Current Price Level
$272 – Sellers – 1.25:1; -26.94% From Current Price Level
$268 – Buyers – 1.18:1; -28.02% From Current Price Level
$264 – Sellers – 1.07:1; -29.09% From Current Price Level
$260 – Sellers – 1.02:1; -30.17% From Current Price Level
$256 – Buyers – 1.12:1; -31.24% From Current Price Level
$252 – Buyers – 2.05:1; -32.32% From Current Price Level
$248 – Sellers – 2.22:1; -33.39% From Current Price Level
$244 – Buyers – 2.12:1; -34.46% From Current Price Level
$240 – Sellers – 2.27:1; -35.54% From Current Price Level
$236 – Sellers – 1.15:1; -36.61% From Current Price Level
$232 – Sellers – 1.72:1; -37.69% From Current Price Level
$228 – Sellers – 4.9:1; -38.76% From Current Price Level
$224 – Sellers – 1.43:1; -39.84% From Current Price Level
$220 – Sellers – 1.4:1; -40.91% From Current Price Level
$216 – Buyers – 1.13:1; -41.99% From Current Price Level
$212 – Sellers – 0.9:0*; -43.06% From Current Price Level
$208 – NULL – 0:0*; -44.13% From Current Price Level
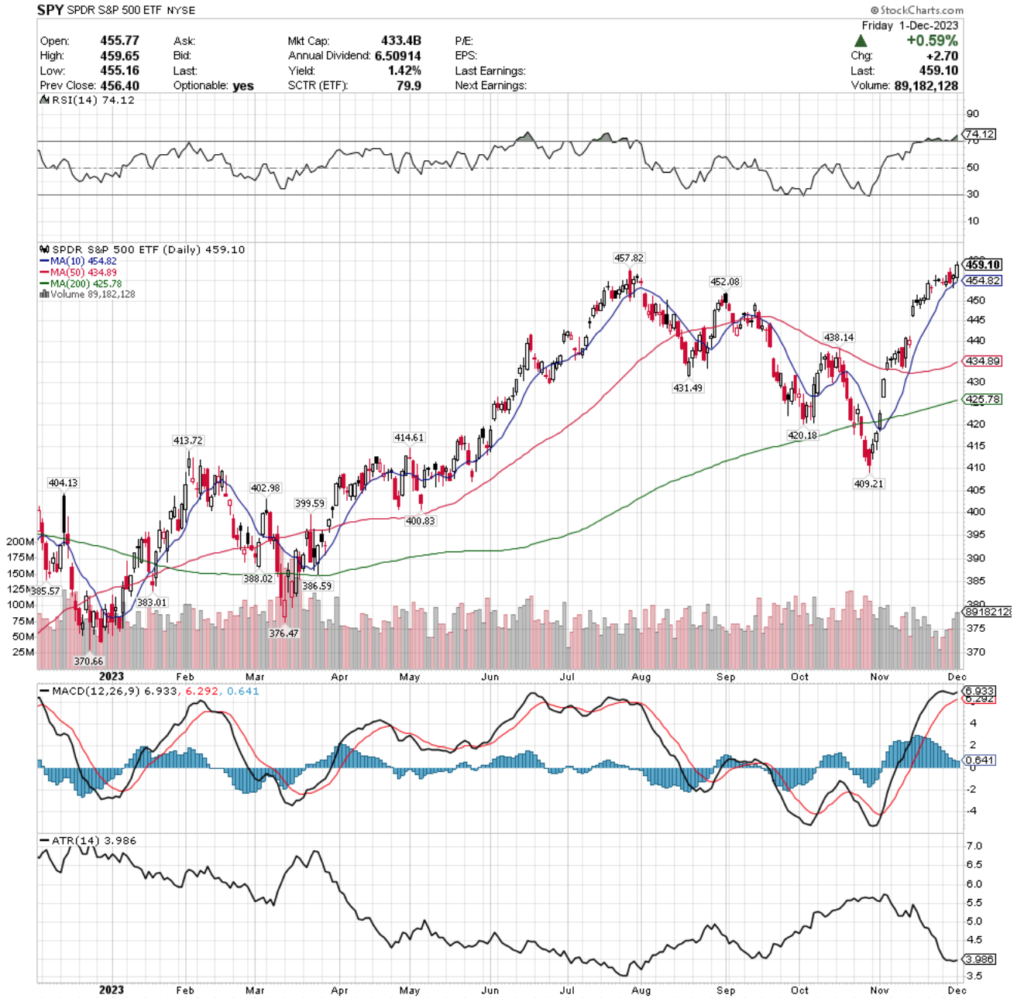
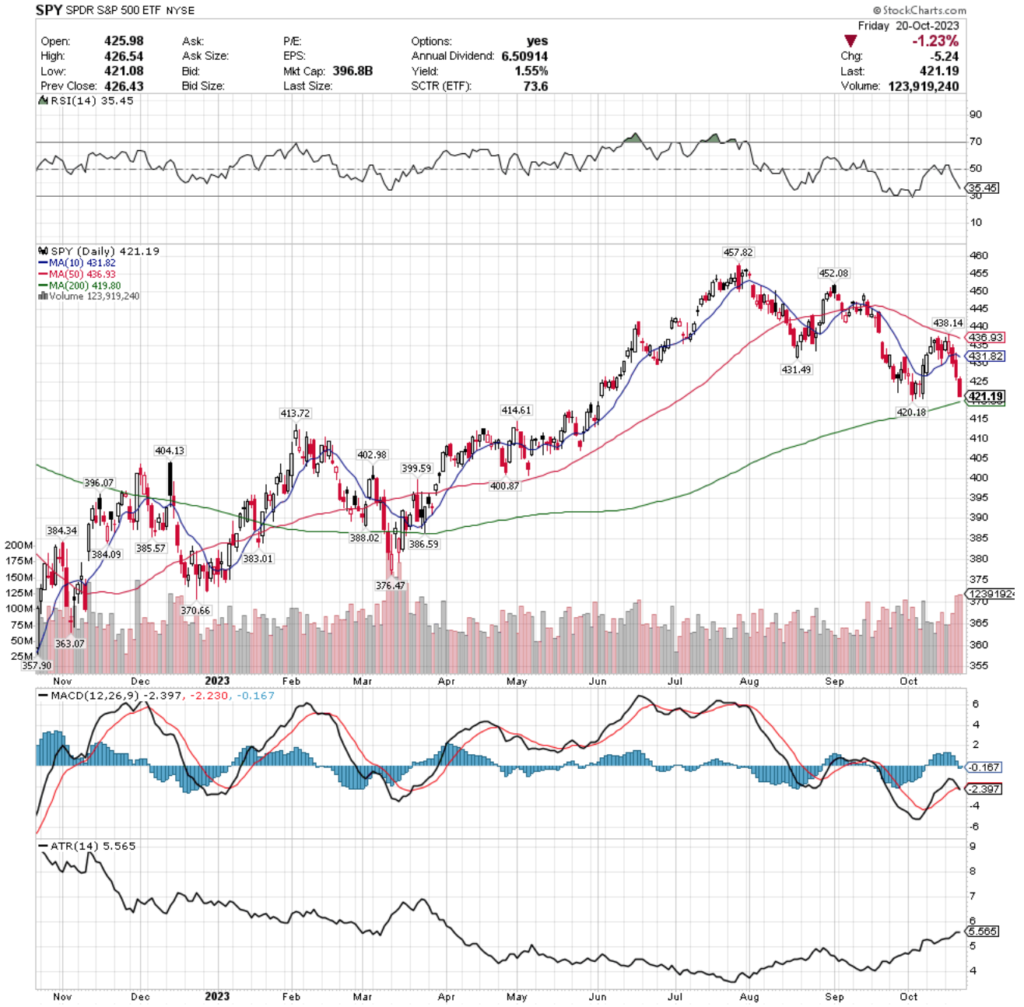
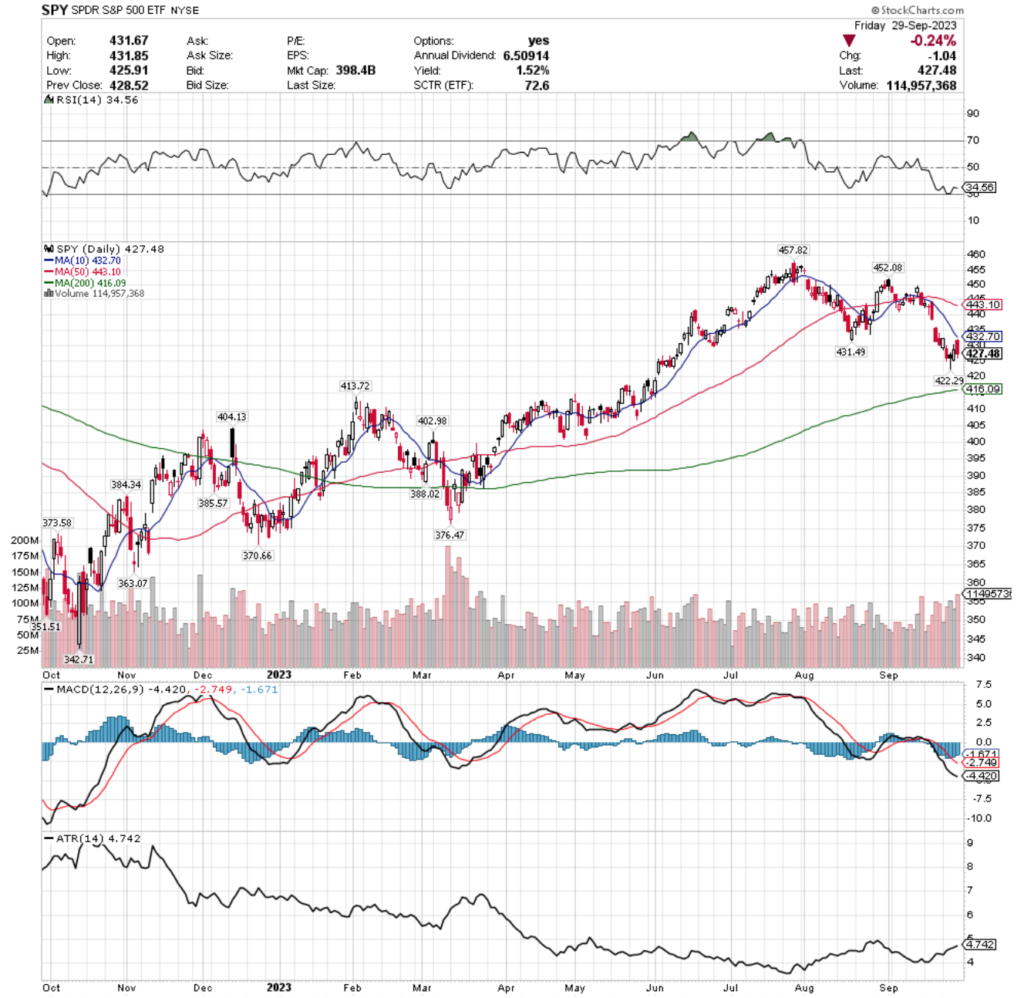
SPY, the SPDR S&P 500 ETF gained +0.83% last week, as investors favored the Russell 2000 small caps & Dow Jones Industrial Average.
SPY ETF – SPDR S&P 500 ETF’s Technical Performance Over The Past Year
Their RSI is overbought at 74.12, with a MACD that is still bullish, but hanging on for life & trying to advance into more overbought territory, but looks set to roll over bearishly in the coming days.
Volumes were -23.93% below average last week compared to the year prior (62,392,500 vs. 82,018,080), with Thursday & Friday being the highest volume days of the week & Friday’s volume levels did not surpass last week’s high of volume, showing hesitancy on the part of market participants.
While volumes advanced day-over-day throughout the week, this is a signal of uncertainty, despite the recent 52-week high & not to be viewed as increasing confidence during the week.
Monday the week kicked off with a declining session with a doji candle, kicking the week off on the theme of caution.
Tuesday’s spinning top candle’s real body was concentrated in the lower range of the over candle, signaling that downside movement was imminent & that there was reluctance to edge higher.
Wednesday showed signs of optimism, with the open being above the day prior’s close & an upper shadow that tried to break higher, but profits were taken throughout the day’s session, pushing the prices lower until the day closed out lower than Tuesday’s session & with a slight lower shadow dipping into Tuesday’s candle’s real body.
Another sign of uncertainty emerged on Thursday, where the session opened higher than the day prior’s close, tested lower & dipped beneath the 10 day moving average’s support, but ultimately recovered as investors piled in & resulted in a spinning top with the real body of the candle concentrated on the high end of the day’s session, with a small upper shadow.
Friday resembled a last minute specialist breakout to the upside, testing the lower range of the candle’s shadow against the support of the 10 day moving average which held strong, but the upper shadow above the bullish close was roughly the same size as the lower shadow, which is not indicative of strength & signals further cautious outlook on the part of market participants.
Their Average True Range does not indicate a strong trend is in place, but has begun to flatten out after a half month of decline, signaling that we are likely to see a pivotal moment in the coming week; whether the new trend is up or down.
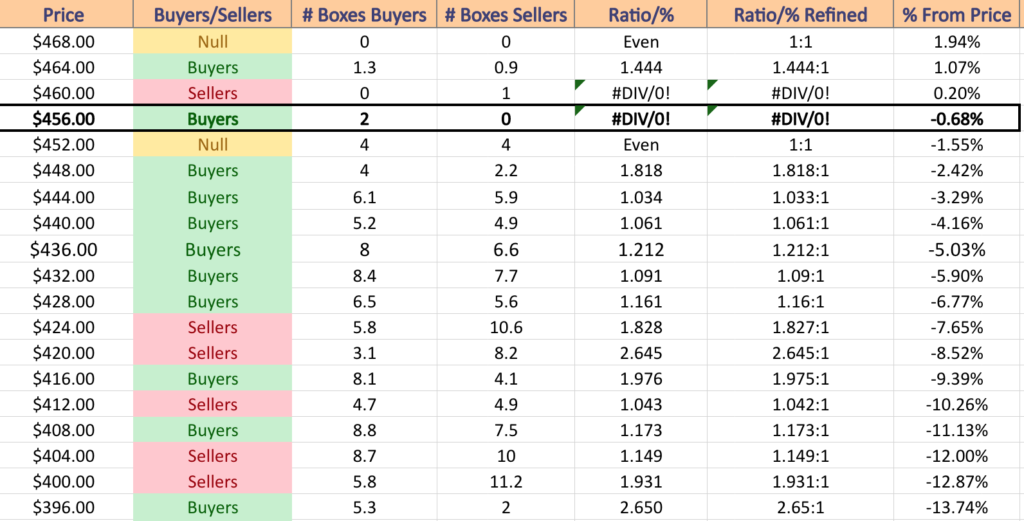
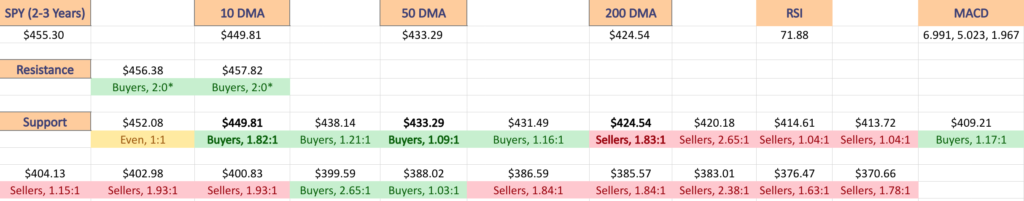
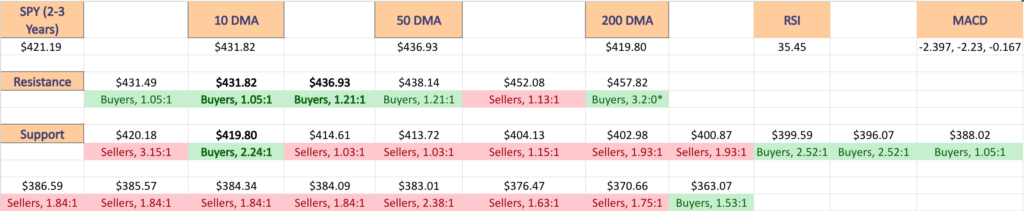
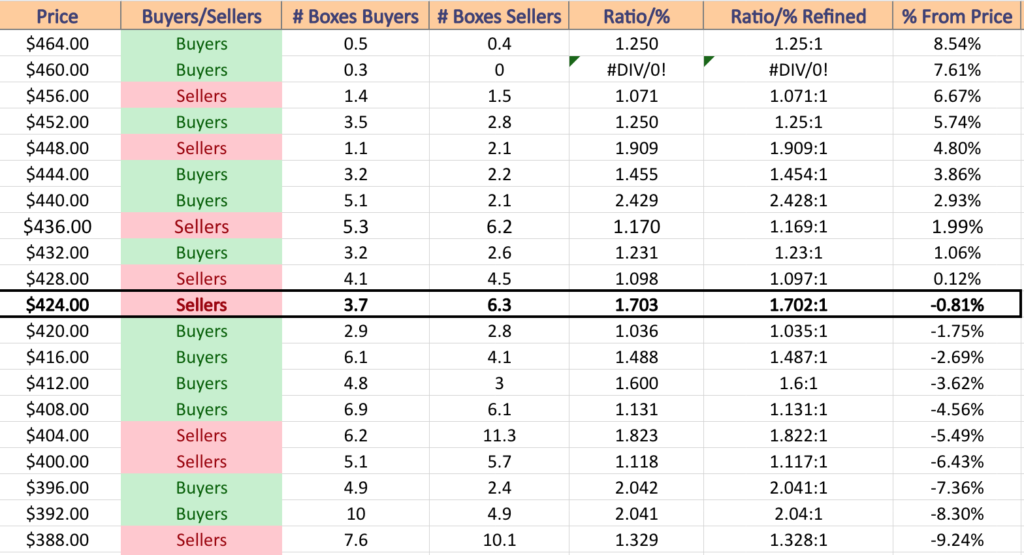
SPY has support at the $457.82 (Volume Sentiment: Buyers, 2:0*), $454.82 (10 Day Moving Average; Volume Sentiment: Even, 1:1), $452.08 (Volume Sentiment: Even, 1:1) & $438.14/share (Volume Sentiment: Buyers, 1.21:1) price levels, with no resistance levels in the past year as the price is currently at a new 52-week high (Volume Sentiment: NULL, 0:0*).
SPY ETF’s Price Level:Volume Sentiment Over The Past 2-3 Years
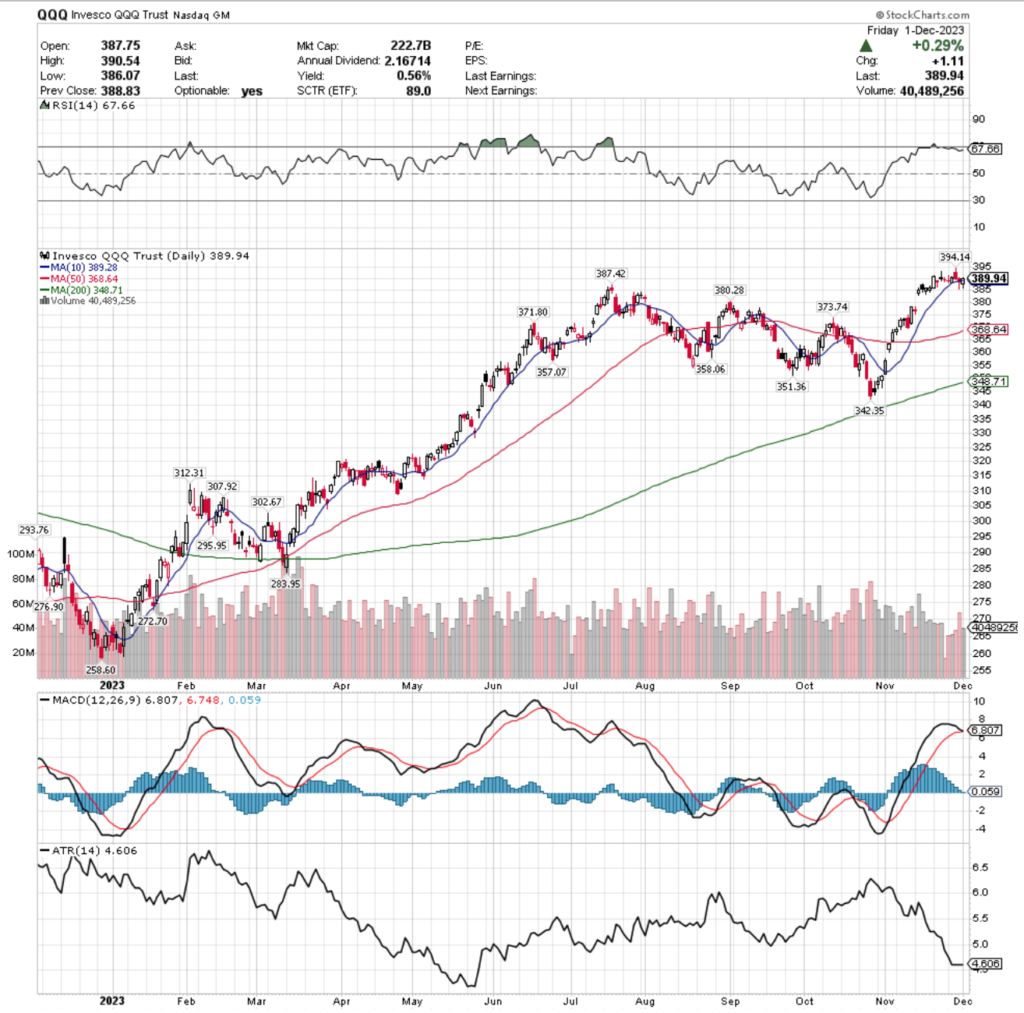
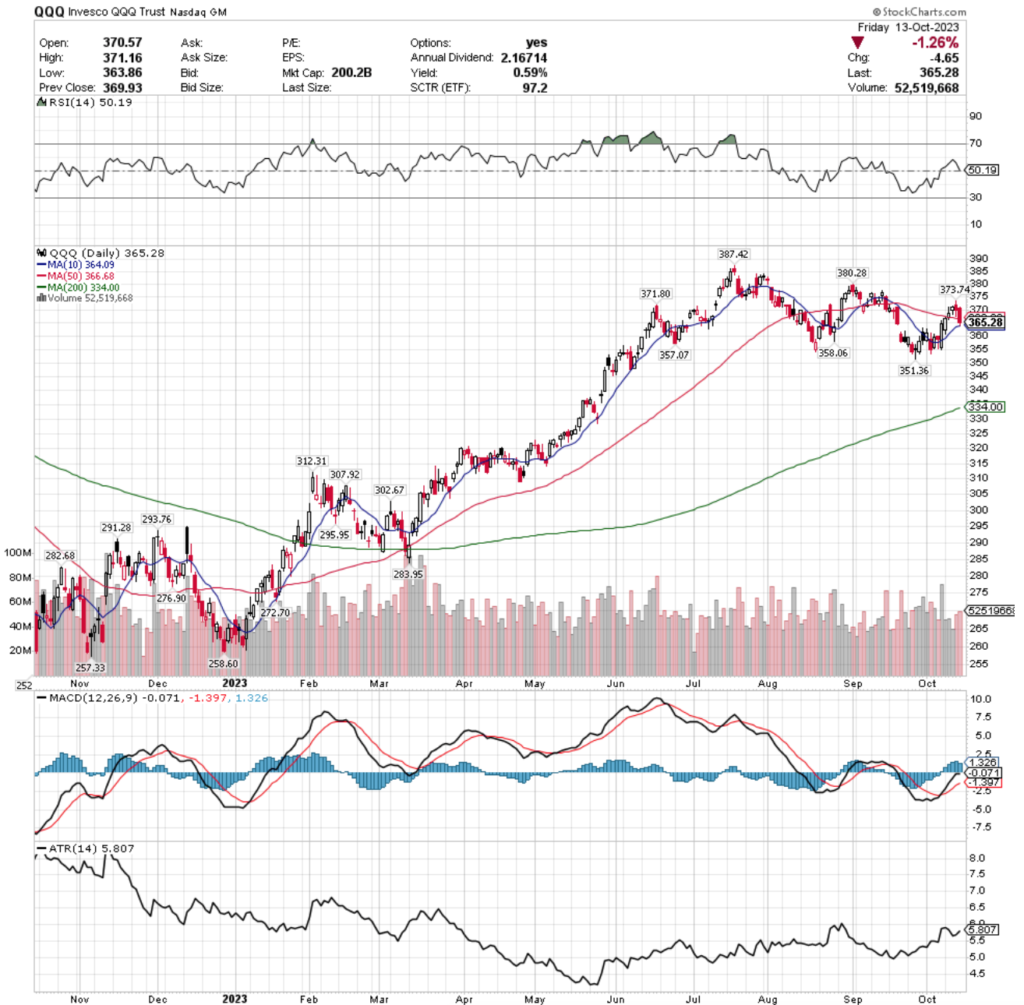
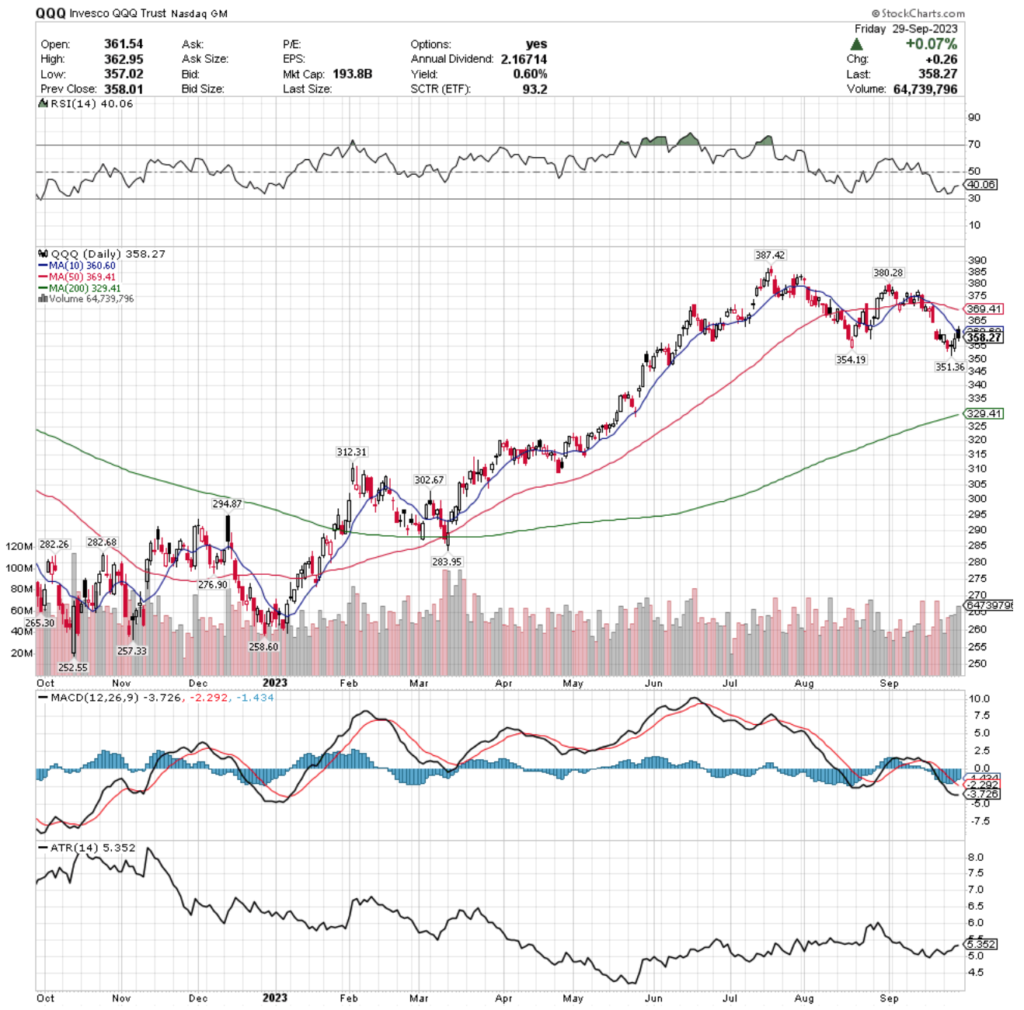
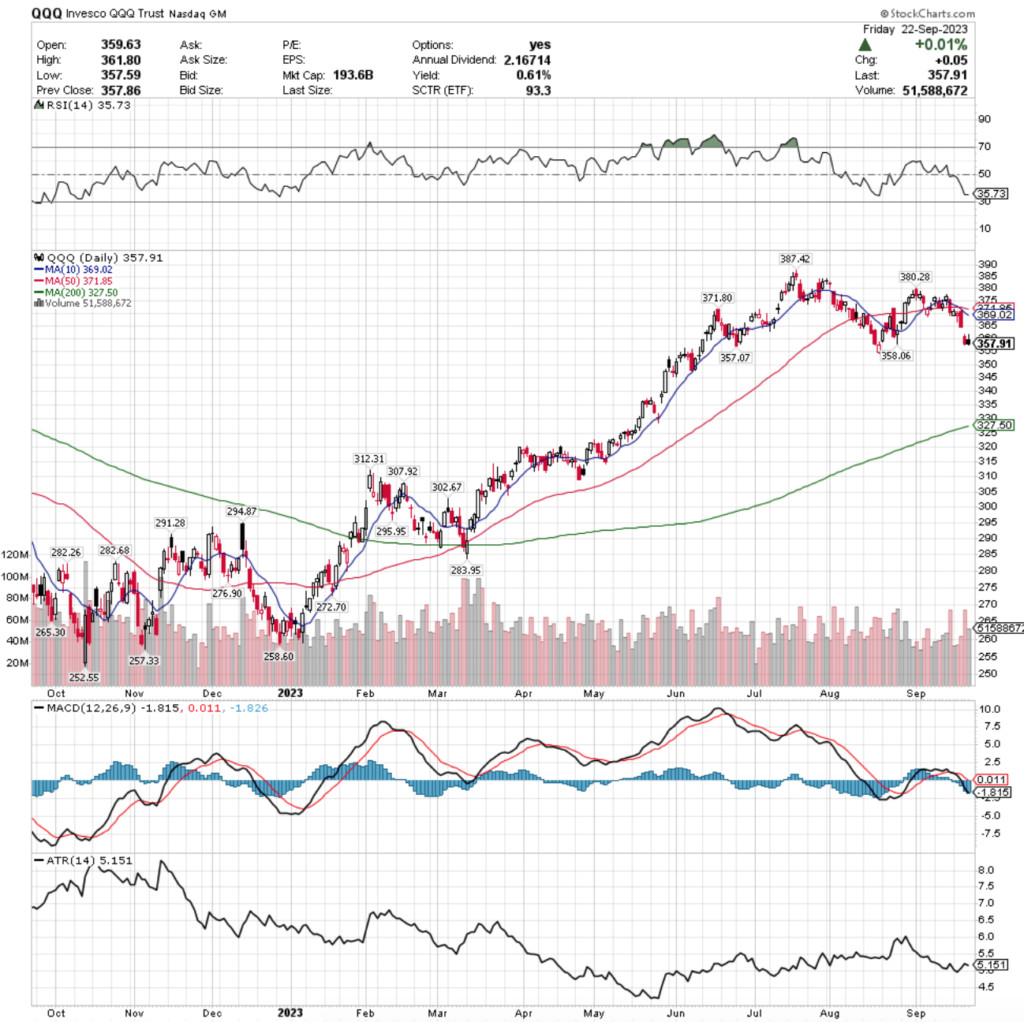
QQQ, the Invesco QQQ Trust ETF has the weakest week of the major indexes, nudging forward +0.11%, basically treading water.
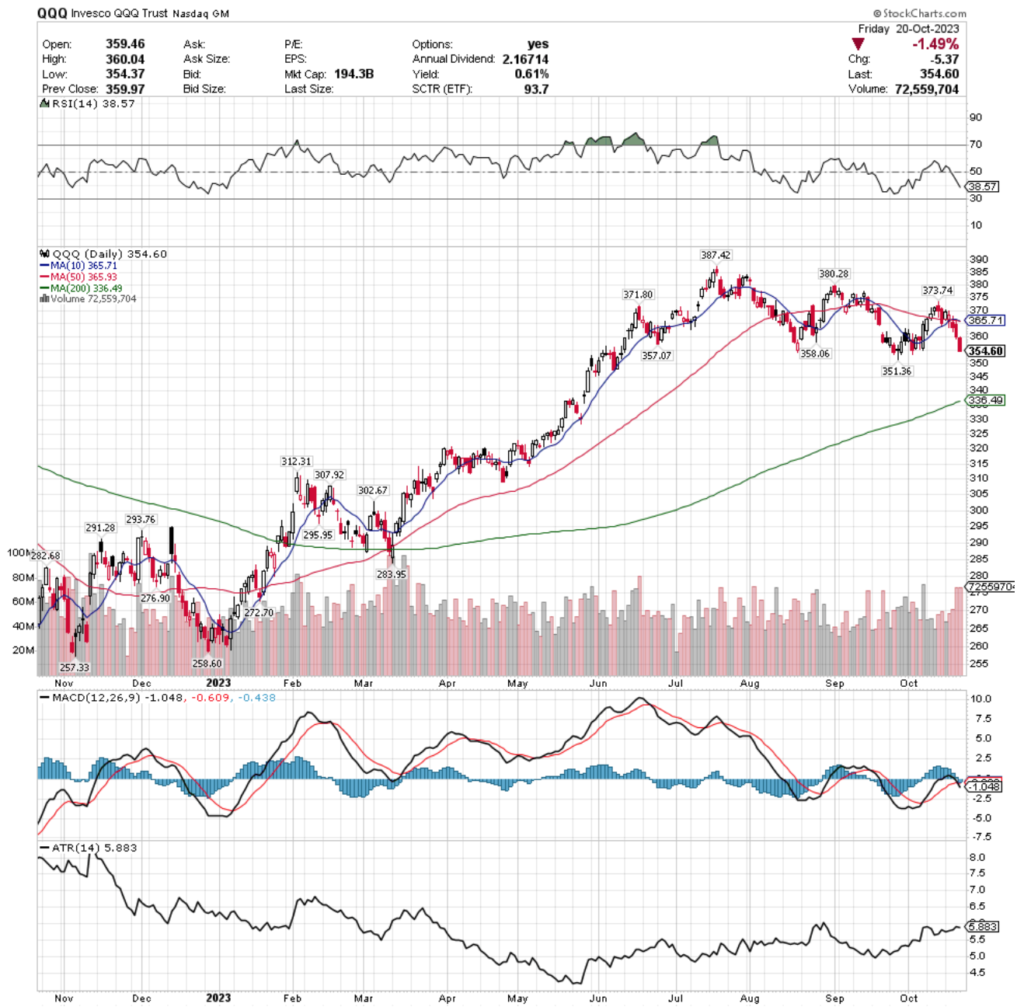
QQQ ETF – Invesco QQQ Trust ETF’s Technical Performance Over The Past Year
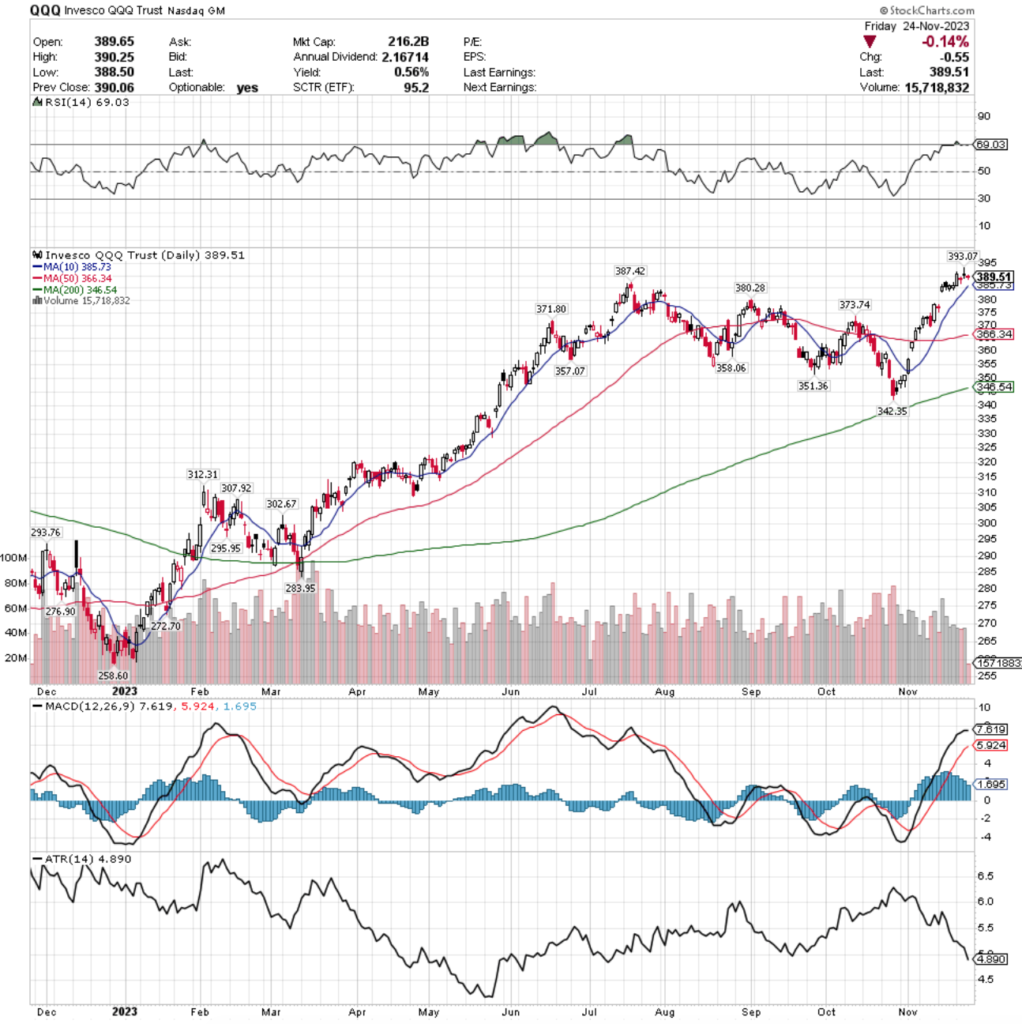
Their RSI is currently just underneath the overbought level & sits at 67.66, while their MACD is primed to cross over bearishly & looks set to continue downwards into more bearish territory into the coming week.
Volumes were -33.47% below average last week compared to the year prior (36,239,367 vs. 52,884,565), which is a cause for concern given that Thursday’s declining session was the highest volume day of the week.
Friday’s advancing volume was the second highest day of the week in terms of volume, however it was narrowly higher than the declining volume of Wednesday’s session & neither broke above any of last week’s sessions’ volumes.
This signals that there is a skeptical outlook on the NASDAQ currently, which matches the narrative of the MACD, painting a picture of brief consolidation on the horizon at best in the near-term.
There also looks to be a potential bearish head & shoulders formation forming, showing five & a half months of build up, which will be something to keep an eye on heading into Q2-3 2024.
Their Average True Range is also flat, like SPY’s, signaling that there will likely be some movement to establish a new, stronger trend that begins this week, with QQQ’s looking strongly to the downside.
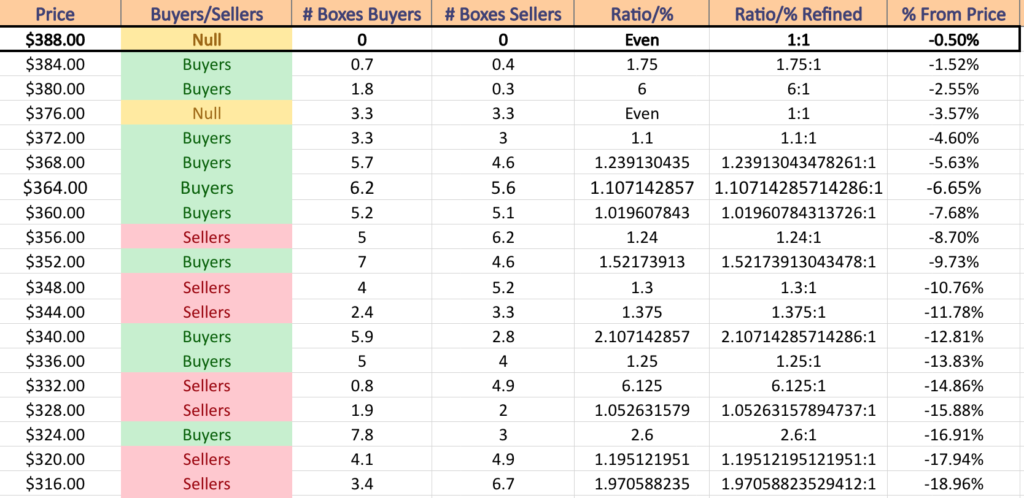
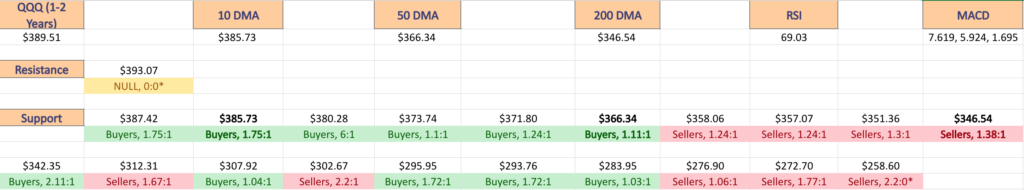
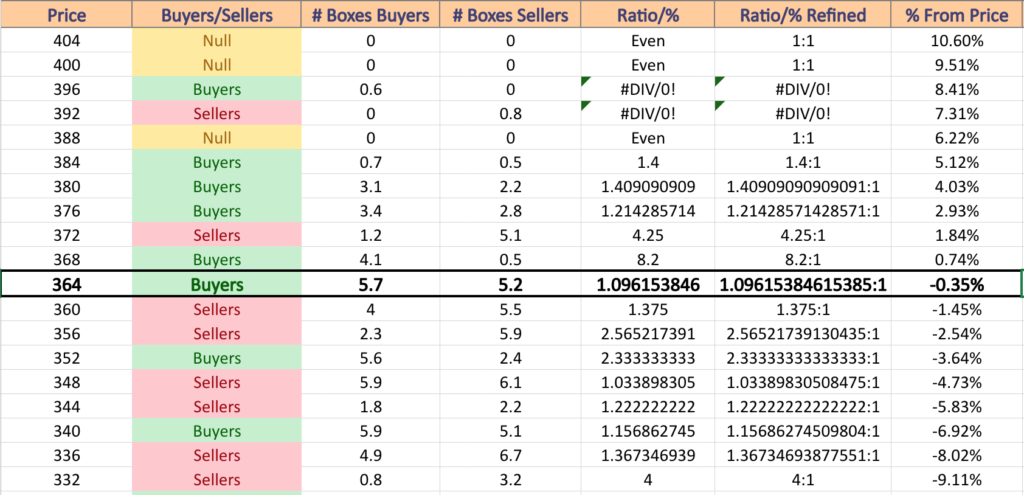
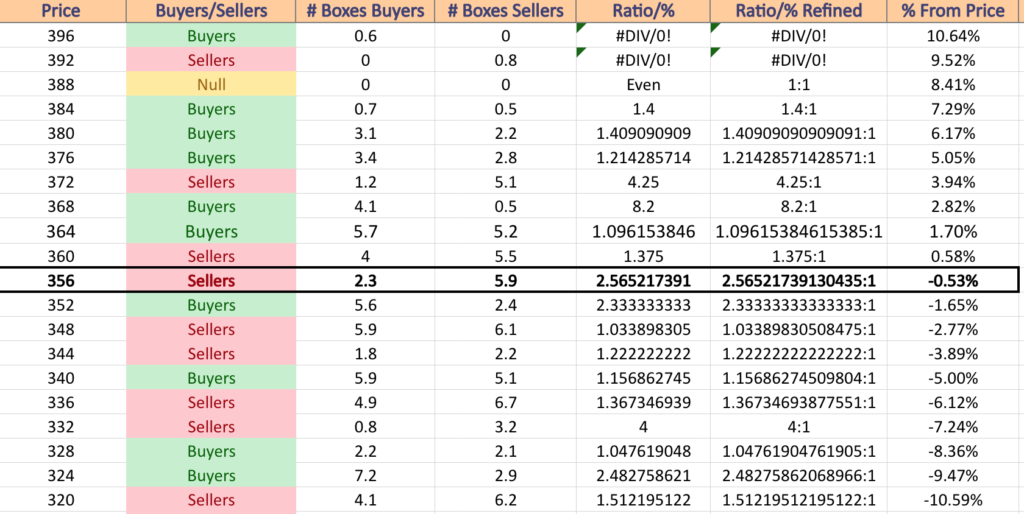
There is strong Buyers sentiment currently supporting QQQ, however, it should be noted that sentiment readings are always stronger at the extremes such as a 52-week high or low, as there has been limited price action at said levels.
There is currently -7.68% of cushion for QQQ’s share price before it reaches a seller dominated price level, with exception to the $376-379.99/share price box, which is currently 1:1 Buyers:Sellers.
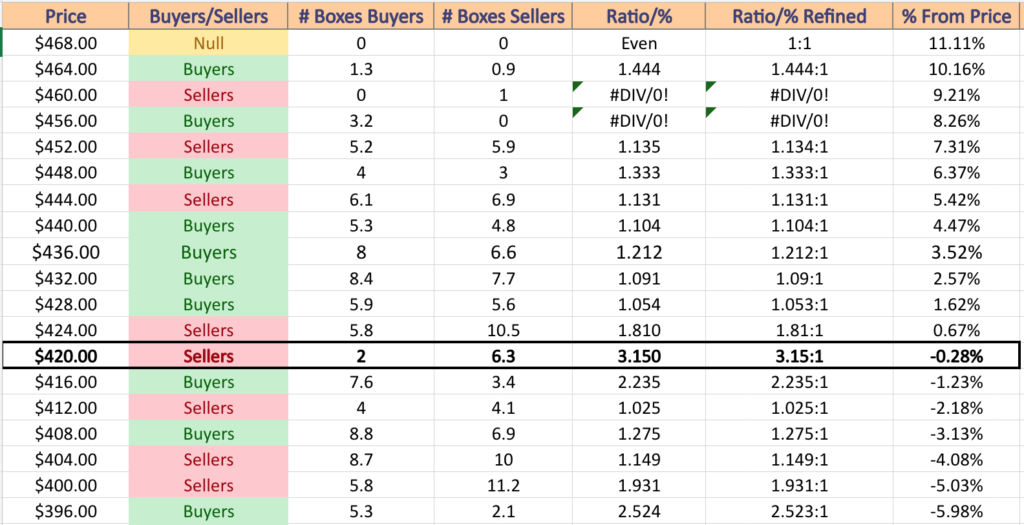
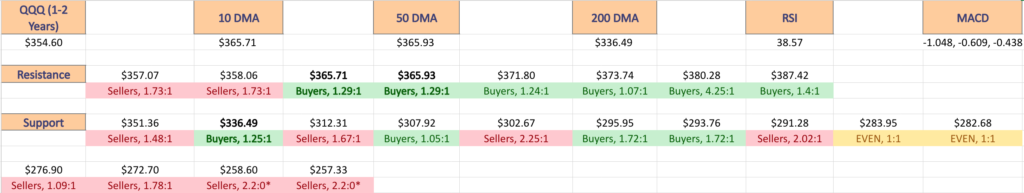
QQQ has support at the $389.28 (10 Day Moving Average; Volume Sentiment: NULL, 0:0*), $387.42 (Volume Sentiment: Buyers, 1.75:1), $380.28 (Volume Sentiment: Buyers, 6:1) & $373.74/share (Volume Sentiment: Buyers, 1.1:1) price levels, with resistance only at the $394.14/share (Volume Sentiment: NULL, 0:0*) price level, as they are currently declining from their new 52-week high set last Thursday.
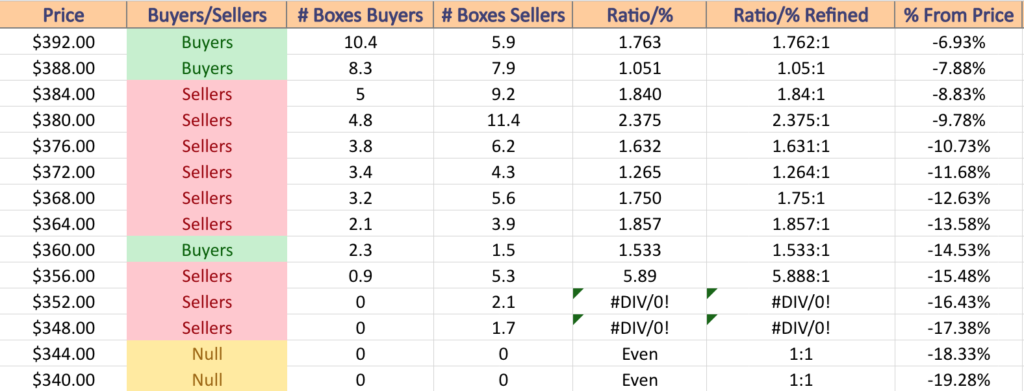
QQQ ETF’s Price Level:Volume Sentiment Over The Past 1-2 Years
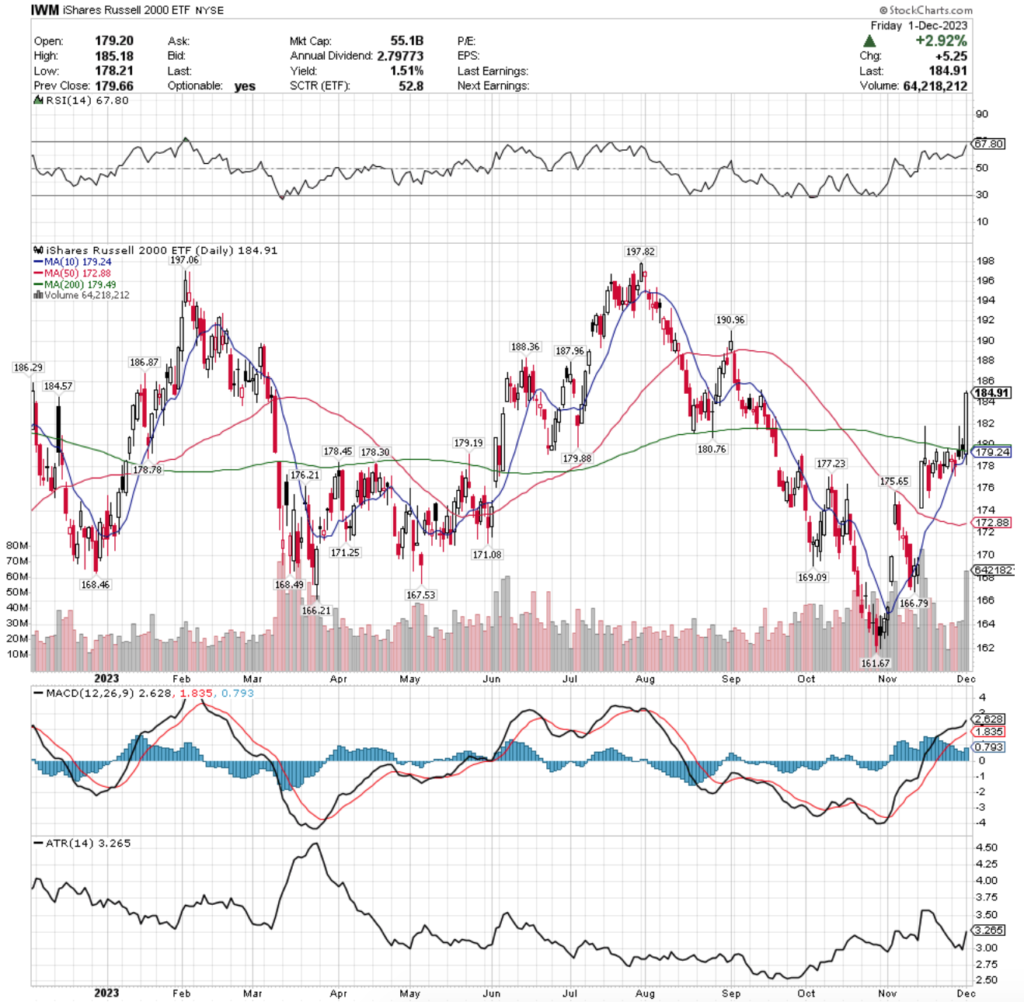
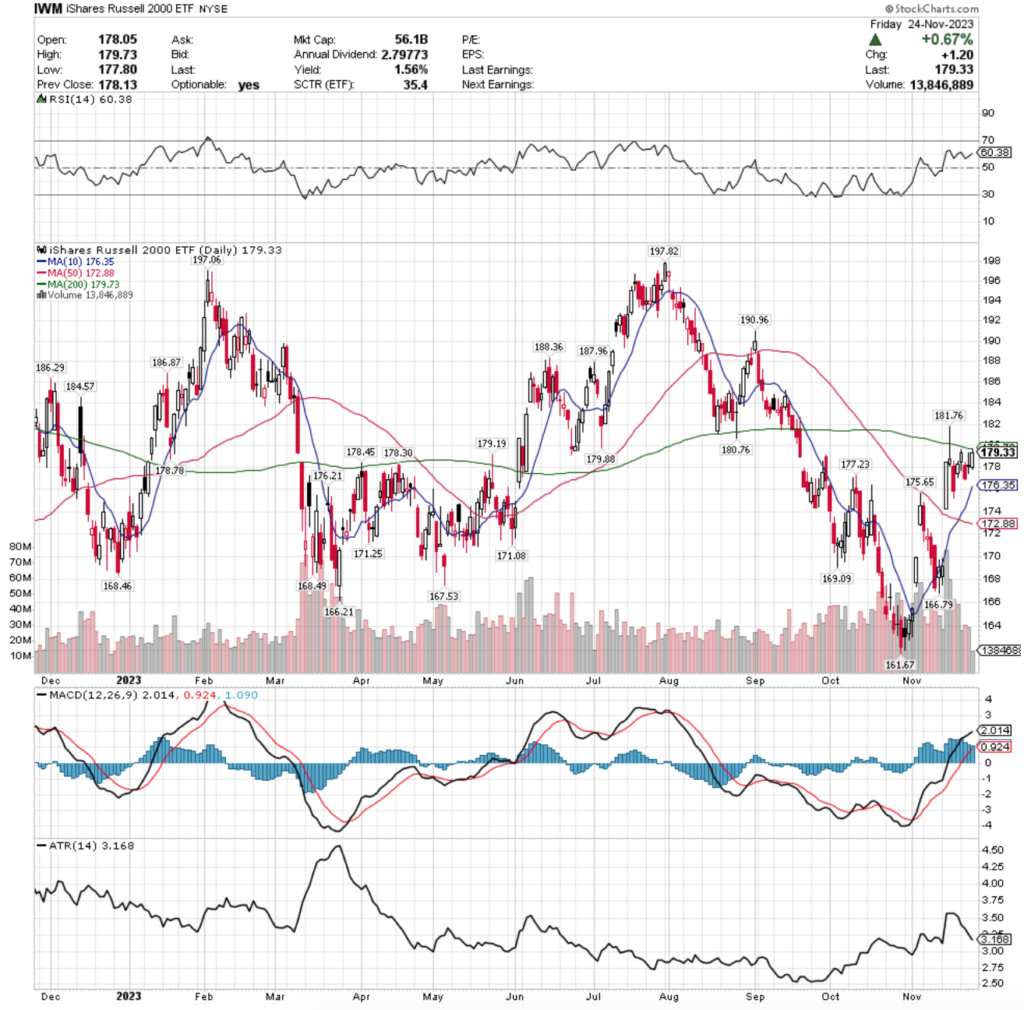
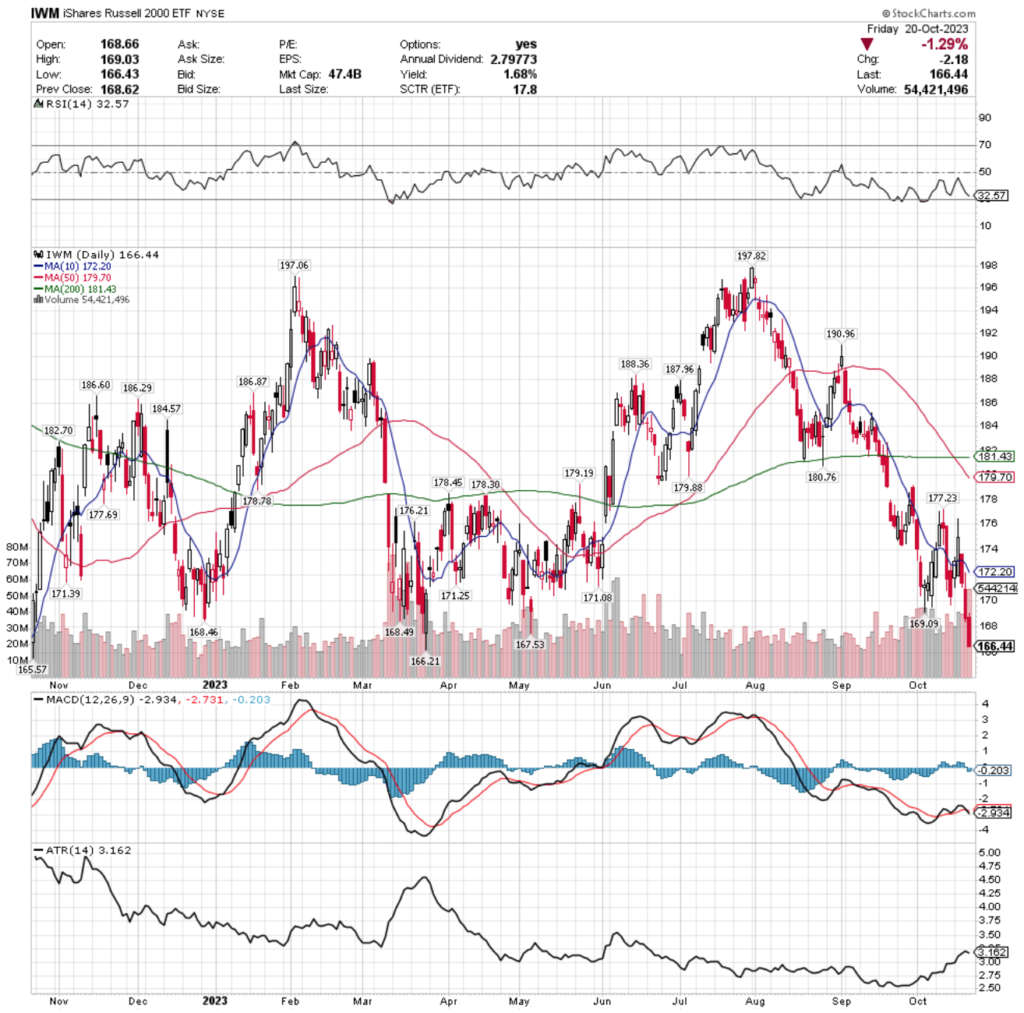
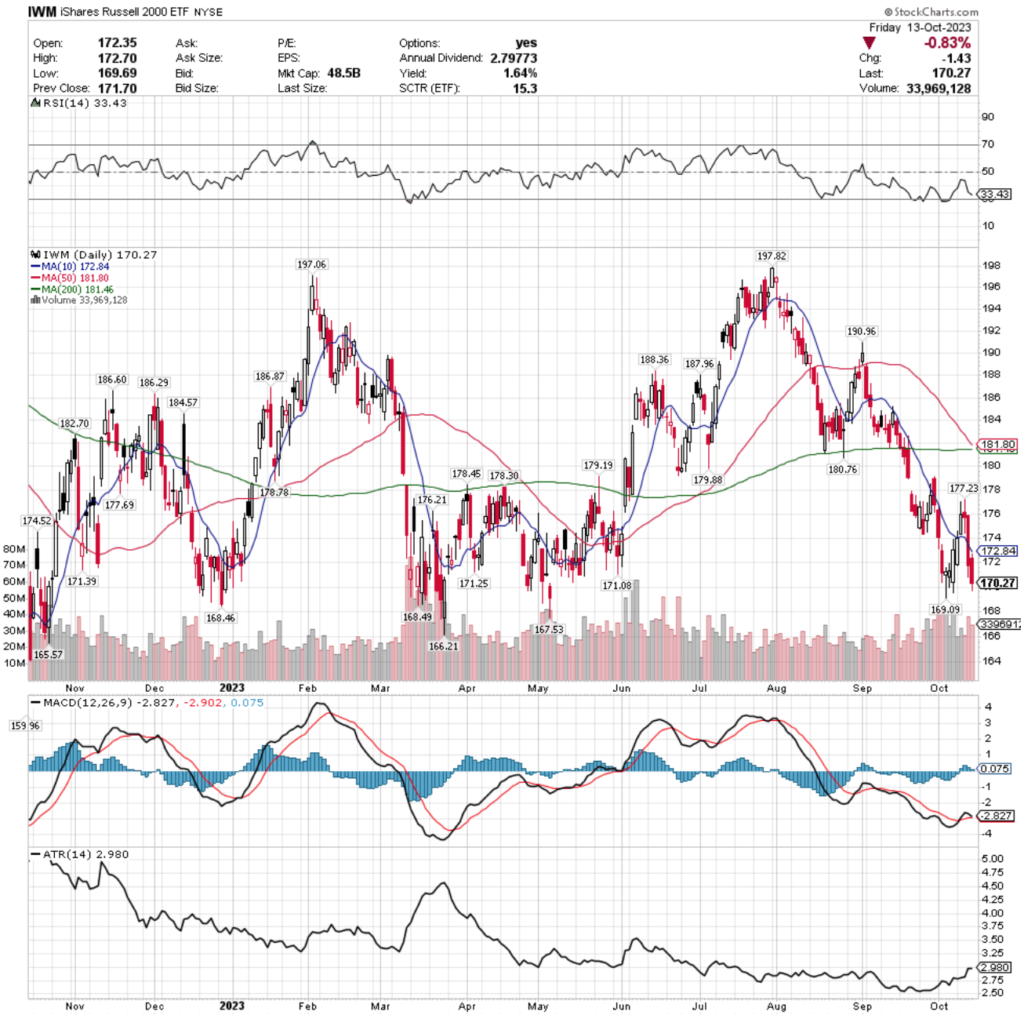
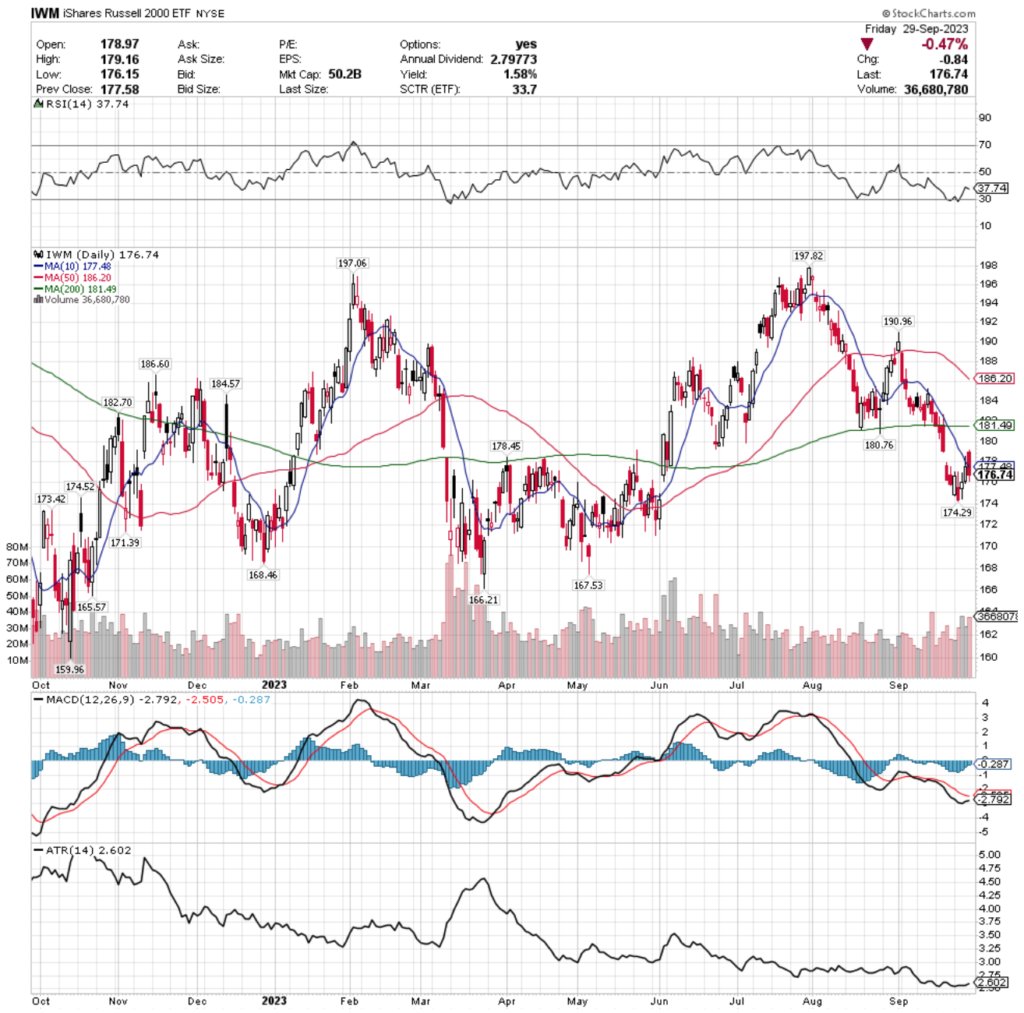
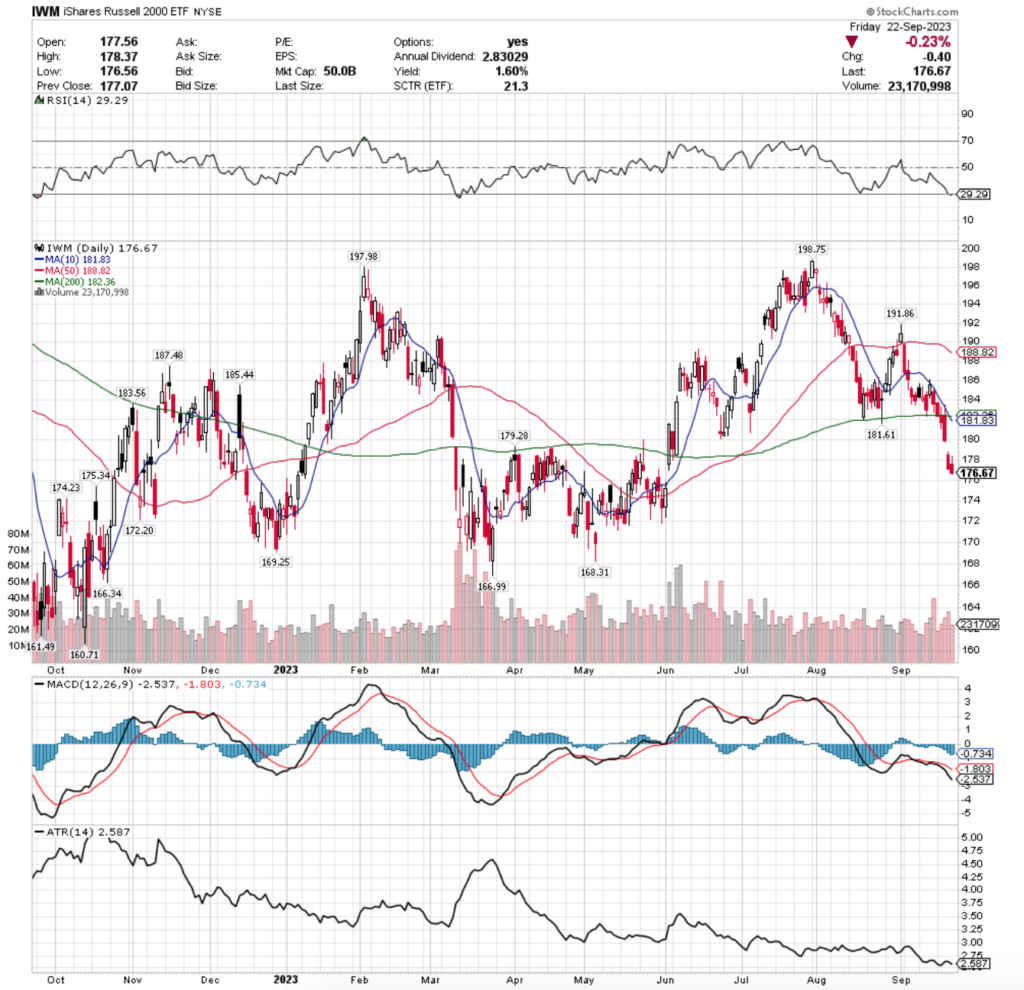
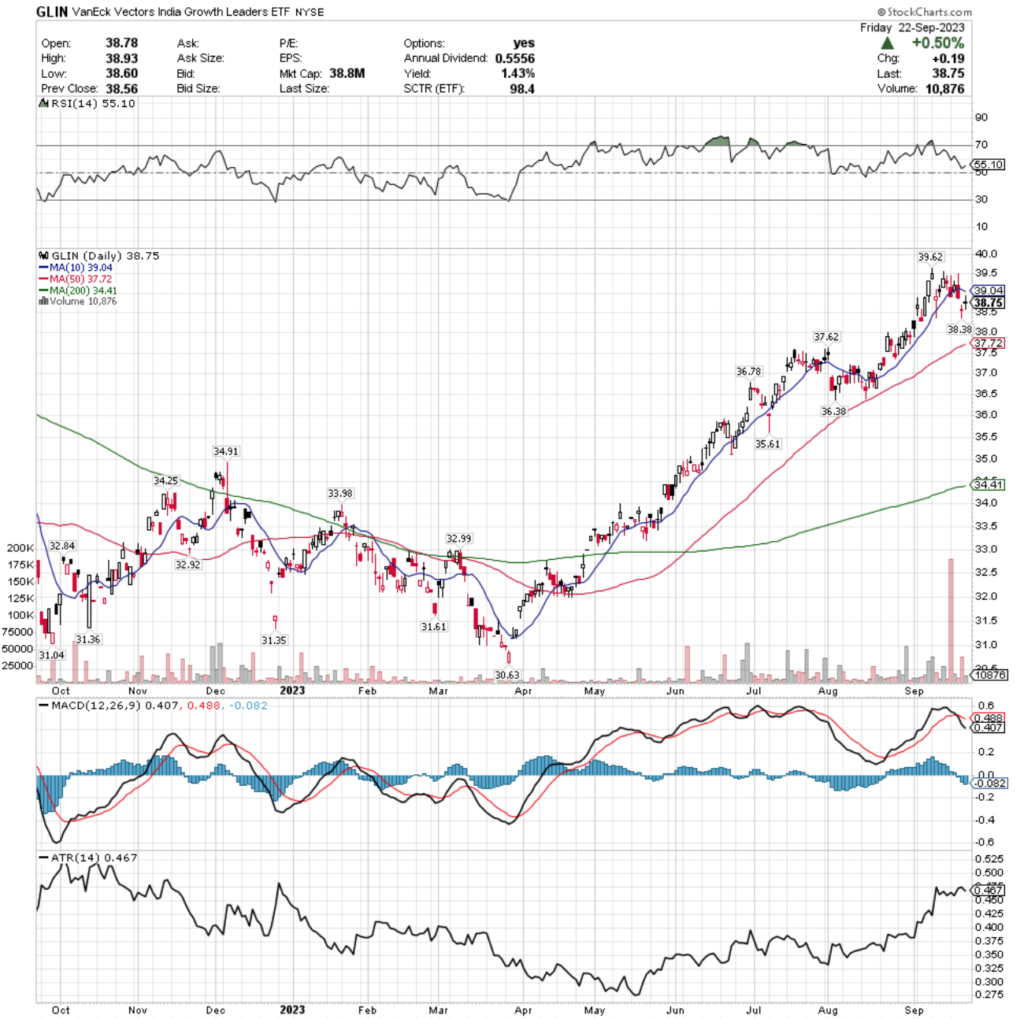
IWM, the iShares Russell 2000 ETF had the strongest week of the major indexes, advancing +3.11%, with Friday’s candle nearly jumping out of its shoes in terms of daily price range & closing well above the golden cross that was being created by the 10 & 200 day moving averages that day.
IWM ETF – iShares Russell 2000 ETF’s Technical Performance Over The Past Year
Their RSI is trending aggressively towards overbought after Friday’s wide range session & currently sits at 67.8, while their MACD is continuing higher due to Friday’s session after looking like it was set to lose steam & roll over bearishly last week.
Volumes were +11.49% above average compared to the year prior last week (33,473,717 vs. 30,023,244), but it should be noted that this is mostly on account of Friday’s session, whose volume eclipsed the volumes of the rest of the week & all but 4 sessions’ volumes throughout the year prior.
This does not necessarily indicate that there is strength in the move, and could likely have been market participants pivoting into small caps now before”the January effect” lifts small caps higher in the first half of next month.
Looking at how even the volumes of the early week declining days & then Wednesday & Thursday’s volumes also does not tell a story of strength & should be met with skepticism.
Monday’s session kicked the week off on an uncertain note for small cap names, with a slightly bearish day resulting in a spinning top candle.
Tuesday followed suit, although there was a much wider range on the candle’s real body, but the 10 day moving average was able to hold support & keep the declines from going too low.
Wednesday saw the power of the 200 day moving average’s resistance, as prices briefly fluctuated above it & tested higher for a bit, but the candle’s real body opened & closed below the 200 DMA.
It is also worth noting that they closed lower than they opened, despite finishing the day bullishly, which should be taken as a bearish situation.
Thursday’s candle was also a filled in black candle & a spinning top, that despite opening & closing above the support of the 200 DMA did not signal much confidence was in the air.
Friday was a very wide range day that exposed a few interesting bits of information from the market.
The day opened somewhere between the 10 DMA’s support & 200 DMA’s resistance & ultimately closed +2.92% higher for the day, however, the lower shadow of the day’s candle should be noted, as there was a bit of test to the downside that shouldn’t be ignored.
Their ATR is signaling that there is a stronger trend in play now after November did feature a steady advance, however the volatility of Friday’s session that has been added into the calculation does distort the otherwise slow advances of the month prior to appear like a stronger trend is in play than really is.
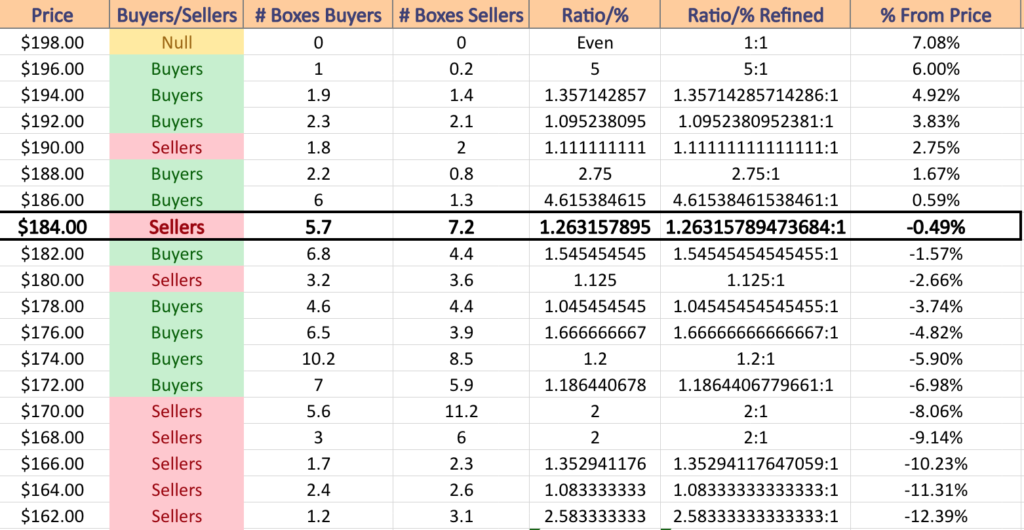
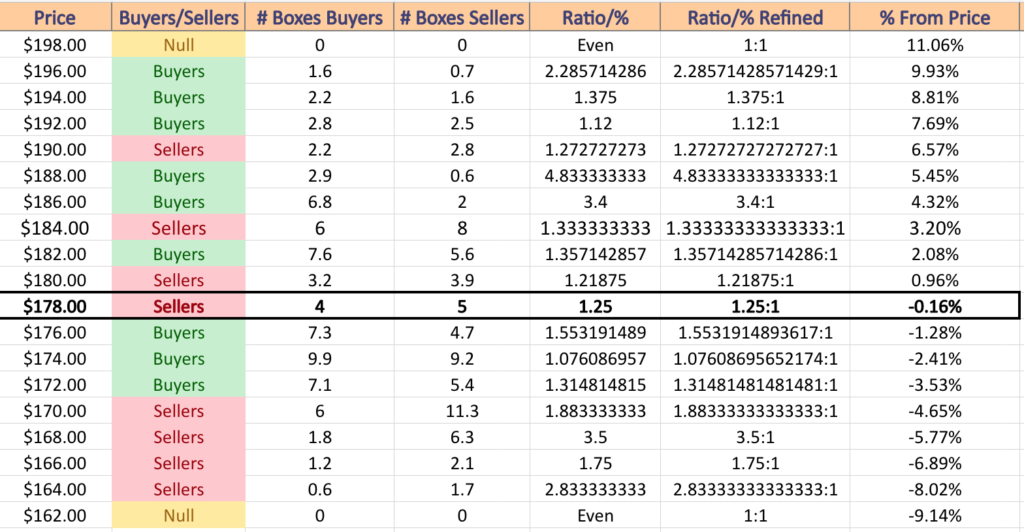
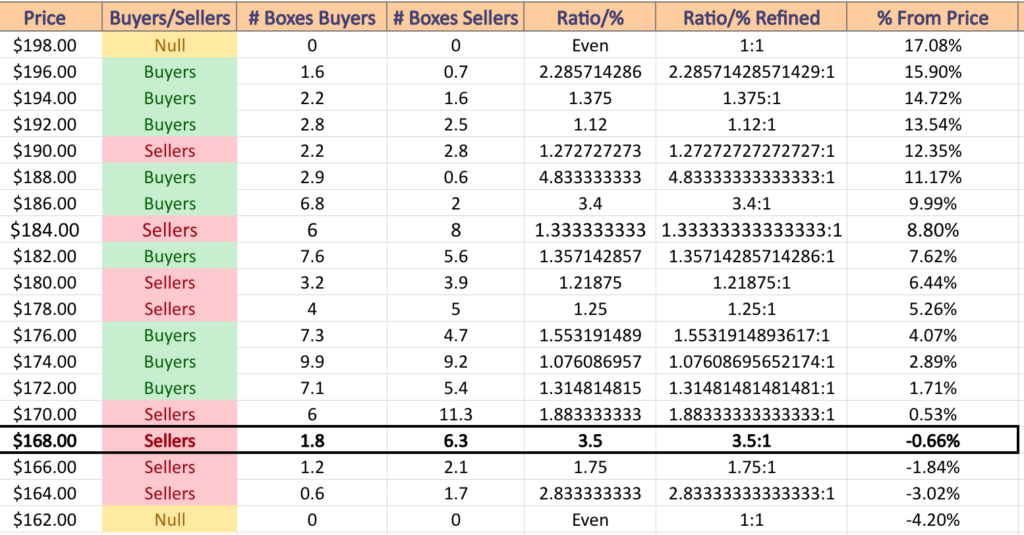
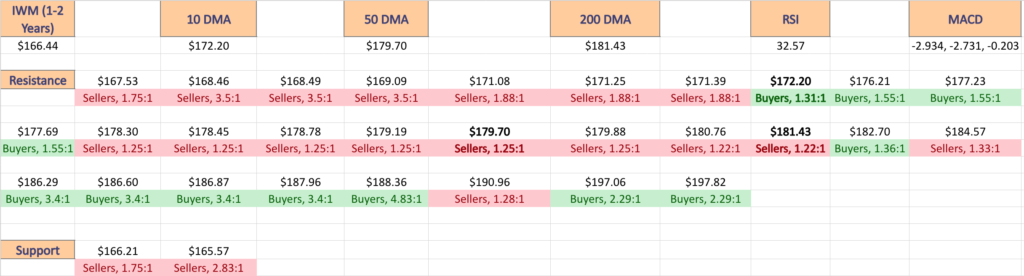
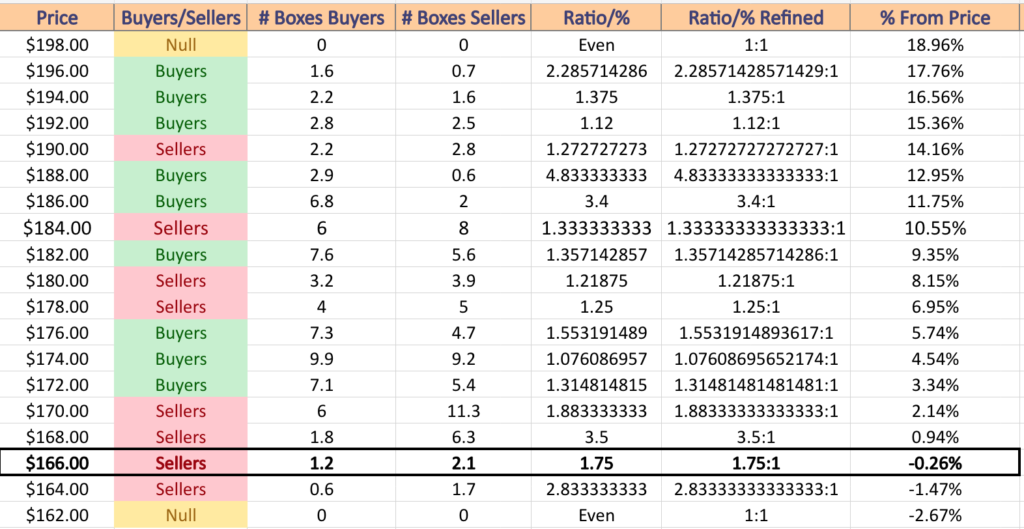
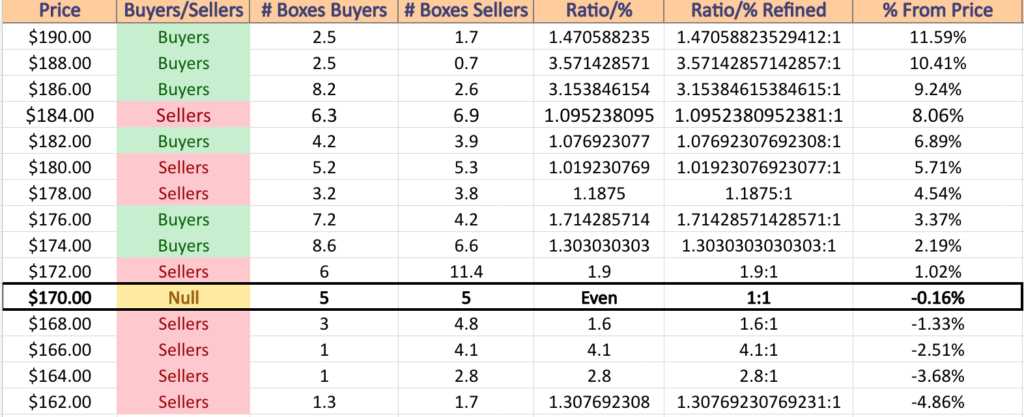
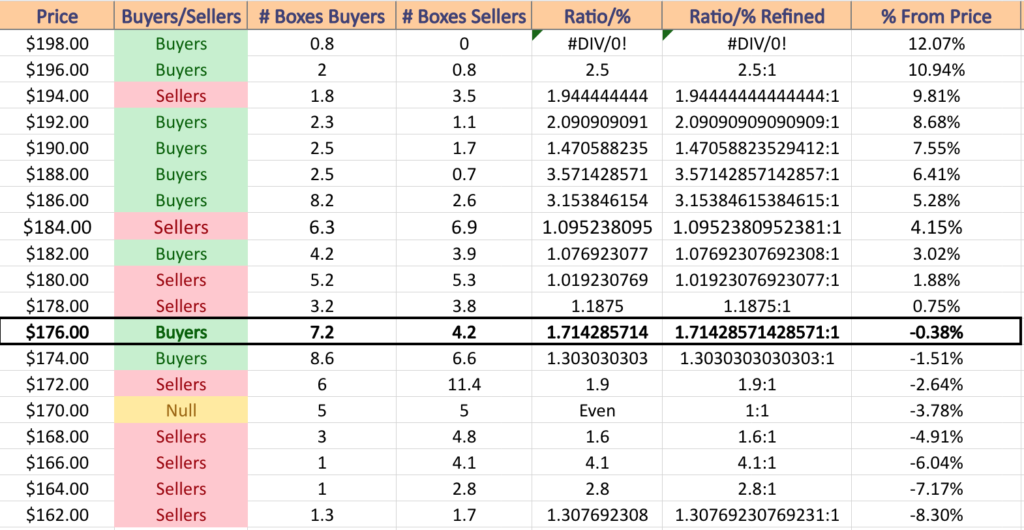
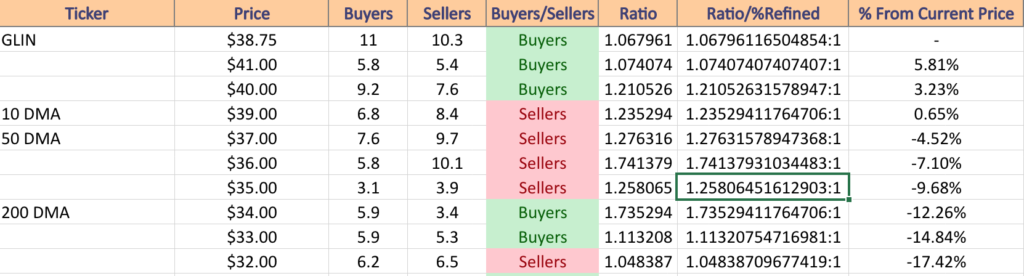
Prices are still in a seller dominated price level 1.26:1 & while there are buyers historically at a rate of 1.55:1 in the $182-183.99/share zone, the sellers resume control again until a ~3% drop in price.
The next 4 price zones are buyers dominated, before sellers lead the way back down to the 52-week low, which was hit in October.
It is worth noting that just as mentioned regarding stocks at/near their 52-week high, the volume readings are more extreme to one side or another when we reach price extremes, due to the lack of time spent in these price ranges.
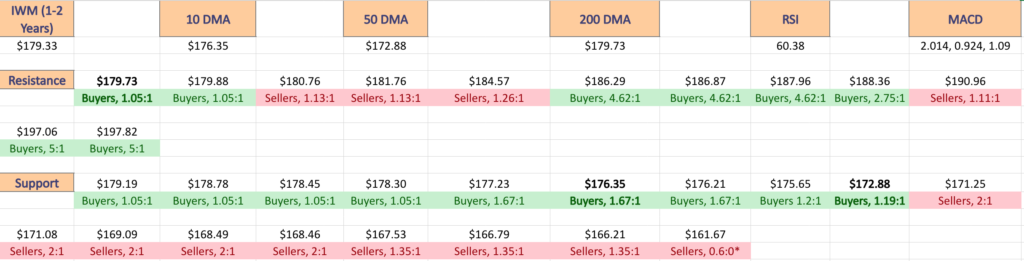
IWM has support at the $184.57 (Volume Sentiment: Sellers, 1.26:1), $180.76 (Volume Sentiment: Sellers, 1.13:1), $179.88 (Volume Sentiment: Buyers, 1.05:1) & $179.49/share (200 Day Moving Average; Volume Sentiment: Buyers, 1.05:1) price levels, with resistance at the $186.29 (Volume Sentiment: Buyers, 4.62:1), $186.87 (Volume Sentiment: Buyers, 4.62:1), $187.96 (Volume Sentiment: Buyers, 4.62:1) & $188.38/share (Volume Sentiment: Buyers, 2.75:1) price levels.
IWM ETF’s Price Level:Volume Sentiment For The Past 1-2 Years
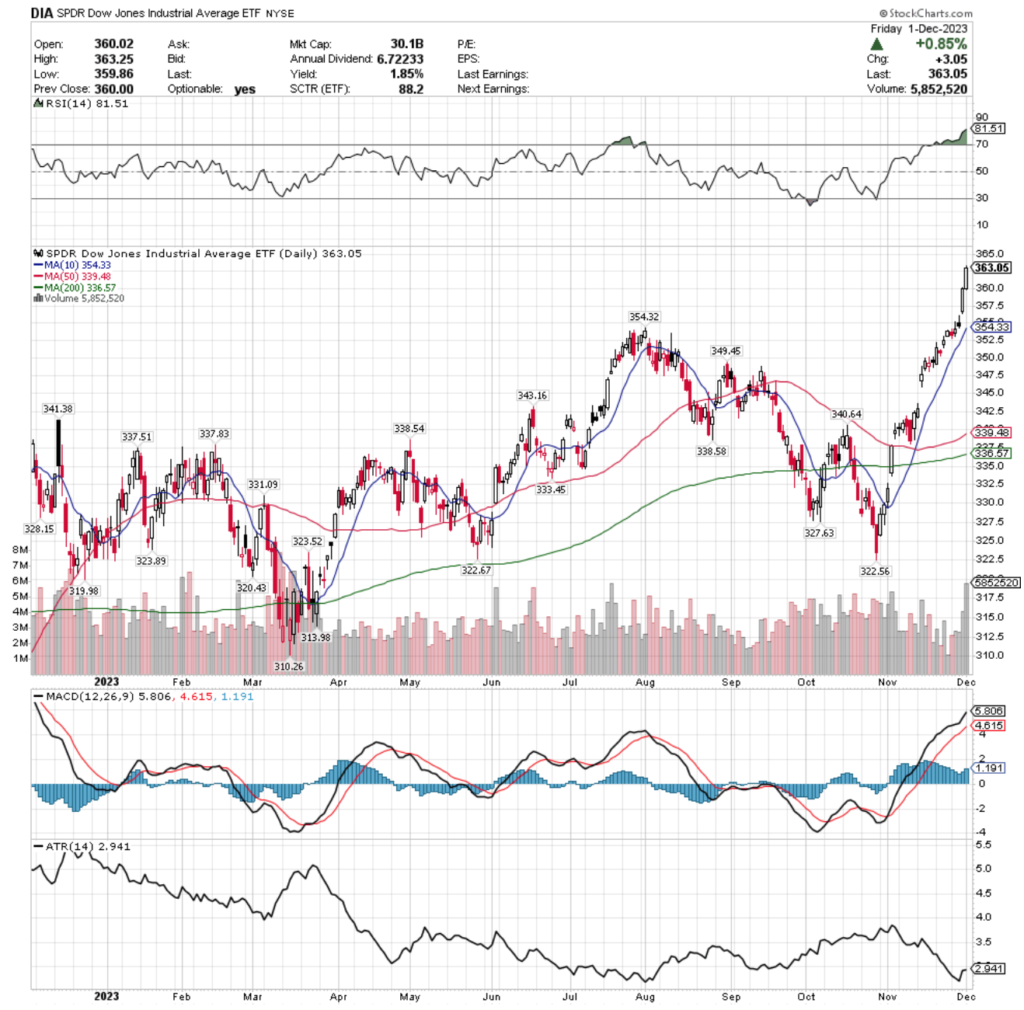
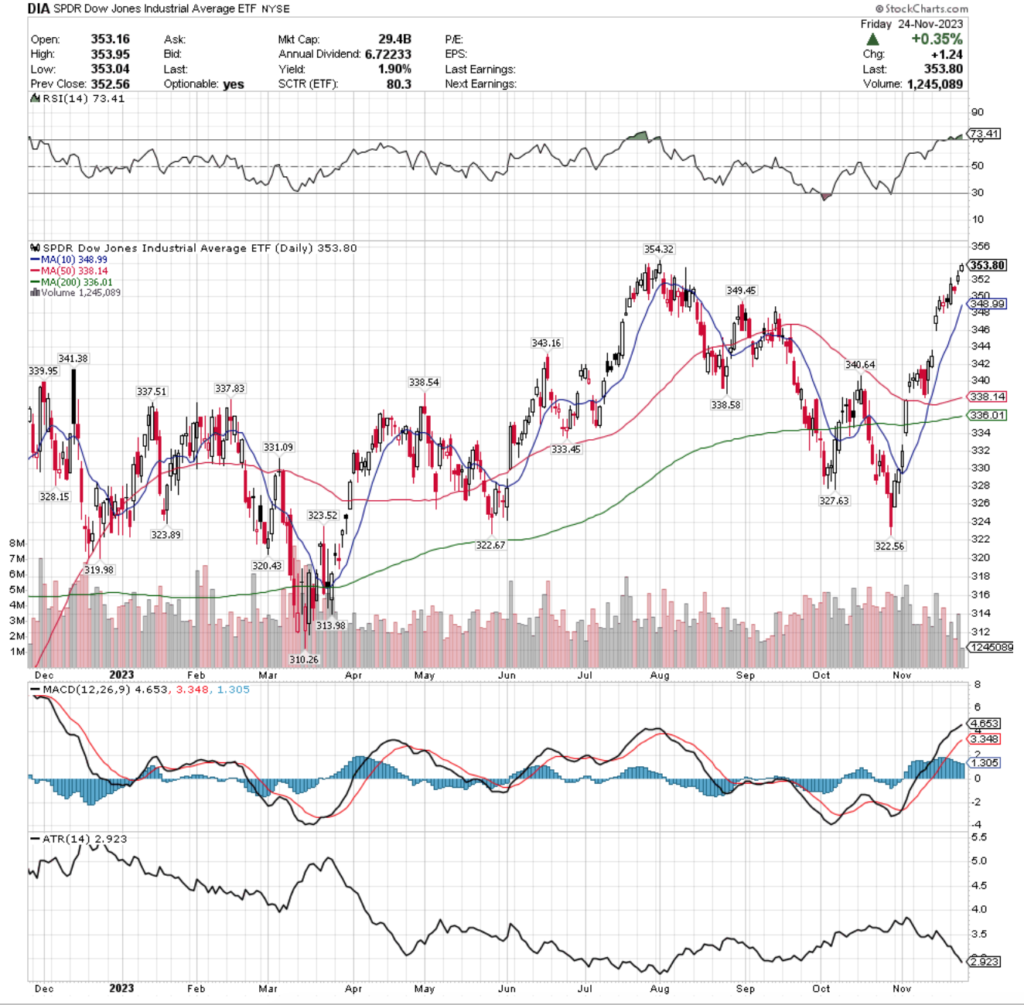
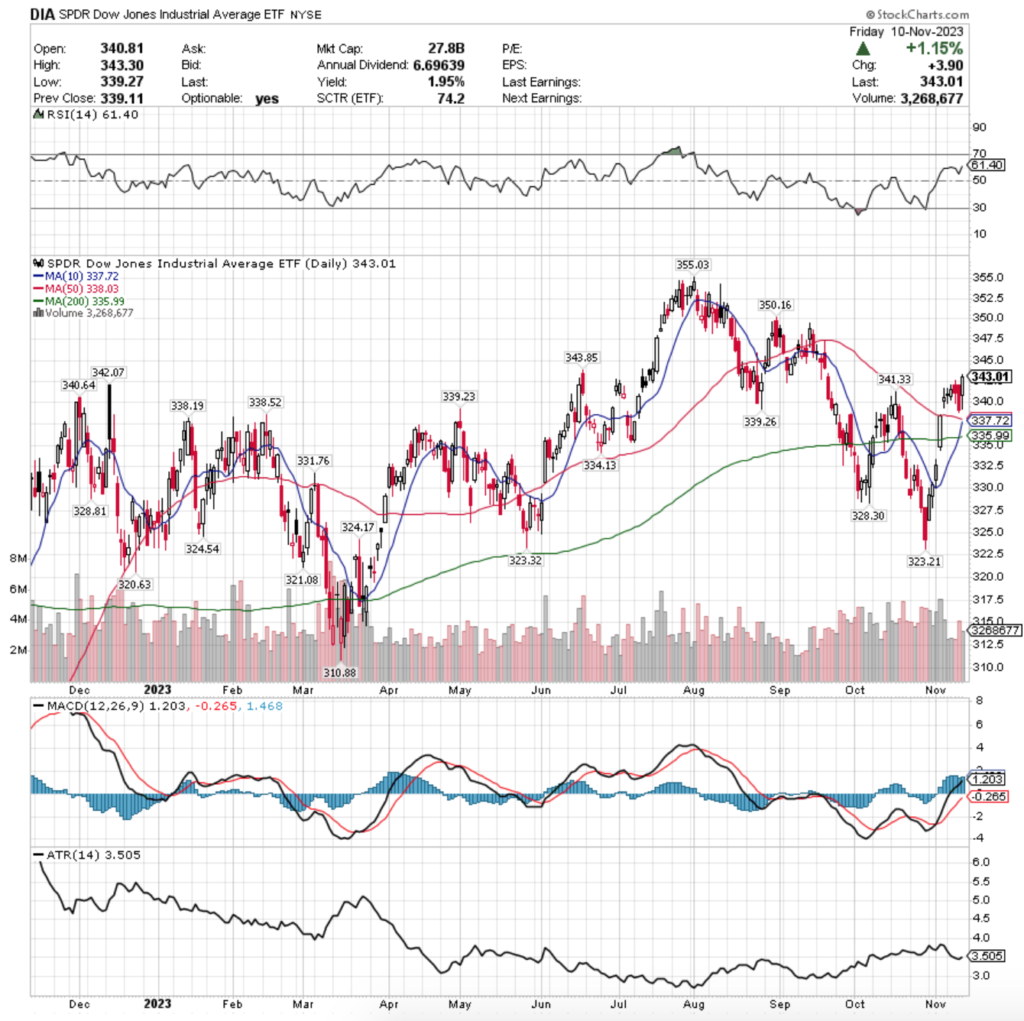
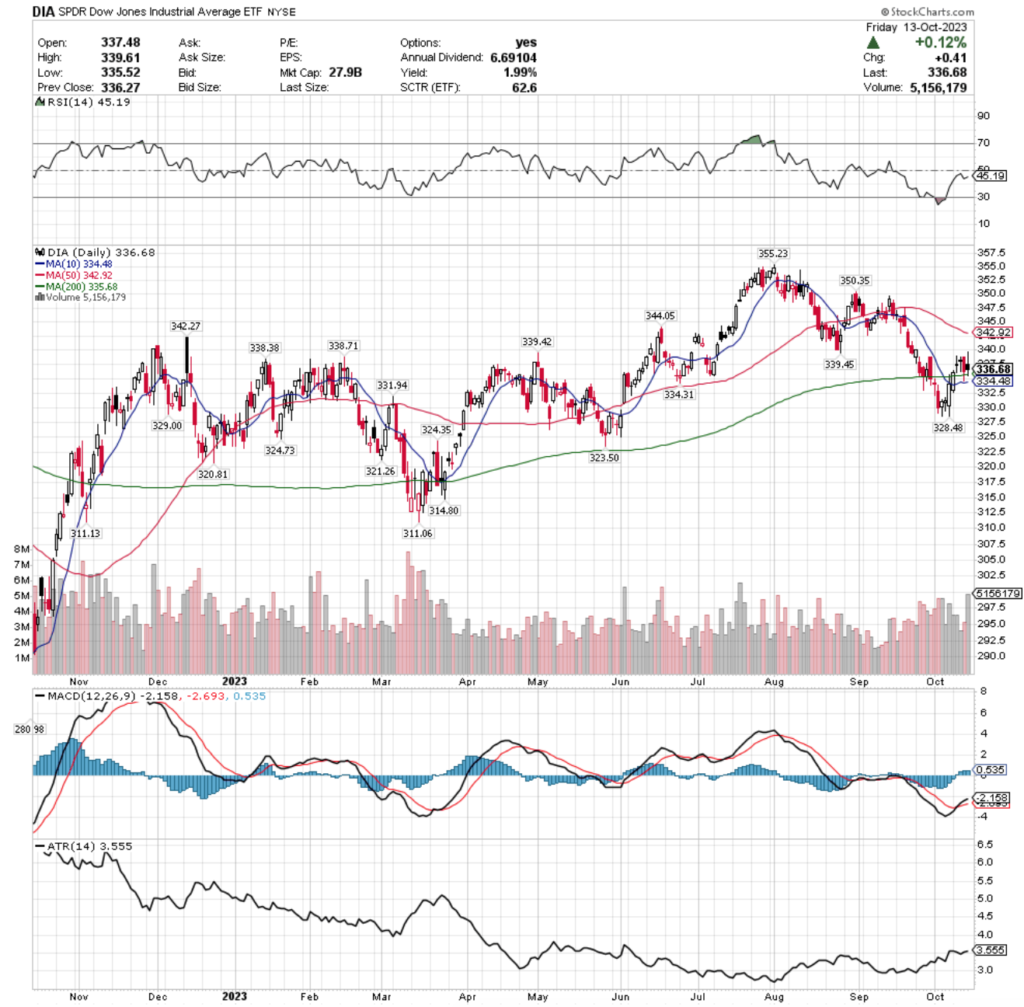
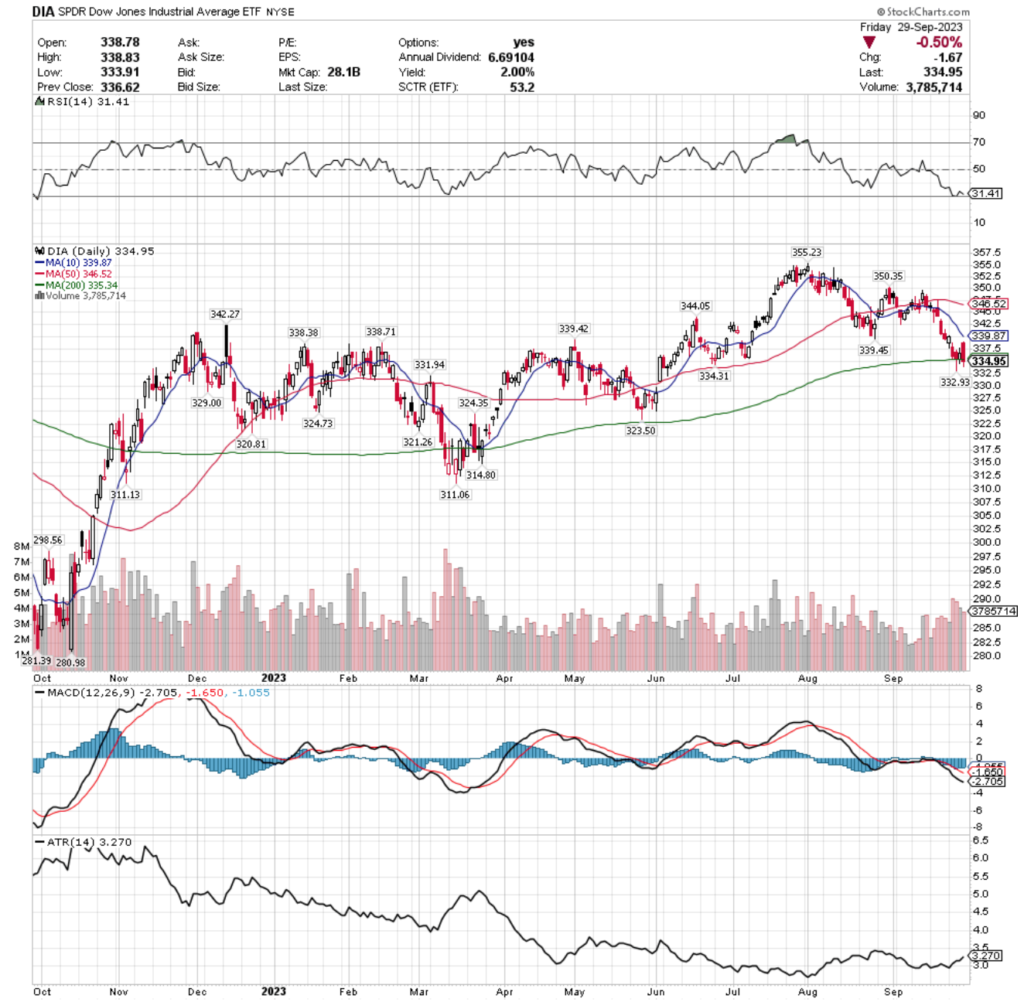
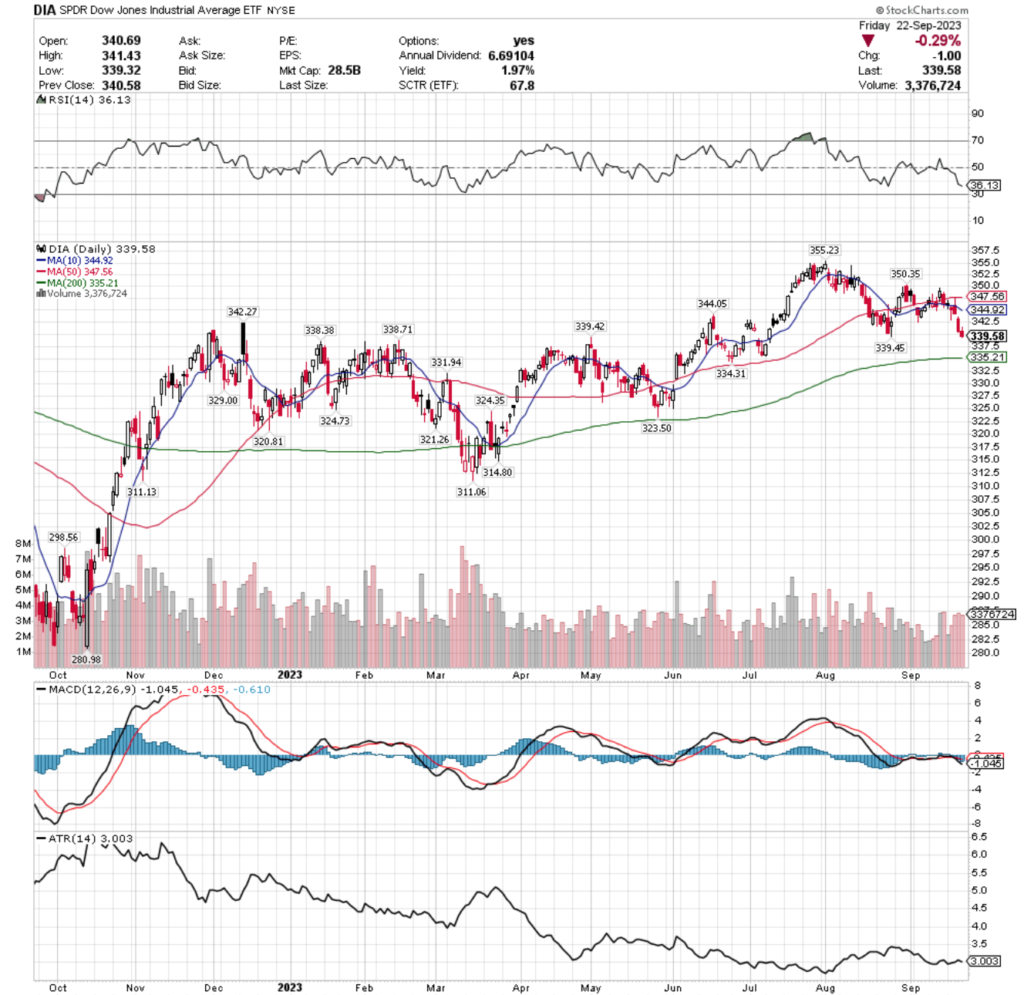
DIA, the SPDR Dow Jones Industrial Average ETF ended the week second best of the major indexes, +2.61%, trailing on the Russell 2000, but still managing to close the week on a new 52-week high.
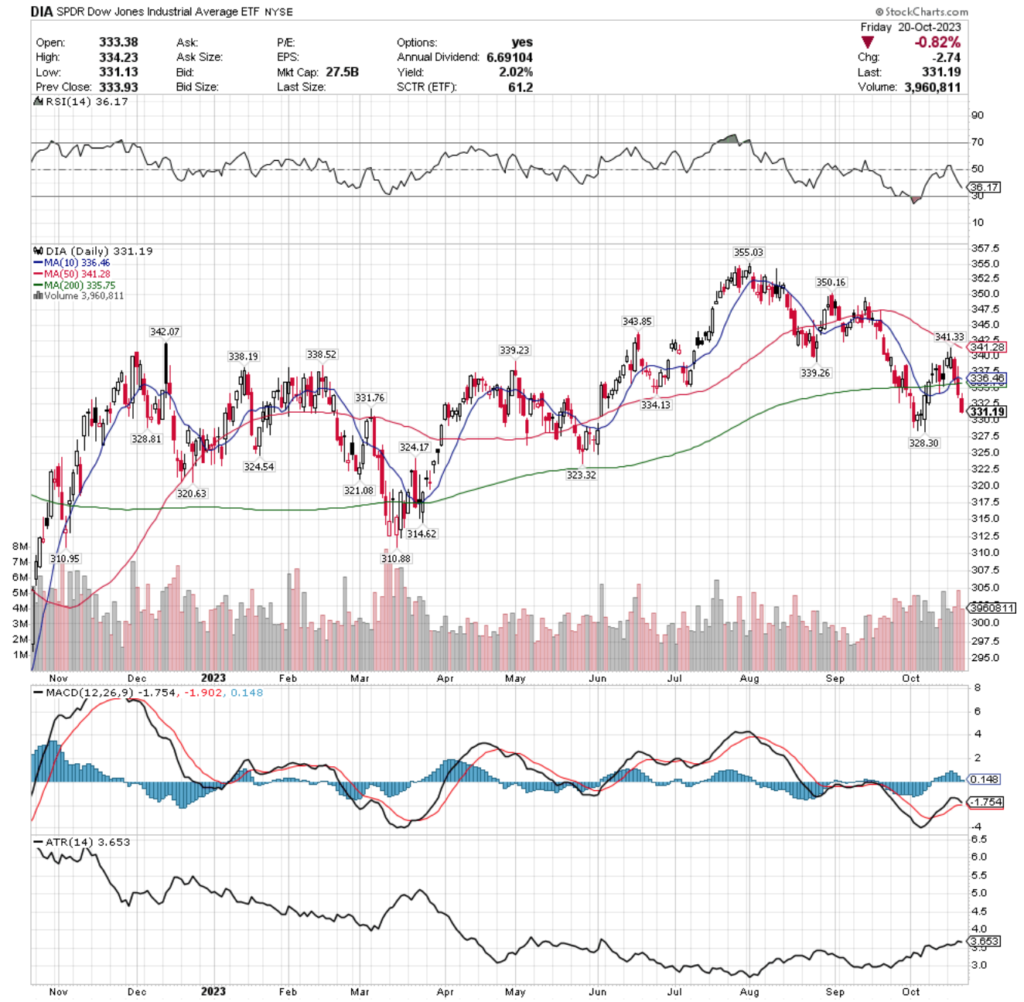
DIA ETF – SPDR Dow Jones Industrial Average ETF’s Technical Performance Over The Past Year
Their RSI is heavily overbought at 81.51, with a MACD that is still bullish, but looks to be beginning to lose steam & become ready to roll over for a bearish crossover in the coming sessions.
Volumes were -8.7% below average last week compared to the year prior (3,203,100 vs. 3,508,327), signaling a lack of enthusiasm & calling question to the strength of the gains that were achieved on Thursday & Friday.
Monday the week started off on unstable footing, resulting in a declining session with a spinning top candle, marking uncertainty among market participants.
Tuesday was another spinning top session, that despite nudging up to close bullishly, did not paint a picture of good things to come as the candle’s real body was concentrated on the lower end of the candle.
Wednesday the uncertainty continued, with prices closing lower than they opened, despite the day being bullish, which continued the story of caution, especially given how low the volumes were during the first three sessions of the week.
This lead up to the largely bullish days at the end of the week should’ve raised eyebrows of skepticism, particularly the gap up on Thursday that occurred on relatively average volumes.
Friday’s move higher should also be viewed with a critical eye, as while it did set a new 52-week high on strong volume, it stretched out oscillators such as the RSI to their highest overbought reading of the year.
Volume was strong (top 10 days by volume of the year), but this should be viewed as a last chance piling in for profits, which will be interesting to see the strength of in the coming week.
Another thing to keep an eye on this week will be the strength of support provided by the 10 day moving average, which is currently the closest support level to their price.
Given that we are at a price extreme the volume sentiment levels are don’t paint much of a picture as to what the strength of this support level will be, as the current ratio for the $352-355.99/share box is 1:0*.
Their Average True Range was indicating a more steady trend in November after the steady ascent from the mid-month gap up, but the violent movement of the last two days has disrupted that & now their ATR is looking flat, much like SPY & QQQ’s, indicating that a reversal in trend, possibly violent, is on the horizon.
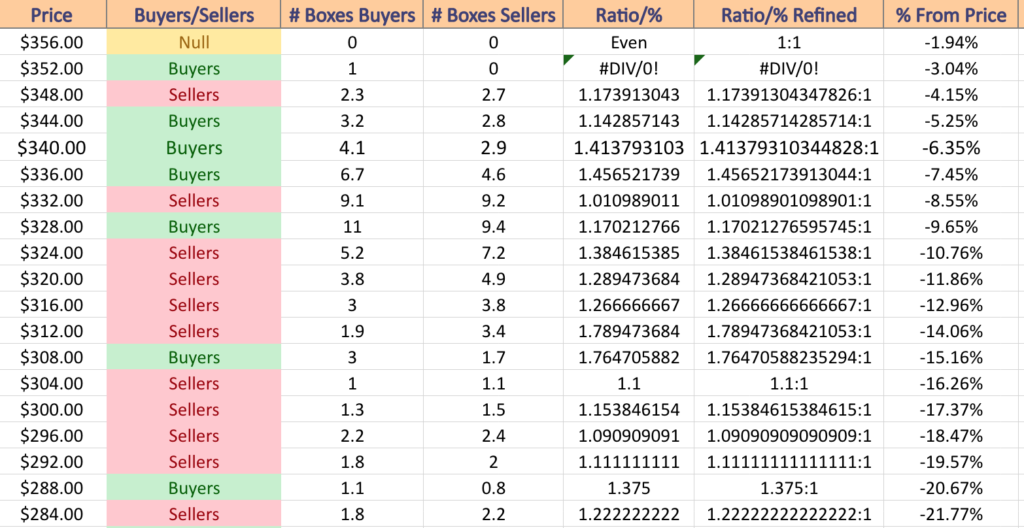
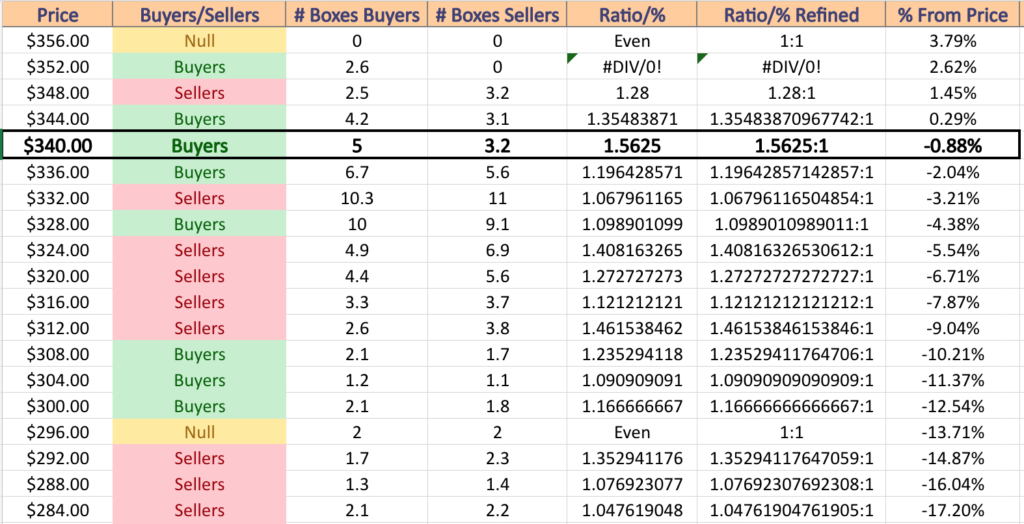
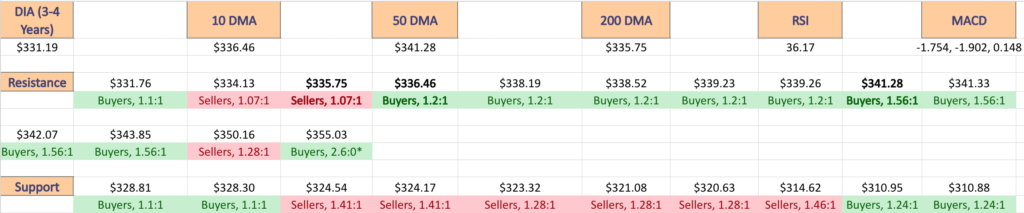
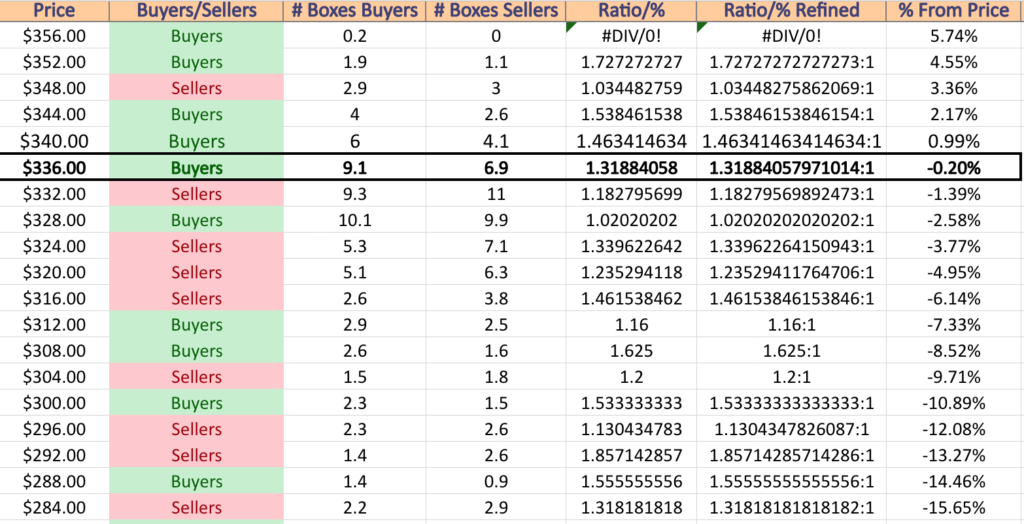
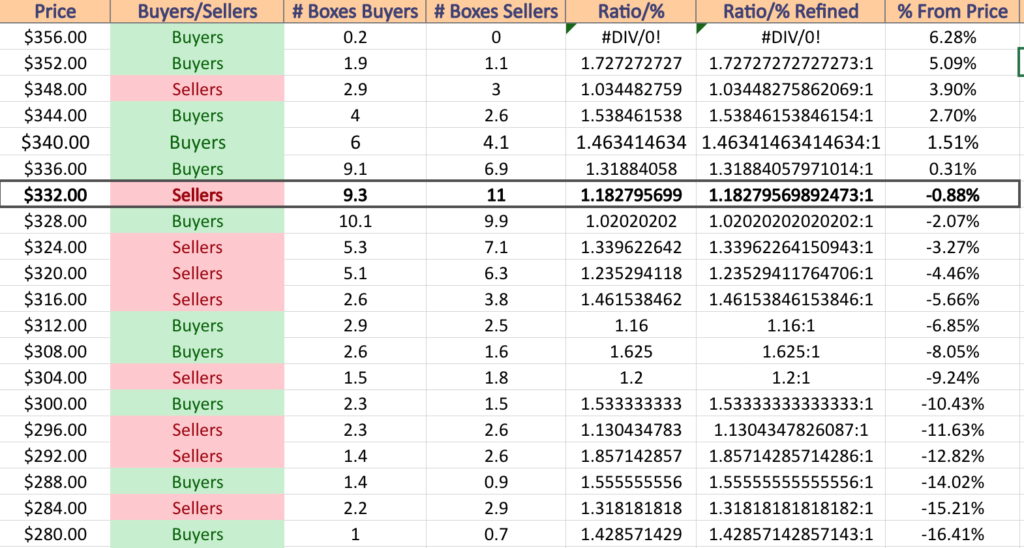
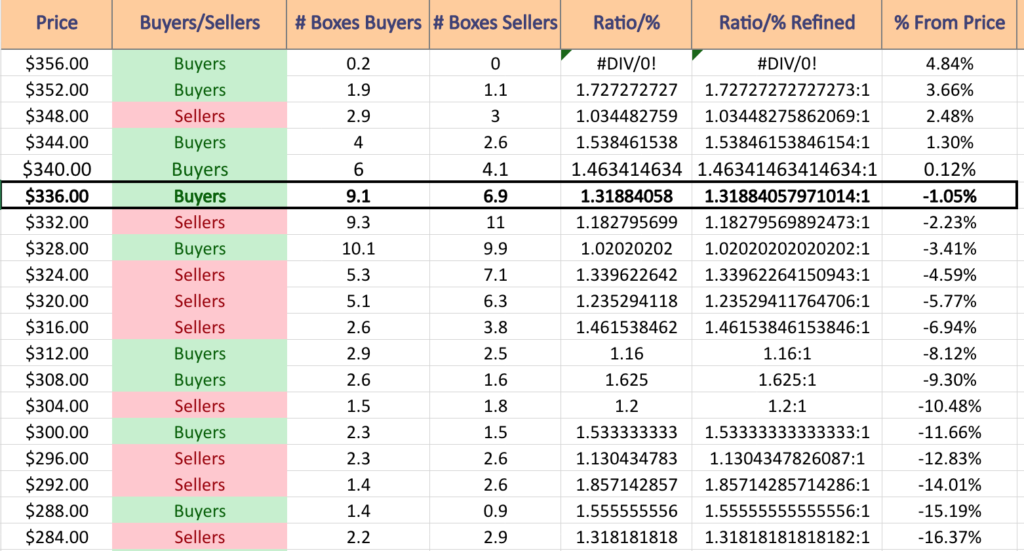
They have enjoyed strength for the last couple of months, but if there is a proper correction there will be cause for concern, as after a -9.65% decline the next -5%+ is all seller dominated, minus the $308-311.99/share zone which historically has 1.76:1 Buyers:Sellers & the $288-291.99/share price zone, which has 1.38:1 Buyers:Sellers.
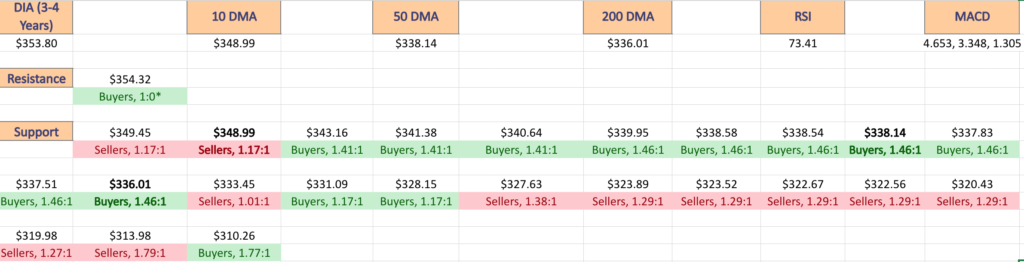
DIA has support at the $354.33 (10 Day Moving Average; Volume Sentiment: Buyers, 1:0*), $354.32 (Volume Sentiment: Buyers, 1:0*), $349.45 (Volume Sentiment: Sellers, 1.17:1) & $343.16/share (Volume Sentiment: Buyers, 1.42:1) price levels, with no resistance levels as Friday’s session marked a new 52-week high for DIA (Volume Sentiment: NULL, 0:0*).
DIA ETF’S Price Level:Volume Sentiment For The Past 3-4 Years
The Week Ahead
Monday’s earnings reports include GitLab & Science Applications.
Factory Orders data is reported on Monday at 10 am.
AutoZone, AeroVironment, America’s Car-Mart, Asana, Box, Core & Main, Dave & Buster’s, Ferguson, G-III Apparel, MongoDB, Phreesia, SentinelOne, Signet Jewelers, Stitch Fix, Toll Brothers & Yext are all scheduled to report earnings on Tuesday.
Tuesday features S&P U.S. Services PMI data at 9:45 am, as well as ISM Services data & Job Openings data at 10 am.
ADP Employment data comes in Wednesday at 8:15 am, followed by U.S. Productivity (revision) & U.S. Trade Deficit data at 8:30 am.
Thursday’s earnings calls include Broadcom, Lululemon Athletica, BRP, Ciena, Cooper, DocuSign, Dollar General, GMS, Smith & Wesson Brands & Vail Resorts.
Initial Jobless Claims reports are released Thursday at 8:30 am, with Wholesale Inventories data at 10 am & Consumer Credit data at 3pm.
Hello Group is scheduled to report earnings on Friday.
U.S. Employment Report, U.S. Unemployment Rate, U.S. Hourly Wages & U.S. Hourly Wages Y-o-Y data are released at 8:30 am & Consumer Sentiment (prelim) data comes out at 10 am Friday
Markets have reached an interesting point again recently, with the S&P 500 & Dow Jones Industrial Average flirting with a new 52-week high, the NASDAQ breaking their most recent 52-week high & the Russell 2000 recently recovered after setting a new 52-week low.
However, volumes & oscillators are not currently convincing of strength in the markets, making it important to take a step back & see how recent history may impact the near-future.
Read our breakdown of the markets’ recent technicals, as well as an updated price level:volume sentiment reading, which breaks down the volume levels of the past 1-4 years for each index on a price percentage basis.
Technical Analysis & Price Level:Volume Sentiment Analysis For The S&P 500 (SPY)
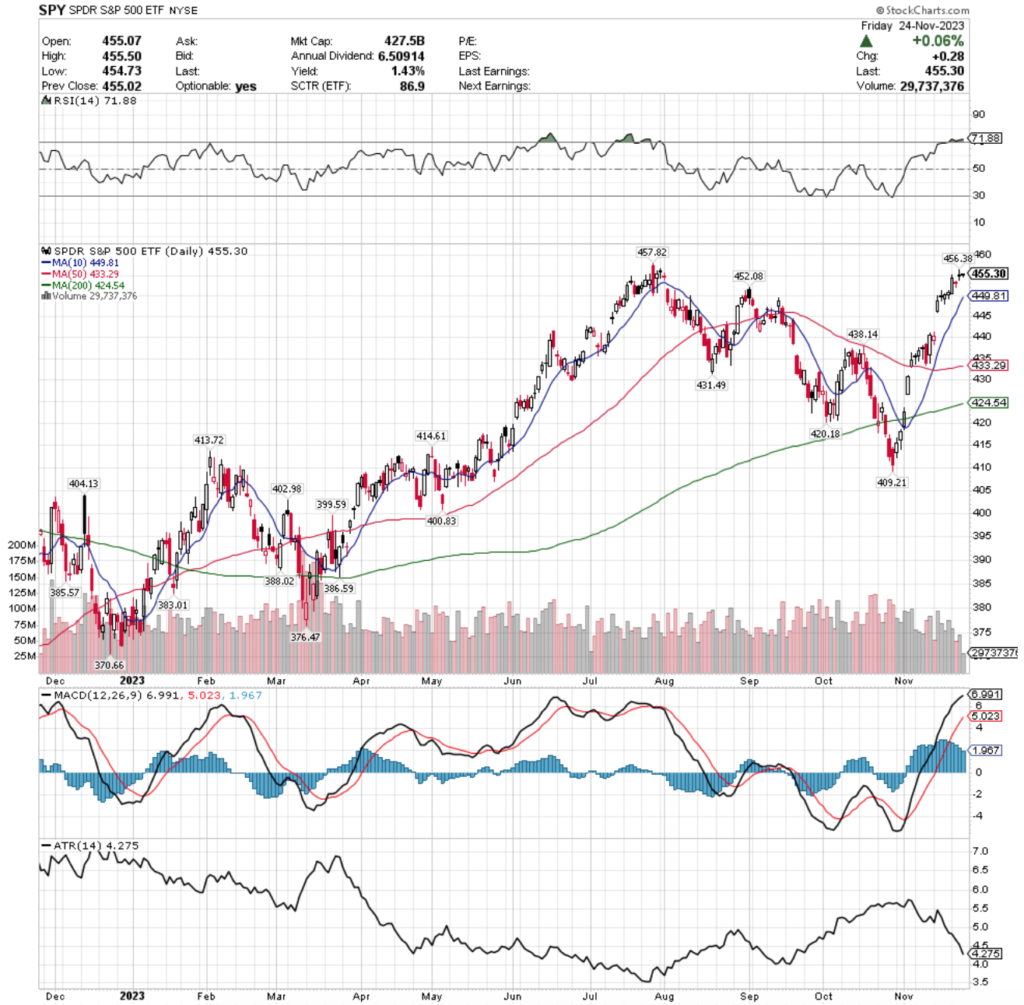
SPY, the SPDR S&P 500 ETF added +1.13% last week, faring the second worst of the indexes, second only to the NASDAQ.
SPY ETF – SPDR S&P 500 ETF’s Technical Performance Over The Past Year
Their RSI is overbought at 71.88 & their MACD is showing signals of losing steam & an impending bearish crossover.
Volumes were a cause for concern last week, falling -27.32% below average compared to the year prior (59,685,350 vs. 82,125,986) & really signaling uncertainty in the near-term market environment.
Monday’s wide-range candle & advancing session also looks weaker than it first appeared, given that it was lower than 3 of the 5 sessions of the week before, neck & neck with 1 of the 5 & only higher than the prior Monday’s session, which was a declining day.
Tuesday’s candle created a bearish harami pattern, but as it was a dragonfly doji created the set up for Wednesday & Friday’s slight increases.
Wednesday & Friday both resulted in dojis, however they were tied tightly to the range created by the upper shadow of Monday’s session’s candle.
Also bearish, they closed lower than they opened, despite opening slightly up each day, signaling that risk appetite is weak as we sit near 52-week highs.
Wednesday’s session tried to push a bit higher based on the upper shadow, but it appears that there is limited-to-no interest in surpassing the current 52-week high currently.
SPY’s Average True Range is also signaling that there is not much strength to the current price trend & indicates that there will be a cool-down period in the near-future, pending no market catalyst appear from earnings reports or data reported next week.
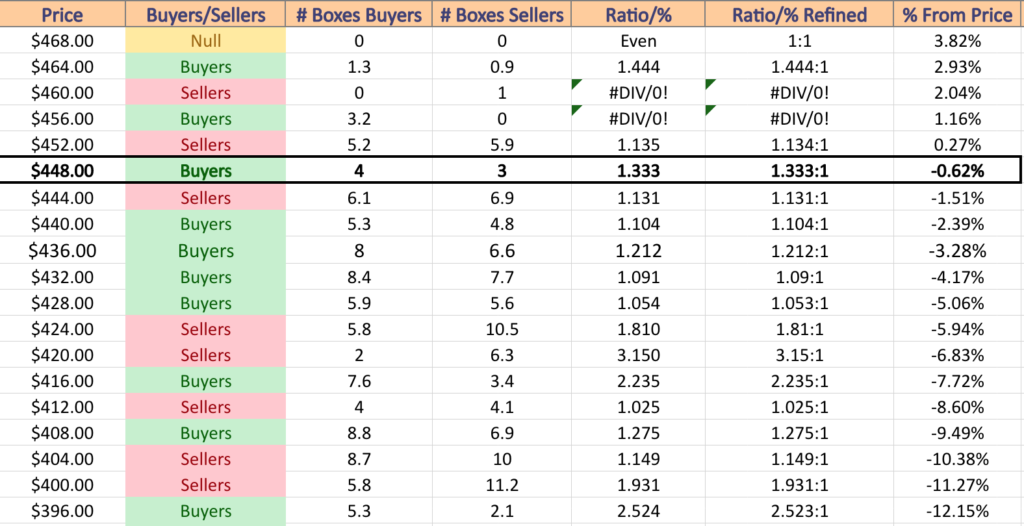
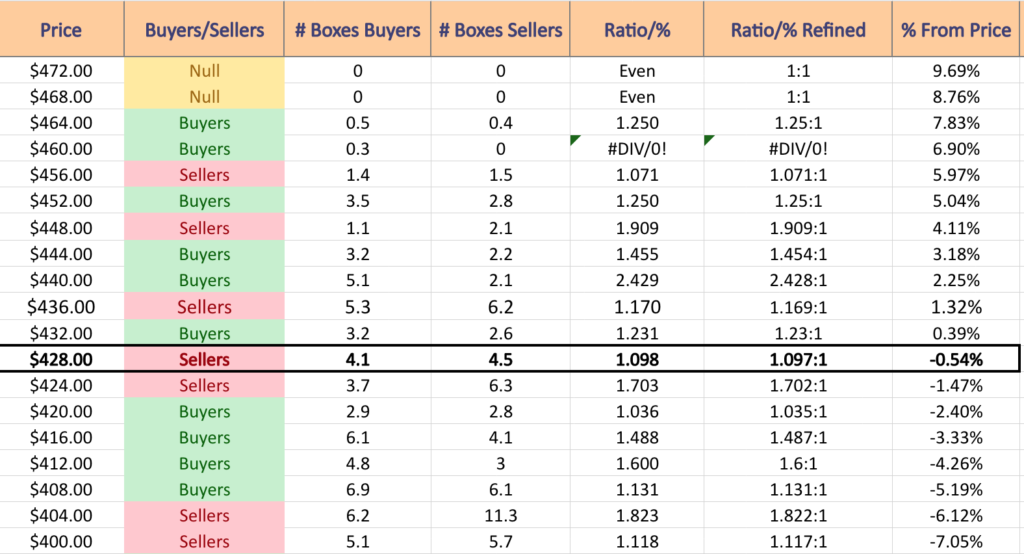
SPY does have more buyers than sellers at every price level between here & ~-7%, but if the $448 price level doesn’t hold up, the buyer-dominant sentiment weakens dramatically before giving way to seller dominated zones that have much more strength in terms of Sellers:Buyers.
There looks to be an additional 5-6% of declines that could come about if those buyer dominated zones give way, as the next strong level of buyers that is not nestled into the seller blocks is -13% from the current price.
SPY ETF – SPDR S&P 500 ETF’s Price Level:Volume Sentiment Over The Past 2-3 Years
SPY ETF – SPDR S&P 500 ETF’s Price Level:Volume Sentiment Over The Past 2-3 Years
SPY ETF – SPDR S&P 500 ETF’s Price Level:Volume Sentiment Over The Past 2-3 Years
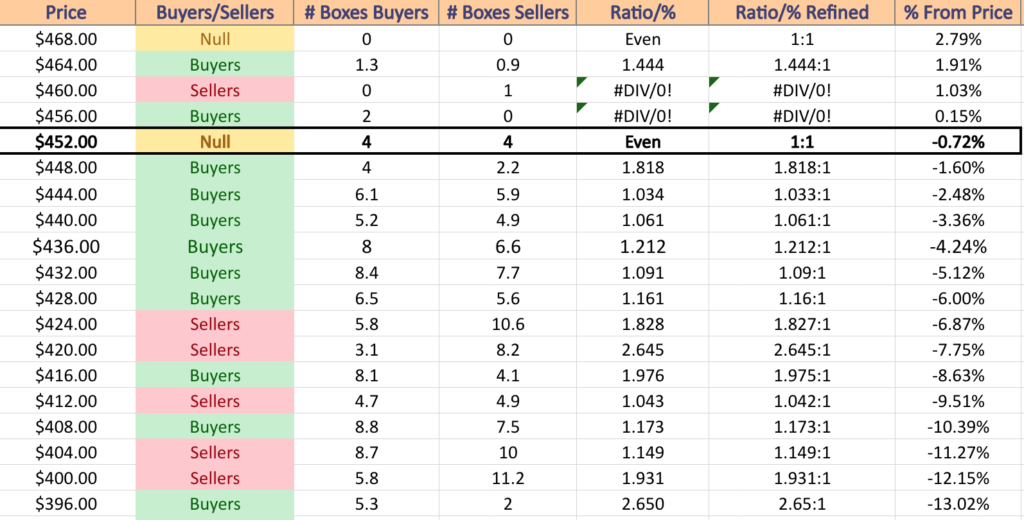
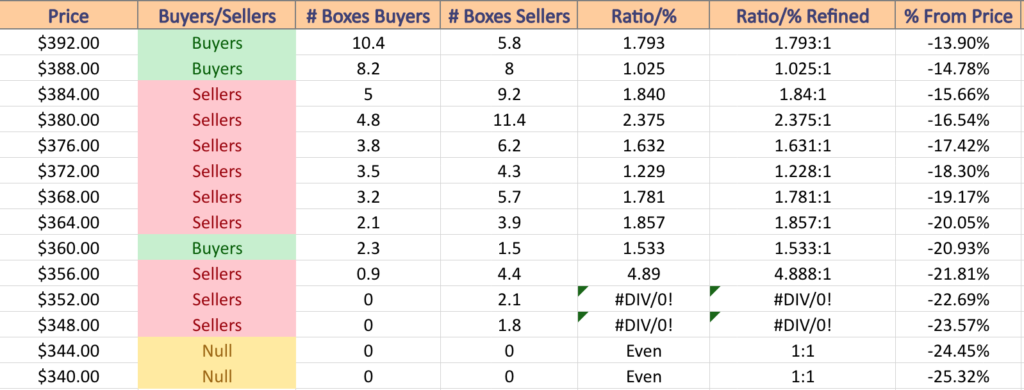
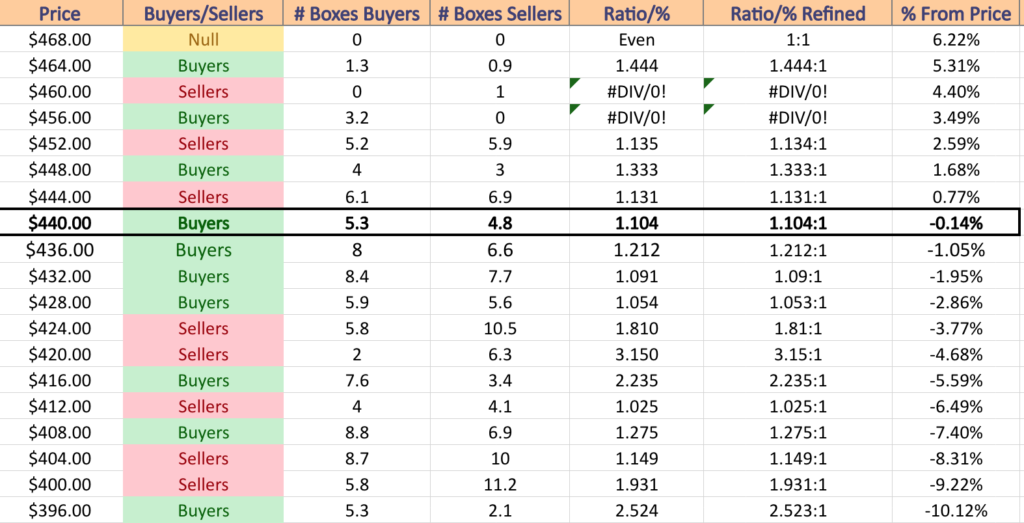
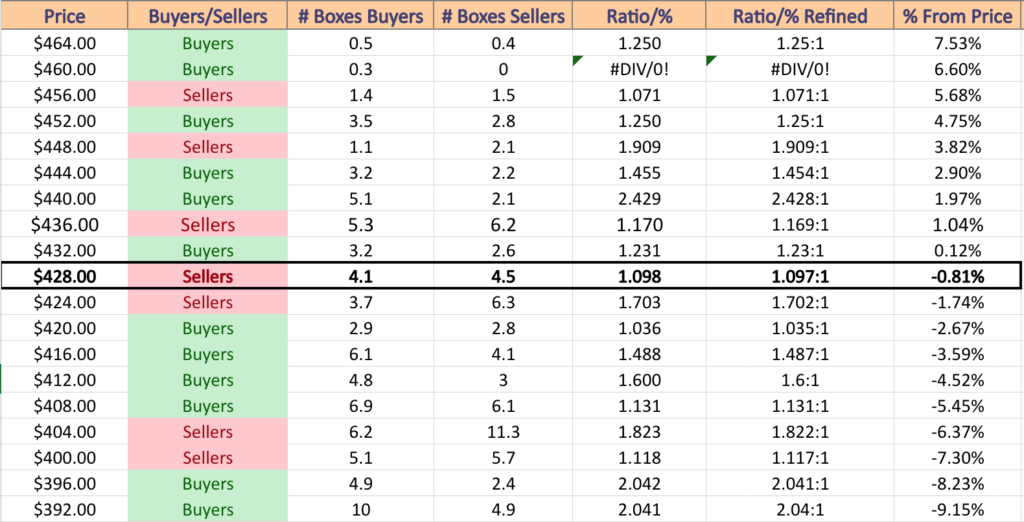
Price Level:Volume Sentiment Analysis For SPY, the SPDR S&P 500 ETF
$468 – NULL – 0:0*; +2.79% From Current Price Level
$464 – Buyers – 1.44:1; +1.91% From Current Price Level
$460 – Sellers – 1:0*; +1.03% From Current Price Level
$456 – Buyers – 2:0*; +0.15% From Current Price Level
$452 – Even – 1:1; -0.72% From Current Price Level – Current Price Box*
$448 – Buyers – 1.82:1; -1.6% From Current Price Level – 10 Day Moving Average*
$444 – Buyers – 1.03:1; -2.48% From Current Price Level
$440 – Buyers – 1.06:1; -3.36% From Current Price Level
$436 – Buyers – 1.21:1; -4.24% From Current Price Level
$432 – Buyers – 1.09:1; -5.12% From Current Price Level – 50 Day Moving Average*
$428 – Buyers – 1.16:1; -6% From Current Price Level
$424 – Sellers – 1.83:1; -6.87% From Current Price Level – 200 Day Moving Average*
$420 – Sellers – 2.65:1; -7.75% From Current Price Level
$416 – Buyers – 1.98:1; -8.63% From Current Price Level
$412 – Sellers – 1.04:1; -9.51% From Current Price Level
$408 – Buyers – 1.17:1; -10.39% From Current Price Level
$404 – Sellers – 1.15:1; -11.27% From Current Price Level
$400 – Sellers – 1.93:1; -12.15% From Current Price Level
$396 – Buyers – 2.65:1; -13.02% From Current Price Level
$392 – Buyers – 1.79:1; -13.9% From Current Price Level
$388 – Buyers – 1.03:1; -14.78% From Current Price Level
$384 – Sellers – 1.84:1; -15.66% From Current Price Level
$380 – Sellers- 2.38:1; -16.54% From Current Price Level
$376 – Sellers – 1.63:1; -17.42% From Current Price Level
$372 – Sellers – 1.23:1; -18.3% From Current Price Level
$368 – Sellers – 1.78:1; -19.17% From Current Price Level
$364 – Sellers – 1.86:1; -20.05% From Current Price Level
$360 -Buyers – 1.53:1; -20.93% From Current Price Level
$356 – Sellers – 4.89:1; -21.81% From Current Price Level
$352 – Sellers – 2.1:0*; -22.69% From Current Price Level
$348 – Sellers – 1.8:0*; -23.57% From Current Price Level
Technical Analysis & Price Level:Volume Sentiment Analysis For The NASDAQ (QQQ)
QQQ ETF – Invesco QQQ Trust ETF’s Technical Performance Over The Past Year
Their RSI is fluttering around the overbought level & sits currently at 69.03, but their MACD is aggressively barreling towards a bearish crossover in the coming sessions.
Volumes were also notably weak for QQQ this week, falling -24.6% below average compared to the year prior (39,920,300 vs. 52,941,855) as market participants got hesitant once reaching a new 52-week high & began to pump the brakes.
Monday opened strong, but the session’s volume was weaker than every session of the week prior’s & Tuesday’s bearish volume was neck & neck with Monday’s levels, as profits were eagerly taken.
Tuesday’s candle also formed a bearish harami with a dragonfly doji, similar to SPY’s set up, except QQQ was able to crack a new 52-week high on Wednesday’s spinning top session.
Given that Wednesday’s real body resides on the lower end of the day’s range & has a long upper shadow, it is safe to say that there is not much faith in strength at these price levels.
Friday’s doji candle will be of interest to watch into next week though, as it did not decline deep into Tuesday’s candle’s lower shadow, but the 10 day moving average is fast approaching & investors will want to know whether this will function as support or resistance in the near-term.
QQQ’s ATR also does not signal that this trend is particularly strong & implies that there is a cool-off/consolidation move in the making for the near-term.
From their current price, QQQ has no seller dominated price zones until a decline of ~7.5%, which may be regarded as a signal of strength, but note that beyond the nearest two supporting price levels with buyer sentiment the enthusiasm historically has waned & seller dominated zones account for the next 10%+ of declines from there, which should be cause for concern.
Once prices decline beyond $335.99/share there will be a lot of selling pressure historically, with no support until $312.31 which will be another thing to keep an eye on.
There is a good support zone between $303.99-311.99/share though, which would be a relief given that at that point prices would have declined by ~20%.
QQQ ETF – Invesco QQQ Trust ETF’s Price Level:Volume Sentiment Over The Past 1-2 Years
QQQ ETF – Invesco QQQ Trust ETF’s Price Level:Volume Sentiment Over The Past 1-2 Years
QQQ ETF – Invesco QQQ Trust ETF’s Price Level:Volume Sentiment Over The Past 1-2 Years
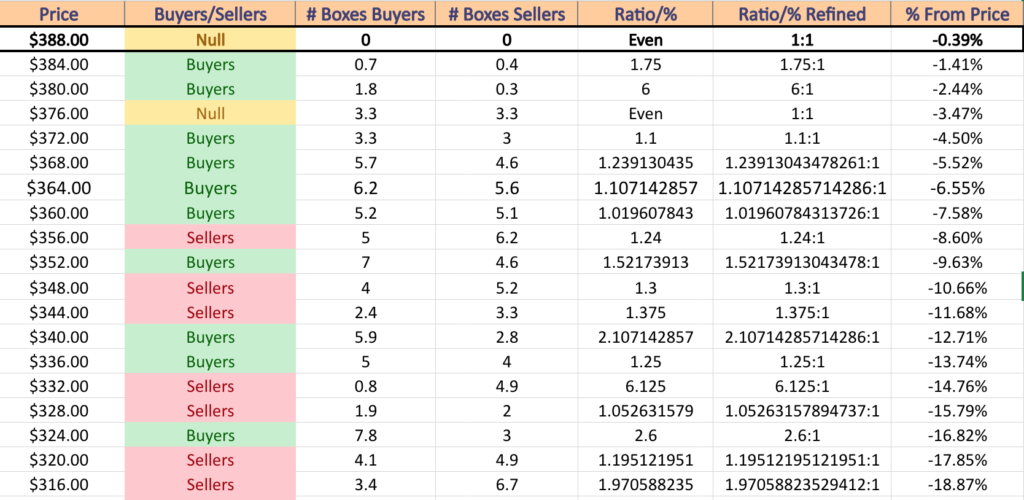
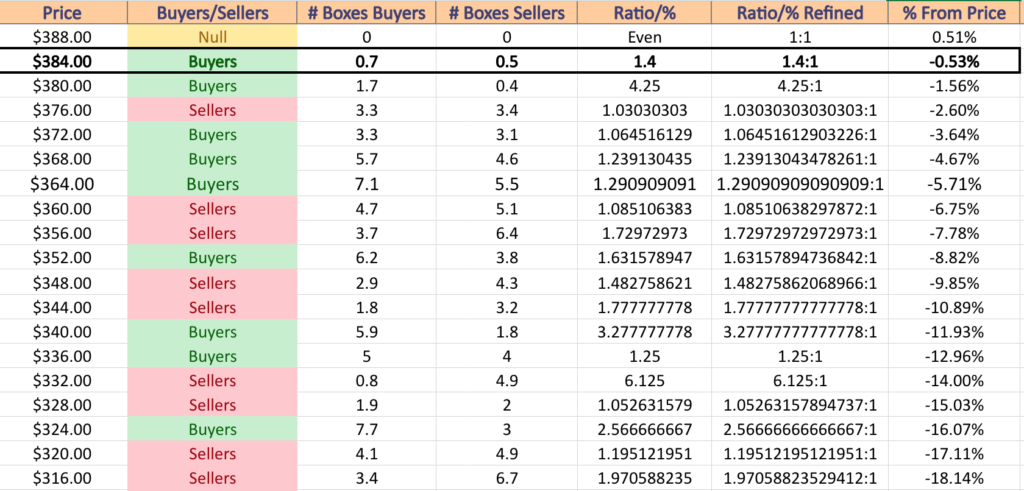
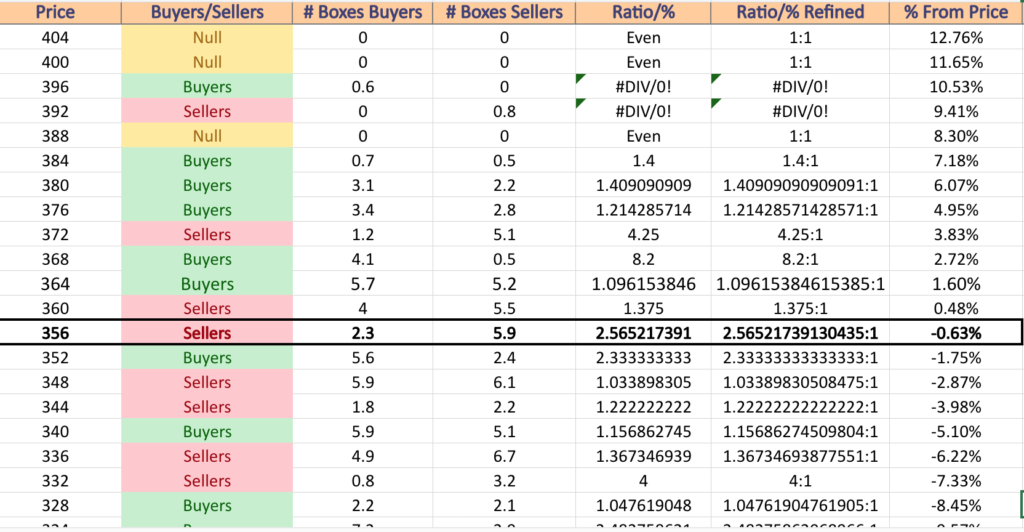
Price Level:Volume Sentiment Analysis For QQQ, the Invesco QQQ Trust ETF (NASDAQ)
$388 – NULL – 0:0*; -0.39% From Current Price Level – Current Price Box*
$384 – Buyers – 1.75:1; -1.41% From Current Price Level – 10 Day Moving Average*
$380 – Buyers – 6:1; -2.44% From Current Price Level
$376 – Even – 1:1; -3.47% From Current Price Level
$372 – Buyers – 1.1:1; -4.5% From Current Price Level
$368 – Buyers – 1.24:1; -5.52% From Current Price Level
$364 – Buyers – 1.11:1; -6.55% From Current Price Level – 50 Day Moving Average*
$360 – Buyers – 1.02:1; -7.58% From Current Price Level
$356 – Sellers – 1.24:1; -8.6% From Current Price Level
$352 – Buyers – 1.52:1; -9.63% From Current Price Level
$348 – Sellers – 1.3:1; -10.66% From Current Price Level
$344 – Sellers – 1.38:1; -11.68% From Current Price Level – 200 Day Moving Average*
$340 – Buyers – 2.11:1; -12.71% From Current Price Level
$336 – Buyers – 1.25:1; -13.74% From Current Price Level
$332 – Sellers – 6.13:1; -14.76% From Current Price Level
$328 – Sellers – 1.05:1; -15.79% From Current Price Level
$324 – Buyers – 2.6:1; -16.82% From Current Price Level
$320 – Sellers – 1.20:1; -17.85% From Current Price Level
$316 – Sellers – 1.97:1; -18.87% From Current Price Level
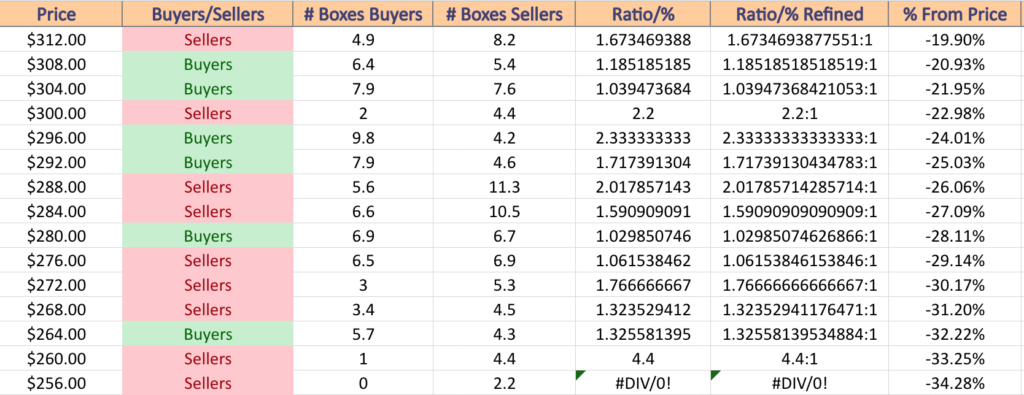
$312 – Sellers – 1.67:1; -19.9% From Current Price Level
$308 – Buyers – 1.19:1; -20.93% From Current Price Level
$304 – Buyers – 1.04:1; -21.95% From Current Price Level
$300 – Sellers – 2.2:1; -22.98% From Current Price Level
$296 – Buyers – 2.33:1; -24.01% From Current Price Level
$292 – Buyers – 1.72:1; -25.03% From Current Price Level
$288 – Sellers – 2.02:1; -26.06% From Current Price Level
$284 – Sellers – 1.59:1; -27.09% From Current Price Level
$280 – Buyers – 1.03:1; -28.11% From Current Price Level
$276 – Sellers – 1.06:1; -29.14% From Current Price Level
$272 – Sellers – 1.77:1; -30.17% From Current Price Level
$268 – Sellers – 1.32:1; -31.2% From Current Price Level
$264 – Buyers – 1.33:1; -32.22% From Current Price Level
$260 – Sellers – 4.4:1; -33.25% From Current Price Level
$256 – Sellers – 2.2:0*; -34.28% From Current Price Level
Technical Analysis & Price Level:Volume Sentiment Analysis For The Russell 2000 (IWM)
IWM ETF – iShares Russell 2000 ETF’s Technical Performance Over The Past Year
Their RSI is trending towards overbought after the gap up the week prior & sits at 60.38, while the MACD is beginning to show signs of exhaustion & looks like it may curl over bearishly in the coming days.
Volumes were +6.75% above average compared to the year prior (31,657,550 vs. 29,656,354), most likely attributed to people following the high volume trades of last week trying to make some last second profits.
IWM’s chart tells a different story than the previous two that we’ve reviewed, as they have recently bounced off of a 52-week low & been in recovery.
Monday had the third highest volume of the short week & prices made advances, but Tuesday’s declining session of profit taking was the highest volume session of the week, signaling a lack of strength at these price levels.
Wednesday featured a doji going into the holiday Thursday, where market participants sat unsure about which way to go next.
Friday’s candle is one of interest though, as we begin to see some of the downwards pressure that the 200 DMA is applying to IWM’s price & will be something to continue watching into next week to see if small caps can muster up the performance to break through the 200 DMA’s resistance.
Their ATR is also not indicating that there is much strength in the more recent price movements in terms of establishing a new trend.
IWM’s price level:volume sentiment shows that there is some support for ~5% from here in terms of the levels being buyer dominated over the past 1-2 years, but after that it is a seller dominated zone all the way through their 52-week low.
IWM’s 50 day moving average will be something to also keep an eye on, as it will continue to trend higher & is already the last support level that is buyer dominated before we enter that seller-dominated elevator down.
IWM ETF – iShares Russell 2000 ETF’s Price Level:Volume Sentiment Over The Past 1-2 Years
IWM ETF – iShares Russell 2000 ETF’s Price Level:Volume Sentiment Over The Past 1-2 Years
IWM ETF – iShares Russell 2000 ETF’s Price Level:Volume Sentiment Over The Past 1-2 Years
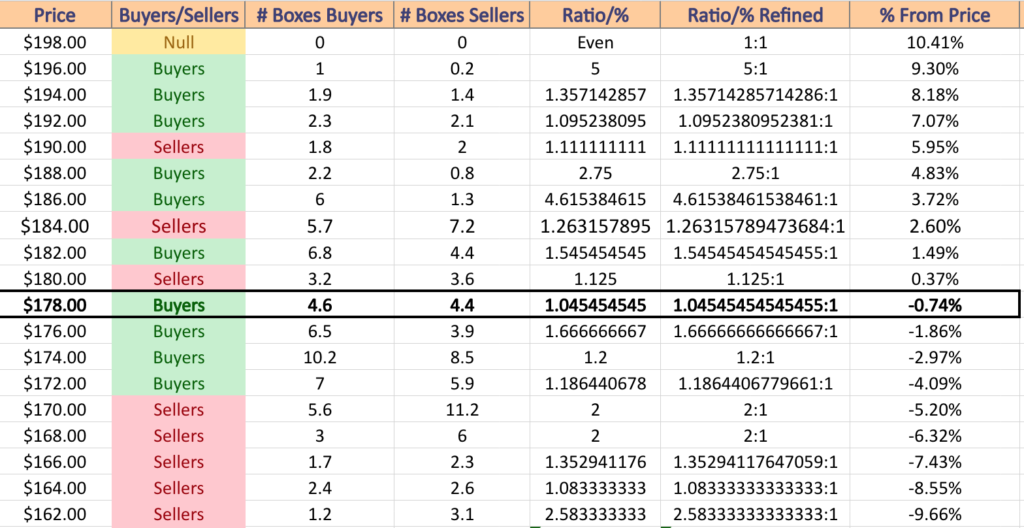
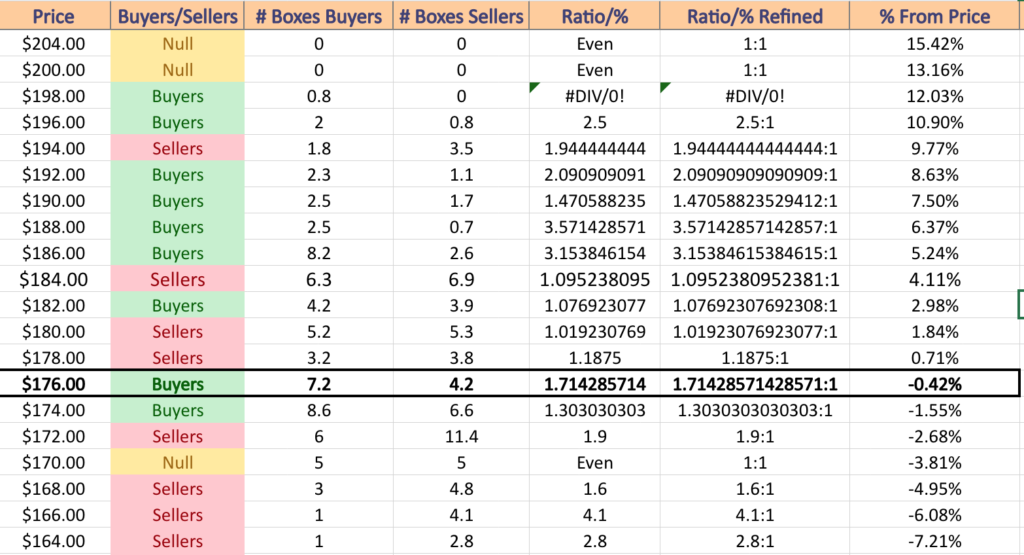
Price Level:Volume Sentiment For IWM, the iShares Russell 2000 ETF
$198 – NULL – 0:0*; +10.41% From Current Price Level
$196 – Buyers – 5:1; +9.3% From Current Price Level
$194 – Buyers – 1.36:1; +8.18% From Current Price Level
$192 – Buyers – 1.10:1; +7.07% From Current Price Level
$190 – Sellers – 1.11:1; +5.95% From Current Price Level
$188 – Buyers – 2.75:1; +4.83% From Current Price Level
$186 – Buyers – 4.62:1; +3.72% From Current Price Level
$184 – Sellers – 1.26:1; +2.6% From Current Price Level
$182 – Buyers – 1.55:1; +1.49% From Current Price Level
$180 – Sellers – 1.13:1; +0.37% From Current Price Level
$178 – Buyers – 1.05:1; -0.74% From Current Price Level – Current Price Box & 200 Day Moving Average**
$176 – Buyers – 1.67:1; -1.86% From Current Price Level – 10 Day Moving Average*
$174 – Buyers – 1.2:1; -2.97% From Current Price Level
$172 – Buyers – 1.19:1; -4.09% From Current Price Level
$170 – Sellers – 2:1; -5.2% From Current Price Level
$168 – Sellers – 2:1; -6.32% From Current Price Level
$166 – Sellers – 1.36:1; -7.43% From Current Price Level
$164 – Sellers – 1.08:1; -8.55% From Current Price Level
$162 – Sellers – 2.58:1; -9.66% From Current Price Level
$160 – Sellers – 0.6:0*; -10.78% From Current Price Level
Technical Analysis & Price Level:Volume Sentiment Analysis For The Dow Jones Industrial Average (DIA)
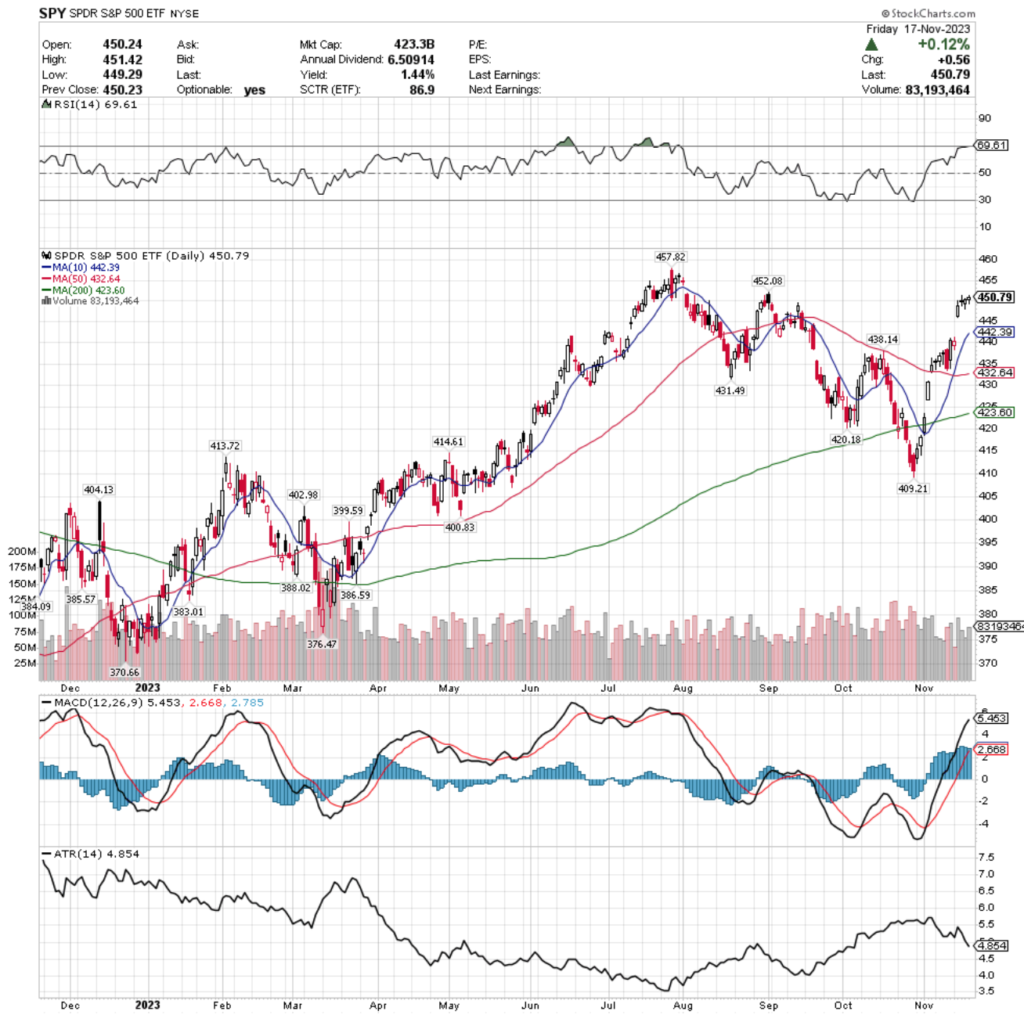
DIA ETF – SPDR Dow Jones Industrial Average ETF’s Technical Performance Over The Past Year
Their RSI is overbought at 73.41 & their MACD is signaling overextension & that there is a near-term consolidation period on the horizon.
Volumes were noteworthy though, falling -27.03% below average compared to the year prior (2,565,383 vs. 3,515,596), which does not make the week’s gains anything of note.
DIA is approaching their current 52-week high, but based on the last 2 sessions’ candles will not have an easy time breaking it.
Monday’s session looks like the other three indexes, non-noteworthy volume on a wide range session, Tuesday’s candle formed a bearish engulfing pattern on Monday’s, but its higher positioning in the day prior’s range did set up the slight gains of the next two sessions for the large caps.
However, Wednesday & Thursday’s spinning tops are signaling even more indecision, particularly as the volumes have been weak.
Note too that Friday’s open is at the extension of Thursday’s upper shadow that was on a relatively tall upper shadow, which is more indicative of a pump into weakness than of actual strength.
Like all of the other indexes, their ATR is also not supporting a narrative of strength around recent price movements & does flash a signal of near-term caution.
Their 10 DMA is also going to be something to keep a close eye on, as it is currently moving upwards still, while being the second highest level of support from the current price.
Once it becomes the highest support level it will be worth noting whether it acts as support or gets broken through, as then only the $349.45/share will be support before prices enter the window from the gap that we wrote about last week.
Buyers currently are in the drivers seat for the next ~7% downwards, however should there not be enough support there that 7% decline can very easily become 12%+ in losses based on the seller dominated price zones that sit just below the buyer blocks.
DIA ETF – SPDR Dow Jones Industrial Average ETF’s Price Level:Volume Sentiment For The Past 3-4 Years
DIA ETF – SPDR Dow Jones Industrial Average ETF’s Price Level:Volume Sentiment For The Past 3-4 Years
DIA ETF – SPDR Dow Jones Industrial Average ETF’s Price Level:Volume Sentiment For The Past 3-4 Years
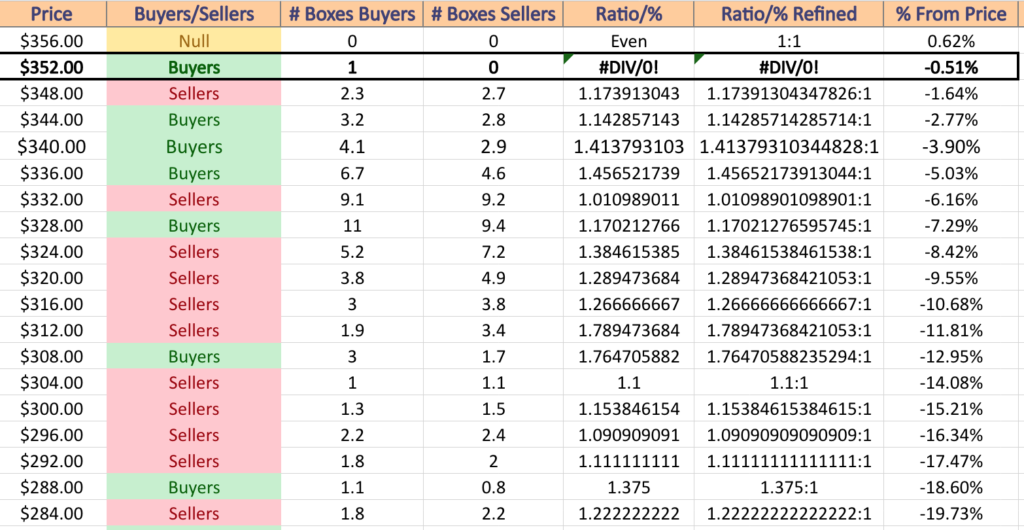
Price Level:Volume Sentiment For DIA, the SPDR Dow Jones Industrial Average ETF
$356 – NULL – 0:0*; +0.62% From Current Price Level
$352 – Buyers – 1:0*; -0.51% From Current Price Level – Current Price Box*
$348 – Sellers – 1.17:1; -1.64% From Current Price Level – 10 Day Moving Average*
$344 – Buyers – 1.14:1; -2.77% From Current Price Level
$340 – Buyers – 1.41:1; -3.9% From Current Price Level
$336 – Buyers, 1.46:1; -5.03% From Current Price Level – 50 & 200 Day Moving Averages**
$332 – Sellers – 1.01:1; -6.16% From Current Price Level
$328 – Buyers – 1.17:1; -7.29% From Current Price Level
$324 – Sellers – 1.39:1; -8.42% From Current Price Level
$320 – Sellers – 1.29:1; -9.55% From Current Price Level
$316 – Sellers – 1.27:1; -10.68% From Current Price Level
$312 – Sellers – 1.79:1; -11.81% From Current Price Level
$308 – Buyers – 1.77:1; -12.95% From Current Price Level
$304 – Sellers – 1.1:1; -14.08% From Current Price Level
$300 – Sellers – 1.15:1; -15.21% From Current Price Level
$296 – Sellers – 1.09:1; -16.34% From Current Price Level
$292 – Sellers – 1.11:1; -17.47% From Current Price Level
$288 – Buyers – 1.38:1; -18.6% From Current Price Level
$284 – Sellers – 1.22:1; -19.73% From Current Price Level
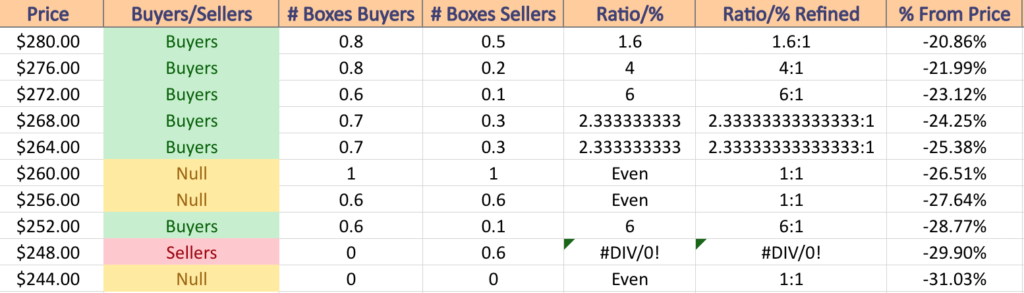
$280 – Buyers – 1.6:1; -20.86% From Current Price Level
$276 – Buyers – 4:1; -21.99% From Current Price Level
$272 – Buyers – 6:1; -23.12% From Current Price Level
$268 – Buyers – 2.33:1; -24.25% From Current Price Level
$264 – Buyers – 2.33:1; -25.38% From Current Price Level
$260 – Even – 1:1; -26.51% From Current Price Level
$256 – Even – 1:1; -27.64% From Current Price Level
$252 – Buyers – 6:1; -28.77% From Current Price Level
$248 – Sellers – 0.6:0*; -29.9% From Current Price Level
$244 – NULL – 0:0*; -31.03% From Current Price Level
The Week Ahead
Monday kicks the week off with New Homes Sales data at 10 am.
Cerence & Zscaler also are due to report earnings on Monday.
S&P Case-Shiller Home Price Index (20 Cities) data is released Tuesday at 9 am, followed by Consumer Confidence, Fed Governor Christopher Waller speaking & Chicago Fed President Austan Goolsbee speaking at 10 am, before Fed Governor Michelle Bowman speaks at 10:45 & the day winds down with Fed Governor Michael Barr speaking at 1:50 pm & 3:30 pm.
Tuesday’s earnings calls include AZEK, Bank of Montreal, CrowdStrike, Hewlett Packard Enterprise, Intuit, Leslie’s, NetApp, Pinduoduo, Splunk & Workday.
Wednesday delivers GDP (first revision), Advanced U.S. Trade Balance in Goods, Advanced Retail Inventories & Advanced Wholesale Inventories data at 8:30 am, Cleveland Fed President Loretta Mester speaking at 1:45 pm & the Fed Beige Book at 2 pm.
Dollar Tree, Salesforce, Arrowhead, Bilibili, Credo Technology Group, Donaldson, Farfetch, Five Below, Foot Locker, Hormel Foods, La-Z-Boy, Nutanix, Okta, Patterson Companies, Petco Health and Wellness, PVH, Snowflake, Synopsys, Vestis, Victoria’s Secret & Zuora are all scheduled to report earnings on Wednesday.
8:30 am Thursday will be busy, with Initial Jobless Claims, Personal Income (nominal), Personal Spending (nominal), PCE Index, Core PCE Index, PCE (Year-over-Year) & Core PCE (Year-over-Year) data being released, followed by New York Fed President John Williams speaking at 9:05 am, Chicago Business Barometer data at 9:45 am & Pending Home Sales data at 10 am.
Ulta Beauty, Academy Sports + Outdoors, Ambarella, American Woodmark, Big Lots, Cracker Barrel, Dell, Domo, Frontline, Kroger, PagerDuty, Royal Bank of Canada, Titan Machinery, Toronto-Dominion Bank, UBS AG, UiPath & Zumiez will all report earnings on Thursday.
Friday gives us Fed Governor Michael Barr speaking at 3 am, ISM Manufacturing data, Construction Spending & Austan Goolsbee speaking at 10 am, Fed Chair Jerome Powell speaks at 11 am & Chair Powell & Lisa Cook speak to local leaders in Atlanta at 2 pm.
Genesco is scheduled to report earnings on Friday.
See you back here next week!
*** I DO NOT OWN SHARES OR OPTIONS CONTRACT POSITIONS IN SPY, QQQ, IWM or DIA AT THE TIME OF PUBLISHING THIS ARTICLE ***
SPY, the SPDR S&P 500 ETF advanced +2.31% over the past week, faring second best to the small cap Russell 2000 index.
SPY ETF – SPDR S&P 500 ETF’s Technical Performance Over The Past Year
Their RSI is trending towards overbought conditions & sits at 69.61, while their MACD is currently bullish, but beginning to show signs of being over-extended & wearing out.
Volumes were -5.72% below average compared to the year prior (77,666,967 vs. 82,383,130), adding skepticism to last Tuesday’s gap up session that has led to the most recent price range it trades in.
Monday the week kicked off on a slightly negative note, resulting in a spinning top candlestick, a clear sign of indecision which was further confirmed by the low volume of the day’s session.
Tuesday’s gap up was the highest volume session of the week, but the price action was mostly consolidated to the lower range of the day’s candlestick, signaling that the tall upper shadow did not have much strength.
Wednesday’s session resulted in a doji, as investors didn’t know what to think & mostly sat still, while Thursday showed market participants were slightly inclined to take more risk, but the day’s session remained tightly range-bound.
Friday capped the week off with a spinning top, that if it did not have an upper shadow would have been a hanging man, giving a downbeat sentiment moving into a new week, but the price inched higher.
Tuesday’s gap will be a key area to keep an eye on in the coming days, as only the 10 day moving average is currently in a position of support within the window, with the next highest level of support being below it at $438.14.
Their Average True Range does not indicate that last week’s new range is particularly strong & should be watched carefully over the coming week, particularly if the resistance of the $452.08/share price level holds up & prices are unable to break through.
SPY has support at the $442.39 (10 Day Moving Average; Volume Sentiment: Buyers, 1.1:1), $438.14 (Volume Sentiment: Buyers, 1.21:1), $432.64 (50 Day Moving Average; Volume Sentiment: Buyers, 1.09:1) & $431.49/share (Volume Sentiment: Buyers, 1.05:1) price level, with resistance at the $452.08 (Volume Sentiment: Sellers, 1.13:1) & $457.82/share (52-Week High; Volume Sentiment: Buyers, 3.2:0*) price levels.
SPY ETF’s Price Level:Volume Sentiment Over The Past 2-3 Years
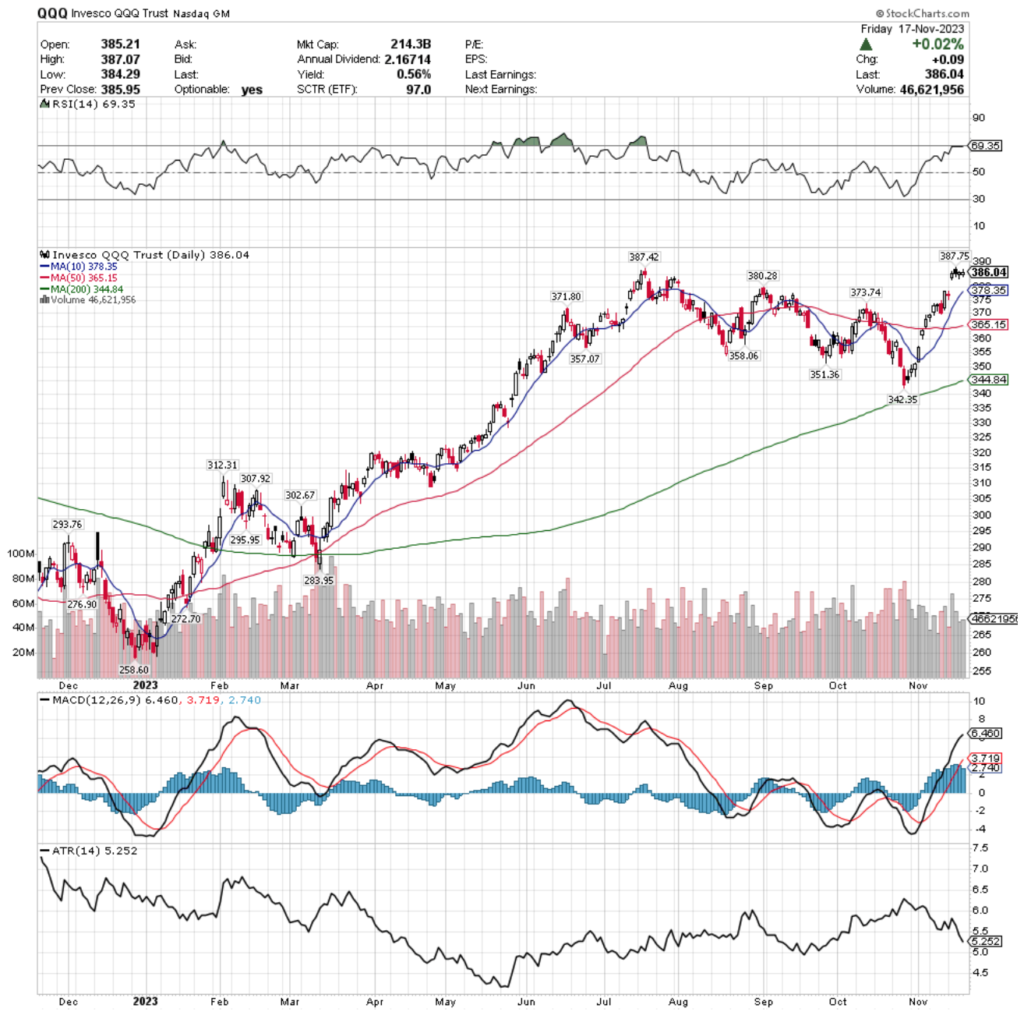
QQQ, the Invesco QQQ Trust ETF gained +2.02% last week, as market participants were least fond of the tech heavy index compared to the other major indexes.
QQQ ETF – Invesco QQQ Trust ETF’s Technical Performance Over The Past Year
Their RSI is trending towards overbought levels at 69.35, with their MACD still bullish but beginning to show signals of exhaustion & the top is curling over.
Volumes were -1.75% below average last week compared to the year prior (52,148,783 vs. 53,078,624), and a new 52-week high was hit, but the sentiment does not overly bullish currently, as all of the prices post-Tuesday’s gap up session are rangebound.
Monday kicked off the week on a downward note, however the candle was a doji, signaling that market participants did not have a clue as to whether they wanted to assume more risk or not.
Tuesday’s reaction to CPI data was a gap up, but most of the week’s sessions resulted in spinning tops, indicating that there is still a great deal of uncertainty & indecision in the marketplace.
Wednesday’s session set a new 52-week high, however prices were scared into closing the day lower than they opened, despite the day ending green.
Volumes continued to decline, Thursday as prices stuck around the range established on Tuesday by the gap up, but all eyes will be on whether or not that window begins to close this week, as the 52-week high did not encourage market participants to come out in droves & force the NASDAQ higher.
Their ATR also suggests that this price level may be short-lived & that there is not much strength propping price levels up currently.
There is ~2% between the current price & the next support level, which happens to sit below Tuesday’s window as well.
QQQ has support at the $380.28 (10 Day Moving Average; Volume Sentiment: Buyers, 4.25:1), $378.35 (10 Day Moving Average; Volume Sentiment: Sellers, 1.03:1), $373.74 (50 Day Moving Average; Volume Sentiment: Buyers, 1.07:1) & $371.80/share (Volume Sentiment: Buyers, 1.24:1) price level, with resistance at the $387.42 (Volume Sentiment: Buyers, 1.4:1) & $387.75/share (52-Week High; Volume Sentiment: Buyers, 1.4:1) price levels.
QQQ ETF’s Price Level:Volume Sentiment Over The Past 1-2 Years
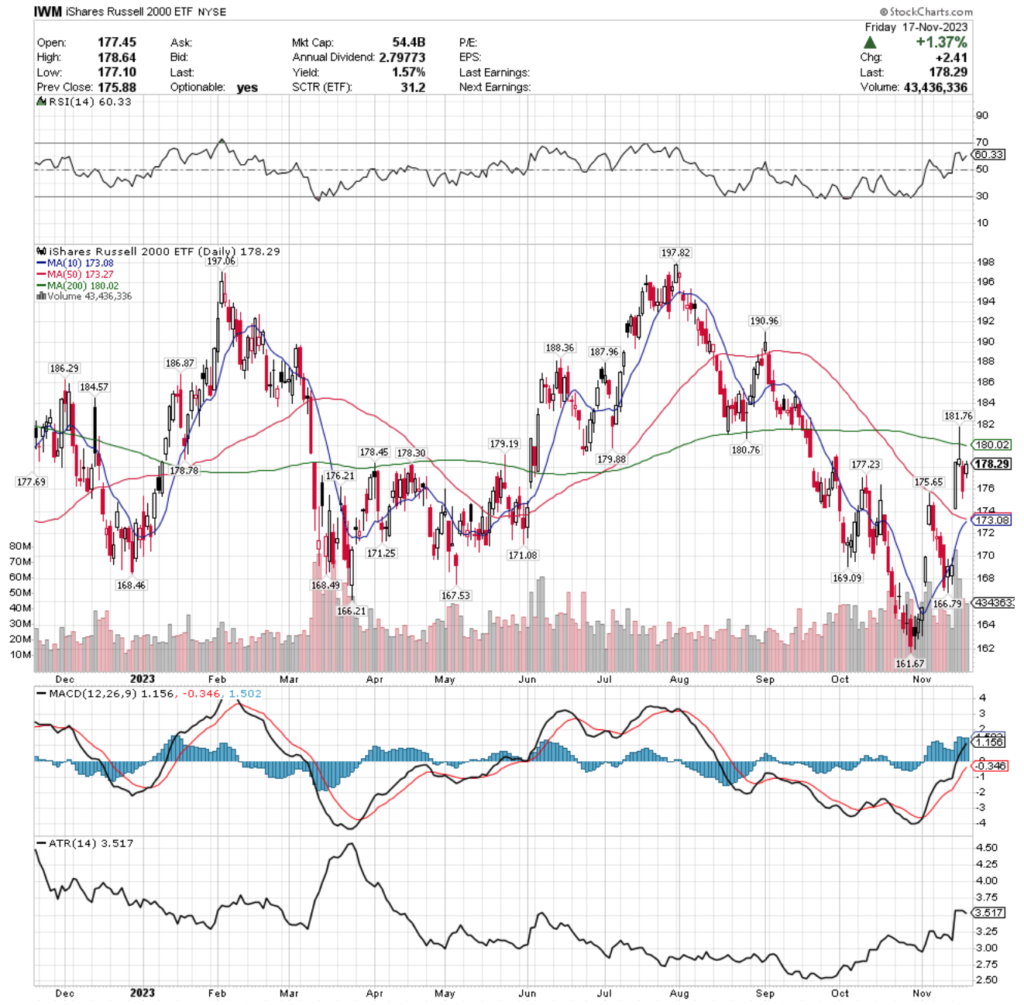
IWM, the iShares Russell 2000 ETF jumped +5.43% last week after months of steady decline, mostly attributed to a gap up session on Tuesday.
IWM ETF – iShares Russell 2000 ETF’s Technical Performance Over The Past Year
Their RSI is trending towards overbought & sits at 60.33, while their MACD is showing signals of being overextended following Tuesday’s gap up session.
Volumes were +63.92% above average compared to the year prior (48,503,233 vs. 29,588,731) as market participants jumped back in on Tuesday following the CPI print in a session that eclipsed the sessions of the past 52-weeks.
Monday was a slightly bullish session that stayed neck & neck with Friday prior’s range.
Tuesday created a gap window that jumped almost above the top of the previous price range on the open & proceeded higher.
Wednesday’s candle resulted in a shooting star after rallying higher & temporarily breaking the resistance of the 200 day moving average before closing at the lower end of the day’s range, well below the 200 DMA.
Thursday saw some profit taking following the two high volume sessions with Friday’s candle sticking by the top of Thursday’s trading range, as market participants became unclear as to how strong the recent moves will hold up.
Their ATR is suggesting some consolidation into Tuesday’s window is on the near-term horizon, which will be where we see the strength of the support of their 10 & 50 day moving averages, both of which are currently sitting towards the upper end of the window.
IWM has more support in their price window than the previously mentioned indexes, mostly due to their more range-bound behavior & lack of runaway rallies.
Their current price is now ~10% above their 52-week low, making it especially interesting to keep an eye on their current support levels & how strong they are.
The $178.30 resistance level is also another place to keep an eye on, with Friday’s price action failing to close above it.
IWM has support at the $177.69 (10 Day Moving Average; Volume Sentiment: Buyers, 1.55:1), $177.23 (Volume Sentiment: Buyers, 1.55:1), $176.21 (50 Day Moving Average; Volume Sentiment: Buyers, 1.55:1) & $175.65/share (Volume Sentiment: Buyers, 1.08:1) price level, with resistance at the $178.30 (Volume Sentiment: Sellers, 1.25:1) & $178.45 (Volume Sentiment: Sellers, 1.25:1), $178.78 (Volume Sentiment: Sellers, 1.25:1) & $179.19/share (Volume Sentiment: Sellers, 1.25:1) price levels.
IWM ETF’s Price Level:Volume Sentiment Over The Past 1-2 Years
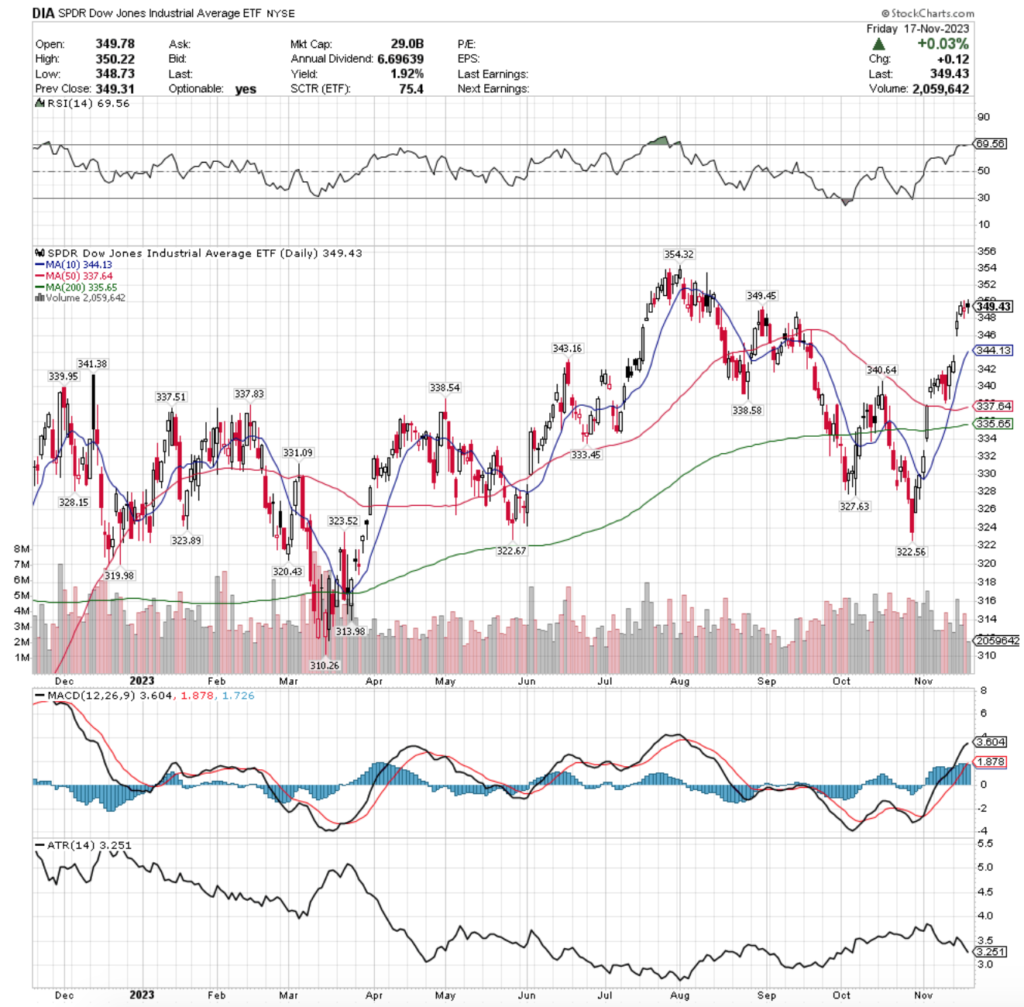
DIA ETF – SPDR Dow Jones Industrial Average ETF’s Technical Performance Over The Past Week
Their RSI is pushing into overbought territory at 69.56 & their MACD is still bullish, but beginning to show signs of weakening.
Volumes were -6.72% below average compared to the year prior (3,294,200 vs. 3,531,437) as investors were content for the most part, with exception to Tuesday’s higher than average volume session.
Much like IWM, DIA’s window that was created Tuesday has more support touch-points within the window than SPY or QQQ.
Friday’s spinning top that closed lower than it opened is cause for concern & something that investors will want to keep in mind stepping into the new week.
DIA has support at the $344.13 (10 Day Moving Average; Volume Sentiment: Buyers, 1.36:1), $343.16 (Volume Sentiment: Buyers, 1.56:1), $340.64 (50 Day Moving Average; Volume Sentiment: Buyers, 1.56:1) & $338.58/share (Volume Sentiment: Buyers, 1.2:1) price level, with resistance at the $349.45 (Volume Sentiment: Sellers, 1.28:1) & $354.32/share (52-Week High; Volume Sentiment: Buyers, 2.6:0*) price levels.
DIA ETF’s Price Level:Volume Sentiment Over The Past 3-4 Years
The Week Ahead
U.S. Leading Economic Indicators are released Monday at 10 am, followed by Richmond Fed President Tom Barkin making a TV appearance at 12 pm.
Monday’s earnings calls include Agilent, BellRing Brands, Keysight Technologies & Zoom Video Communications.
Existing Home Sales data is announced at 10 am Tuesday, with the Fed’s October 31-November 1st FOMC meeting minutes released at 2pm.
On Tuesday Abercrombie & Fitch, NVIDIA, Analog Devices, Autodesk, Baidu, Best Buy, Burlington Stores, Caleres, Dick’s Sporting Goods, Dycom, Guess?, Hibbett, HP, Jack In The Box, Jacobs Engineering, Kohl’s, Lowe’s, Medtronic, Nordstrom & Urban Outfitters are due to report earnings.
Wednesday kicks off with Initial Jobless Claims, Durable-goods Orders & Durable Goods-minus Transportation data at 8:30 am, followed by Consumer Sentiment (final) at 10 am.
Deere is scheduled to report earnings on Wednesday.
There are no major data announcements Thursday, as it is Thanksgiving.
Thursday (Thanksgiving) features earnings calls from Canadian banks Royal Bank of Canada & Toronto-Dominion Bank.
Friday has no noteworthy earnings reports scheduled & S&P Flash U.S. Services PMI & S&P Flash U.S. Manufacturing PMI data being released at 9:45 am.
See you back here next week!
*** I DO NOT OWN SHARES OR OPTIONS CONTRACT POSITIONS IN SPY, QQQ, IWM or DIA AT THE TIME OF PUBLISHING THIS ARTICLE ***
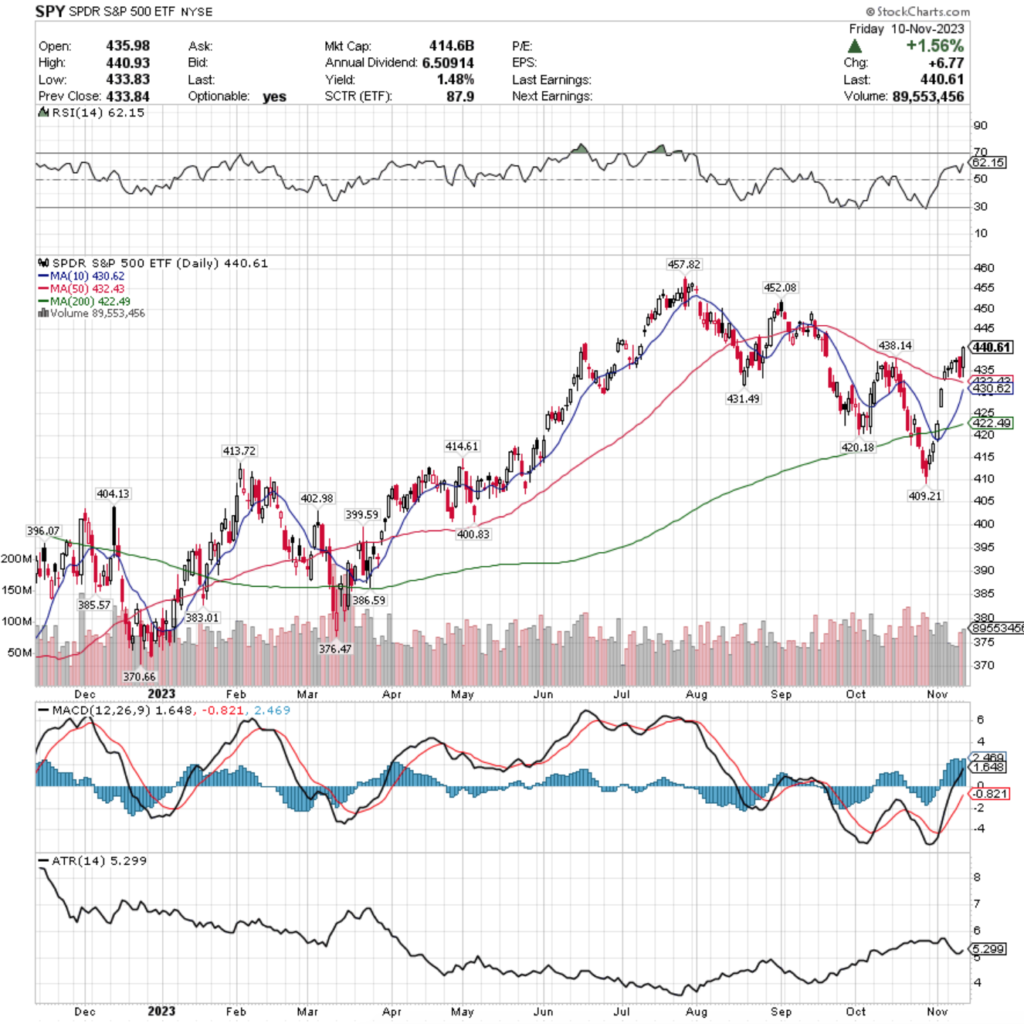
SPY, the SPDR S&P 500 ETF gained +1.13% over the past week, faring second best of the indexes, minus the NASDAQ.
SPY ETF – SPDR S&P 500 ETF’s Technical Performance Over The Past Year
Their RSI is trending towards overbought territory & currently sits at 62.15, while their MACD is still bullish, but beginning to show signs of exhaustion & like it is ready to curl over bearishly in the coming days.
Volumes were -11.14% below average compared to the year prior (73,294,080 vs. 82,484,337), which is not a signal of strength, particularly when you break down the weak volume Monday-Wednesday before Thursday when participants took their chips off of the table.
The week kicked off with a dragonfly doji in line with the range that was set up by last Friday’s gap up session that held support above the 50 day moving average.
Volume declined on Tuesday’s light advance session, and declined further for Wednesday’s session, which resulted in another dragonfly doji, indicating uncertainty & some fear on the part of market participants.
Thursday the volume advanced notably on a bearish engulfing candle that eclipsed the entire week ‘s price ranges leading up to it, as investors were eager to take profits off the table to safety.
Friday’s session squeezed out a +1.56% advance, which could be a squeeze before a slew of Fed speakers take to the stages this week, as prices closed in a no-man’s land area where there is limited support & resistance compared to the price action that has taken place there over the past 4-5 months.
Their Average True Range is reverting back towards its mean after the Advance of Friday, but when the calculation period is taken into account & the days of the coming week are factored in & the old days are dropped from the range, there looks to be more near-term downside risk.
The gaps of last week have left some windows that do not have much support near them open which may accelerate declines.
Something of note to keep an eye on too is the volume sentiment at their near-term support levels.
For the next ~3% there have been more buyers than sellers in the nearest support levels, however they weaken the further away from the current price that SPY falls, as shown in the table, before sellers take back over control at a clip of 1.81:1 after the price hits $427.99 & below.
The good news though is that after a -9.22% decline there will be some solid support once the $399.99/share level is reached, where Buyers have dominated the price zone 2.52:1 over the past 2-3 years.
SPY has support at the $438.14 (Volume Sentiment: Buyers, 1.21:1), $432.43 (50 Day Moving Average; Volume Sentiment: Buyers, 1.09:1), $431.49 (Volume Sentiment: Buyers, 1.05:1) & $430.62/share price level (10 Day Moving Average; Volume Sentiment: Buyers, 1.05:1), with resistance at the $452.08 (Volume Sentiment: Sellers, 1.13:1) & $457.82/share price levels (52-Week High; Volume Sentiment: Buyers, 3.2:0*).
SPY ETF’s Price:Volume Sentiment Over The Past 2-3 Years
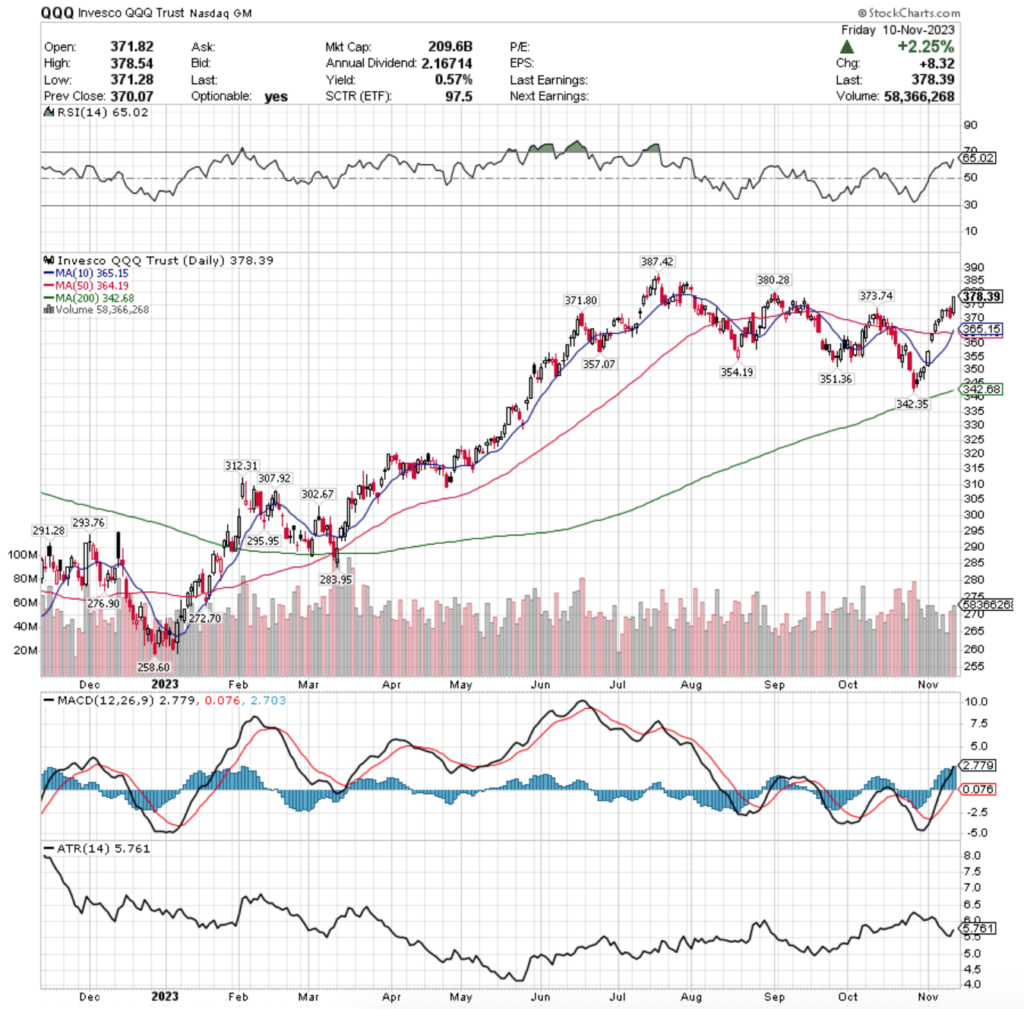
QQQ, the Invesco QQQ Trust ETF advanced +2.49% over the past week, having the strongest performance of the major indexes.
QQQ ETF – Invesco QQQ Trust ETF’s Technical Performance Over The Past Year
Their RSI is also trending towards overbought levels & sits at 65.02, with a MACD that is also signaling exhaustion & beginning to curl over bearishly, much like SPY.
Volumes were -10.83% below average compared to the year prior (47,491,740 vs. 53,261,799), which is troubling as Thursday’s declining volume was the second highest volume of the week, as money was taken off of the table following the rangebound trading of the earlier week.
Monday kicked the week off with a spinning top candlestick that was tightly tied to Friday’s candle, with the open occurring in Friday’s upper shadow, some of Friday’s real body being tested throughout the day, but ultimately prices closed higher.
Tuesday saw market participants rush in & push QQQ higher, but Wednesday’s dragonfly doji that fell within Tuesday’s daily range brought the uncertainty back to the fore.
Thursday resulted in a bearish engulfing candle, confirming that the first three bullish days of the week were on shaky grounds & uncertainty & Friday’s session saw advances, likely somewhat caused by the 10 & 50 DMA’s crossing bullishly, but the $380.28/share resistance level is going to be a more important test in the near-term.
Their ATR will be something to watch as the next week removes some of the lower, wider range sessions from the calculation & it will be imperative to factor in how the new sessions that replace them impact the calculation.
Unlike SPY, the strength of the supporting price levels within the next -3-4% leg lower do not get weaker in sentiment as we decline, however they’re not the stablest looking either & will be worth keeping a close look on, as 4 of the next 5 lower price zones are dominated by sellers & at more heavy ratios than the buyer dominated zones (except for the $360-363.99 zone).
There is a strong buyer sentiment ~9-10% below the current price though, where over the past 1-2 years Buyers have eclipsed sellers at a rate of 3.28:1.
QQQ has support at the $373.74 (Volume Sentiment: Buyers, 1.06:1), $371.80 (Volume Sentiment: Buyers, 1.24:1), $364.19 (50-Day Moving Average; Volume Sentiment: Buyers, 1.29:1) & $365.15/share price level (10 Day Moving Average; Volume Sentiment: Buyers, 1.29:1), with resistance at the $380.28 (Volume Sentiment: Buyers, 4.25:1) & $387.42/share price levels (52-Week High; Volume Sentiment: Buyers, 1.4:1).
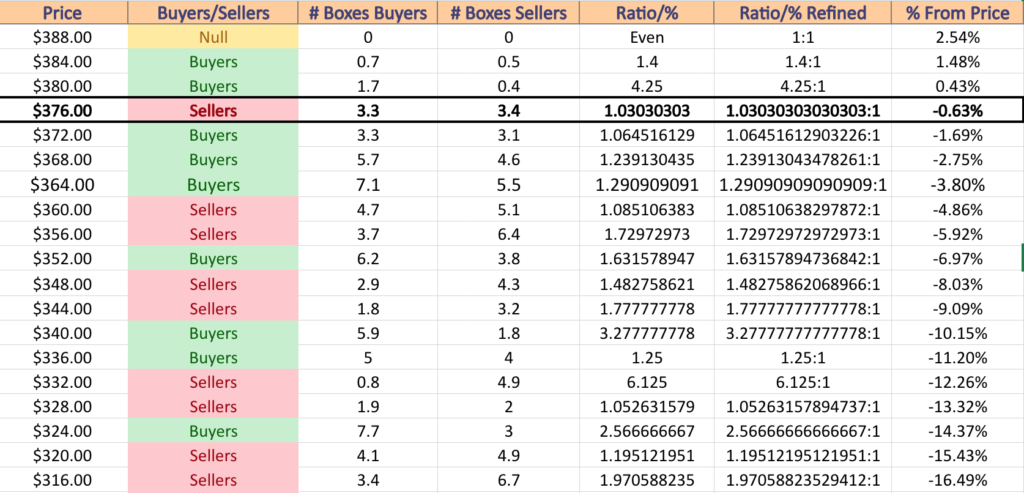
QQQ ETF’s Price:Volume Sentiment Over The Past 1-2 Years
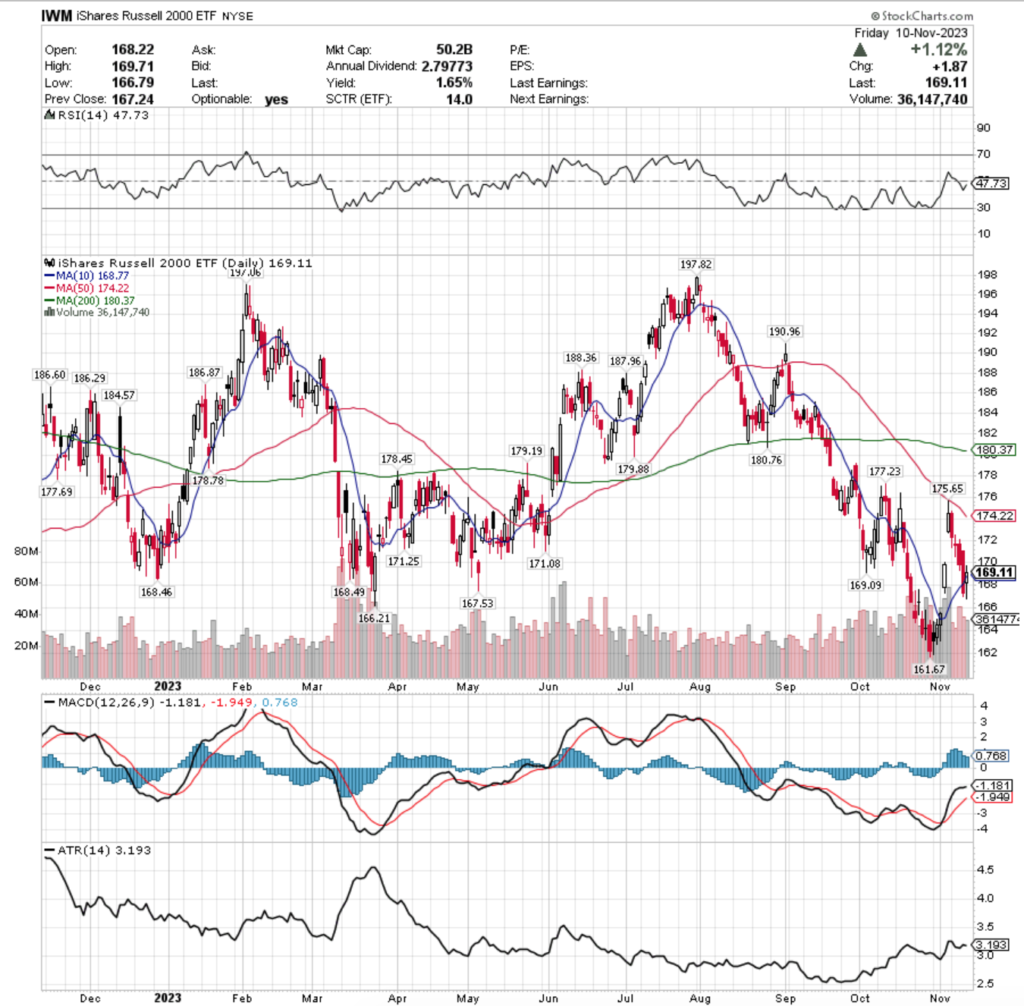
IWM, the iShares Russell 2,000 ETF declined -1.86% over the past week, as investors fled small cap names in favor of larger cap stocks & the tech-heavy NASDAQ.
IWM ETF – iShares Russell 2,000 ETF’s Technical Performance Over The Past Year
Their RSI is trending back towards neutral & currently sits at 47.73, while their MACD is looking flat (but still bullish, currently) & set to cross bearish any day now.
Volumes were +28% above average last week compared to the year prior (37,220,120 vs. 29,079,302), which is cause for concern given that the week had 4 declining sessions, two of which were higher volume than Friday’s advancing session.
After last Friday’s session was unable to break the resistance of the 50 day moving average, Monday continued the decline with a wide daily range session, followed by a doji on Tuesday that carried the declines further.
Despite the uncertainty of the doji, Wednesday continued lower to begin testing the $169.09 support level, which was broken on Thursday’s wide range day, but Friday’s session was able to bring the price level back above the $169.09 & 10 DMA support levels.
The volume for Friday was not convincing in terms of being indicative of a reversal in price though & the fact that most of the past few weeks’ highest advancing volumes occurred on gap days that left wide price windows with limited support around is cause for concern.
Their Average True Range is hinting that they may continue to slowly decline/consolidate in the near-term, as they try to break above the 10 DMA’s resistance level (currently it’s a support level, but would not remain one for long after a slight downwards move).
Their price:volume sentiment is also concerning, as while they are near their 52-week low & lack much support here (which will make the numbers appear more seller oriented), the two seller zones beneath the current price level contain some of the heaviest ratio’d levels on their past 1-2 year chart.
IWM has support at the $169.09 (Volume Sentiment: Sellers, 3.5:1), $168.77 (10 Day Moving Average; Volume Sentiment: Sellers, 3.5:1), $168.49 (Volume Sentiment: Sellers, 3.5:1) & $168.46/share price level (Volume Sentiment: Sellers, 3.5:1), with resistance at the $171.08 (Volume Sentiment: Sellers, 1.88:1), $171.25 (Volume Sentiment: Sellers, 1.88:1), $174.22 (50 Day Moving Average; Volume Sentiment: Buyers, 1.08:1) & $175.65/share price levels (Volume Sentiment: Buyers, 1.08:1).
IWM ETF’s Price:Volume Sentiment Over The Past 1-2 Years
DIA ETF – SPDR Dow Jones Industrial Average ETF’s Technical Performance Over The Past Year
Their RSI is trending towards overbought levels & currently sits at 61.4, while their MACD is beginning to curl over bearishly & will be something to keep an eye on over the coming week.
Volumes declined -12.24% last week compared to the year prior’s average (3,111,380 vs. 3,545,435), signaling a lack of enthusiasm & that market participants are more eager to “wait & see” what happens next, rather than deploy capital.
Monday kicked the week off on an uncertain note, as the session resulted in a doji that inched higher above Friday’s previous close.
Tuesday we saw a further advance, but Wednesday’s declining session signaled trouble on the horizon & was followed by a wide range declining session Thursday, which was near the volume levels of Monday’s advancing session, which hints that the resilient DJIA may finally be losing its luster to market participants, despite having been a haven for many months.
Friday’s session added a new support level for this week, but looking at their ATR it appears that there may be some congestion around the price levels where their 10, 50 & 200 day moving averages sit currently in the event of a consolidation.
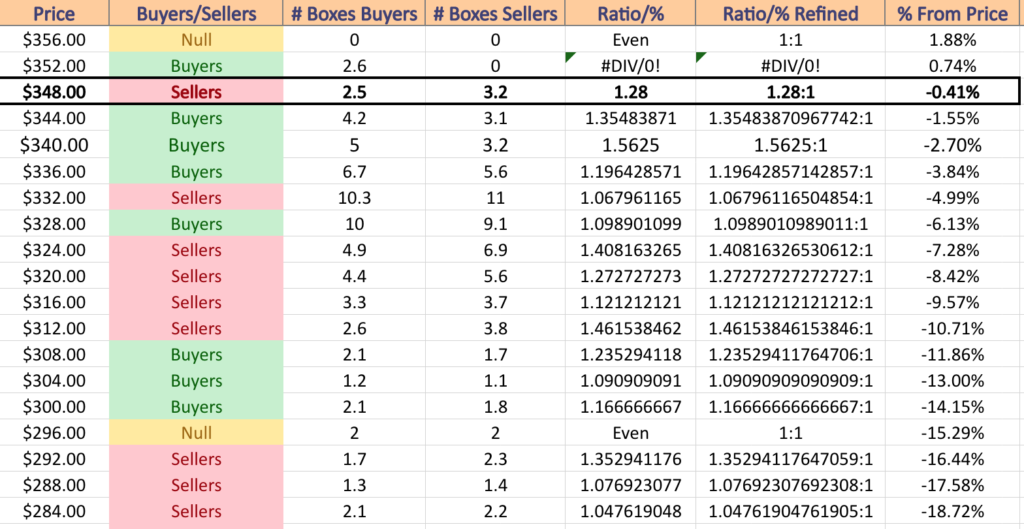
DIA’s price:volume sentiment from the past 3-4 years is another key area to be watching, particularly if they do begin to test the downside.
They currently have close by support levels in buyer dominated zones, however the sellers occupy 5 of the next 7 price zones, signaling that the rug may be easily pulled out from under DIA.
DIA has support at the $342.07 (Volume Sentiment: Buyers, 1.56:1), $341.33 (Volume Sentiment: Buyers, 1.56:1), $340.64 (Volume Sentiment: Buyers, 1.56:1) & $339.26/share price level (Volume Sentiment: Buyers, 1.2:1), with resistance at the $343.85 (Volume Sentiment: Buyers, 1.56:1), $350.16 (Volume Sentiment: Sellers, 1.28:1) & $355.03/share price levels (52-Week High; Volume Sentiment: Buyers, 2.6:0*).
DIA ETF’s Price:Volume Sentiment Over The Past 3-4 Years
Let’s dive into some of the best & worst performing industries & geo-locations in the market!
Japan Small Capped Equities (DXJS), S&P 500 Quality (SPHQ), Latin America 40 (ILF) & Brazil Small Caps (BRF) Are All Bullishly Leading The Market
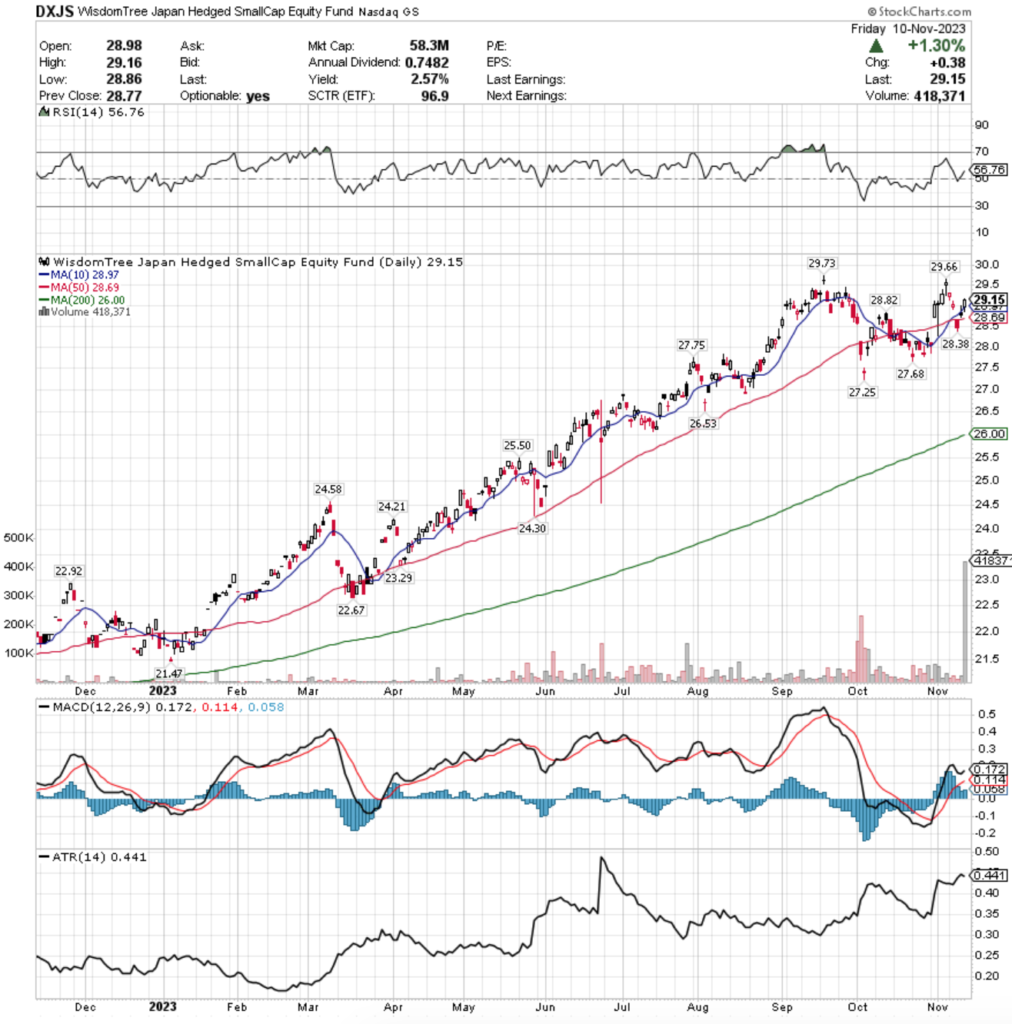
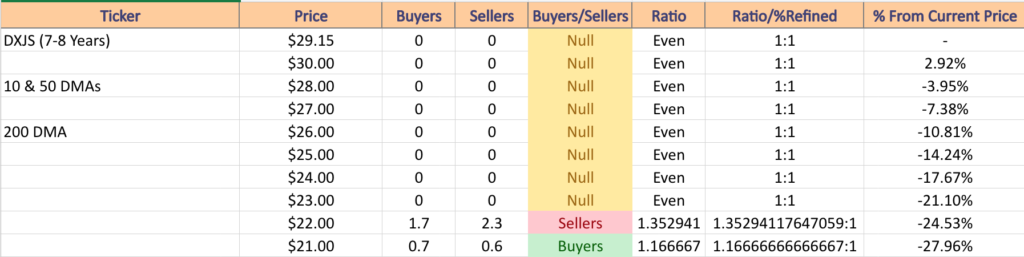
DXJS ETF – WisdomTree Japan Hedged Small Cap Equity Fund ETF’s Technical Performance Over The Past Year
Their RSI is on the overbought end of the neutral range, sitting at 56.76, while their MACD remains bullish, but is beginning to flatten out & flash signals of a cool down period in the near-term, while prices remain just below their 52-week high.
Volumes were +396.24% above average last week compared to the year prior (97,540 vs. 19,655.78), almost entirely due to Friday’s session which eclipsed the volume levels of the previous year.
Monday kicked off with a declining hammer candle that continued lower on Tuesday, whose session resulted in a spinning top & a gap down, signaling uncertainty among market participants, with strong bearish sentiment in the air.
Wednesday is where things get particularly interesting though, as the day opened on a gap down that was not supported by the 10 & 50 day moving averages, tested lower, but resulted in a hammer candle on weak volume compared to the rest of the week, which indicates that the hammer signal may not be that strong.
Thursday’s spinning top advanced higher, however t remained contained by the 10 DMA’s resistance, and Friday’s session was able to break above the 10 DMA & close above it on strong volume, but I would be watching for profit taking in the coming few days.
While DXJS offers a 2.57% distribution yield for long-term holders, it would be wise to begin thinking of taking some profits or looking into a hedging strategy for existing positions, particularly as it appears less & less likely that they have the support from their moving averages to take another run at the 52-week high & their ATR suggests that a consolidation is on the horizon.
DXJS has support at the $28.97 (10 Day Moving Average; Volume Sentiment: NULL, 0:0*), $28.82 (Volume Sentiment: NULL, 0:0*), $28.69 (50 Day Moving Average; Volume Sentiment: NULL, 0:0*) & $28.38/share price level (Volume Sentiment: NULL, 0:0*), with resistance at the $29.66 (Volume Sentiment: NULL, 0:0*) & $29.73/share price levels (52-Week High;Volume Sentiment: NULL, 0:0*).
DXJS ETF’s Price:Volume Sentiment Over The Past 7-8 Years
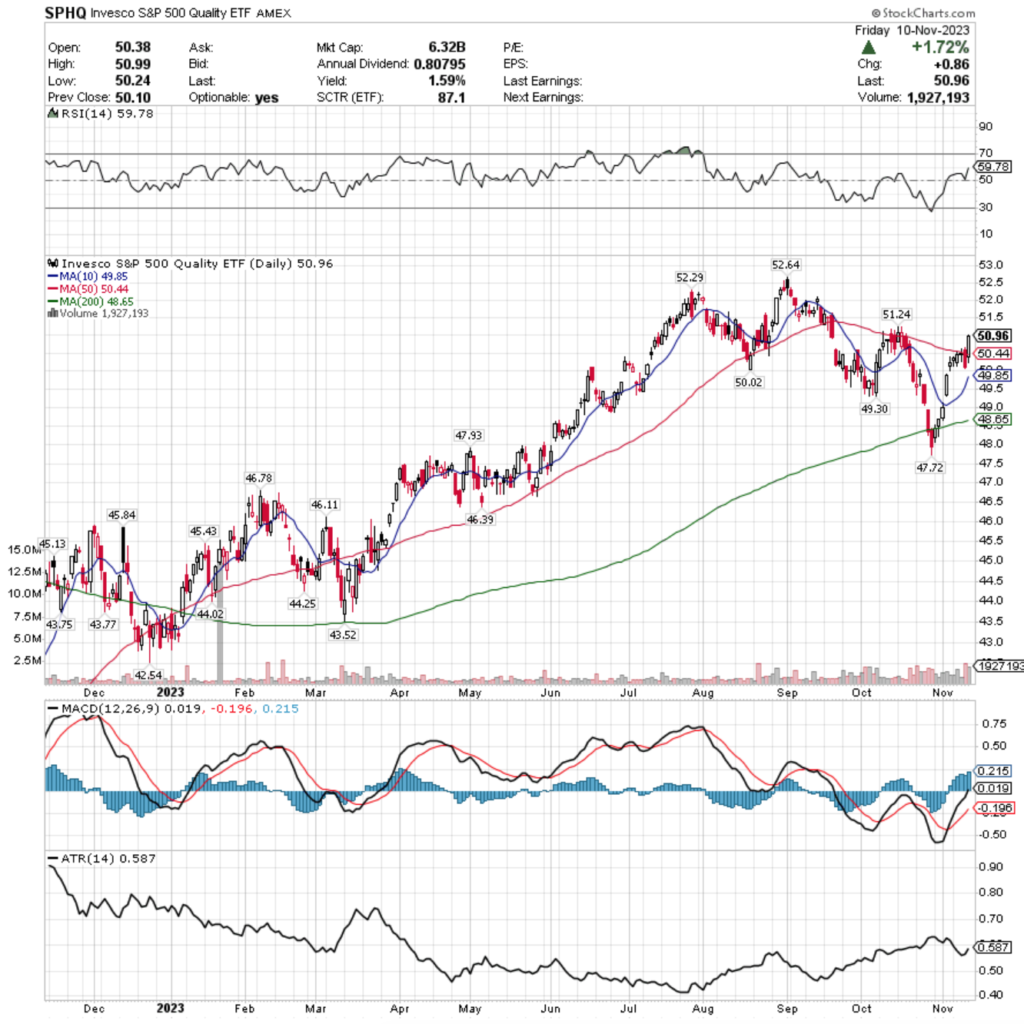
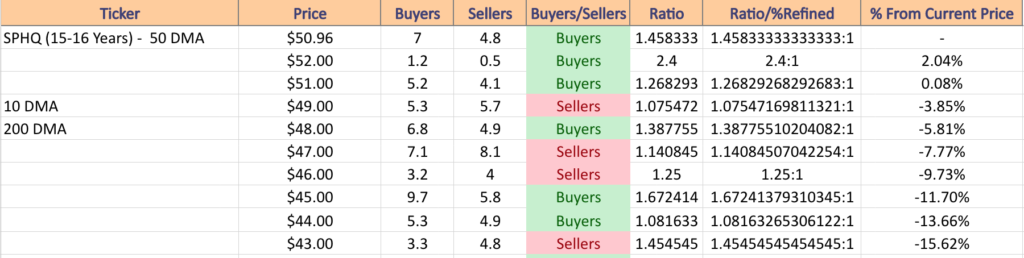
SPHQ, the Invesco S&P 500 Quality ETF has climbed +14.04% over the past year, adding +18.4% since their 52-week low in December of 2022 (ex-distributions).
SPHQ ETF – Invesco S&P 500 Quality ETF’s Technical Performance Over The Past Year
Their RSI is trending towards overbought & currently sits at 59.78, while their MACD remains bullish, but is beginning to look overextended & like it may be time for a near-term consolidation.
Volumes were +110.28% above average last week compared to the year prior (1,501,160 vs. 713,870.92), which is interesting as the highest volume session was on Thursday, a declining day where market participants were taking their profits & mitigating risk.
Monday kicked off with an slightly advancing day but signaled indecision based on the spinning top candlestick.
Tuesday there was a glimmer of hope with a bearish engulfing candlestick, but Wednesday’s doji session was unable to close above the 50 day moving average.
Thursday was a wide range declining session, which as noted above the day’s volume really reiterated the bearish sentiment as prices dipped below the 50 DMA.
Friday opened below the 50 DMA but broke resistance & climbed higher, but the bullish volume did not manage to come too close to the day prior’s declining volume, which is not a bullish signal.
Unfortunately, SPHQ only offers a 1.59% distribution yield to long-term holders, which does minimal against potential losses in terms of providing a cushion, making it worth examining hedging strategies in the near-term.
Prices appear to be ready to continue descending, unless we see the $51.24/share resistance level broken & upheld as a support level.
Sellers have a lot of power in the near-term support levels historically, which will be something to keep an eye on moving into this week.
SPHQ has support at the $50.44 (50-Day Moving Average; Volume Sentiment: Buyers, 1.46:1), $50.02 (Volume Sentiment: Buyers, 1.46:1), $49.85 (10 Day Moving Average; Volume Sentiment: Sellers, 1.08:1) & $49.30/share price level (Volume Sentiment: Sellers, 1.08:1), with resistance at the $51.24 (Volume Sentiment: Buyers, 1.27:1), $52.29 (Volume Sentiment: Buyers, 2.4:1) & $52.64/share price levels (52-Week High; Volume Sentiment: Buyers, 2.4:1).
SPHQ ETF’s Price:Volume Sentiment Over The Past 15-16 Years
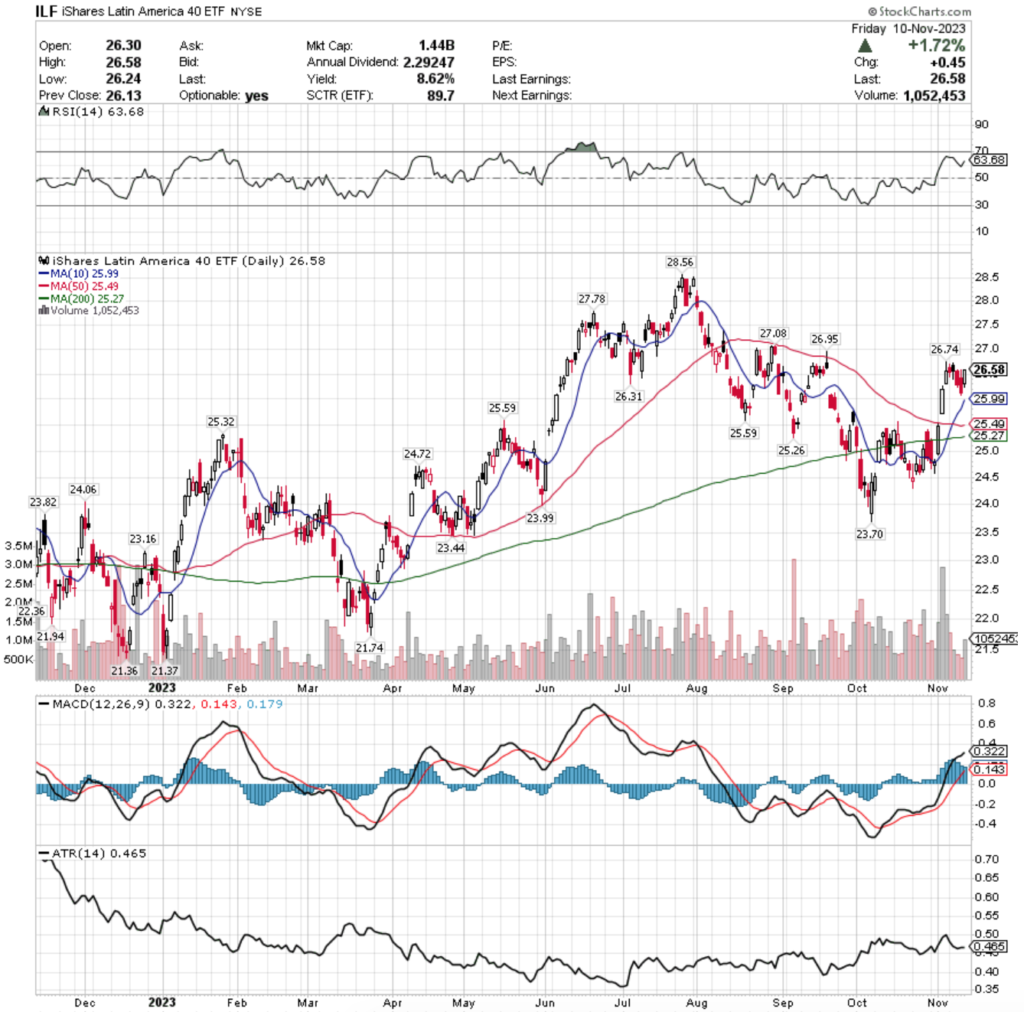
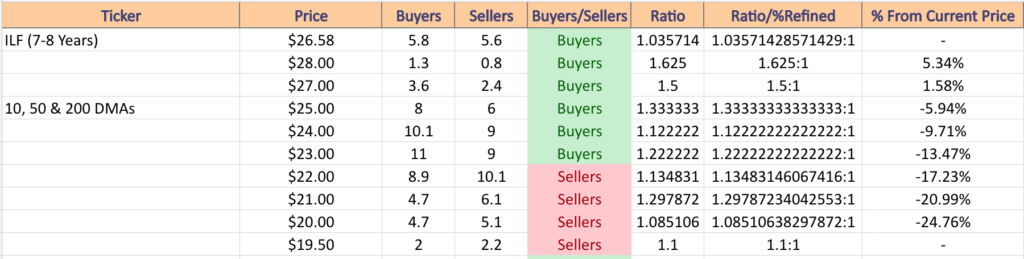
ILF, the iShares Latin America 40 ETF has notched +15.2% over the past year, climbing +22.21% since their 52-week low in December of 2022 (ex-distributions).
ILF ETF – iShares Latin America 40 ETF’s Technical Performance Over The Past Year
Their RSI is trending towards overbought at 63.68, while their MACD remains bullish but has begun to show significant loss of steam & looks ready for a bearish crossover in the near-term.
Volumes were -8.57% below average last week compared to the year prior (851,380 vs. 931,196.41), which was led by Monday’s declining volume being the highest day, which does not have bullish sentiment.
Monday’s session also resulted in a spinning top that closed just below Friday’s bullish close on a session that had a long upper shadow for the candle, which further confirms that there is bearish sentiment in the air now for ILF.
Tuesday tried to become bullish & did advance, but the day closed lower than it opened, setting the stage for Wednesday & Thursday’s declines, with Friday’s session advancing back up to the early-week price range.
Their ATR does not confirm much strength in the existing trend, and while they offer a hefty 8.62% distribution yield, it may be wise to begin thinking of hedging strategies & or taking some profits from existing positions.
Their next support levels are all in buyer dominated price zones, however should they cool down 13% they enter 4 zones that are seller dominated.
ILF has support at the $26.31 (Volume Sentiment: Buyers, 1.04:1), $25.99 (10 Day Moving Average; Volume Sentiment: Buyers, 1.33:1), $25.59 (2 Touch-points; Volume Sentiment: Buyers, 1.33:1) & $25.49/share price level (50 Day Moving Average; Volume Sentiment: Buyers, 1.33:1), with resistance at the $26.74 (Volume Sentiment: Buyers, 1.04:1), $26.95 (Volume Sentiment: Buyers, 1.04:1), $27.08 (Volume Sentiment: Buyers, 1.5:1) & $27.78/share price levels (Volume Sentiment: Buyers, 1.5:1).
ILF ETF’s Price:Volume Sentiment Over The Past 7-8 Years
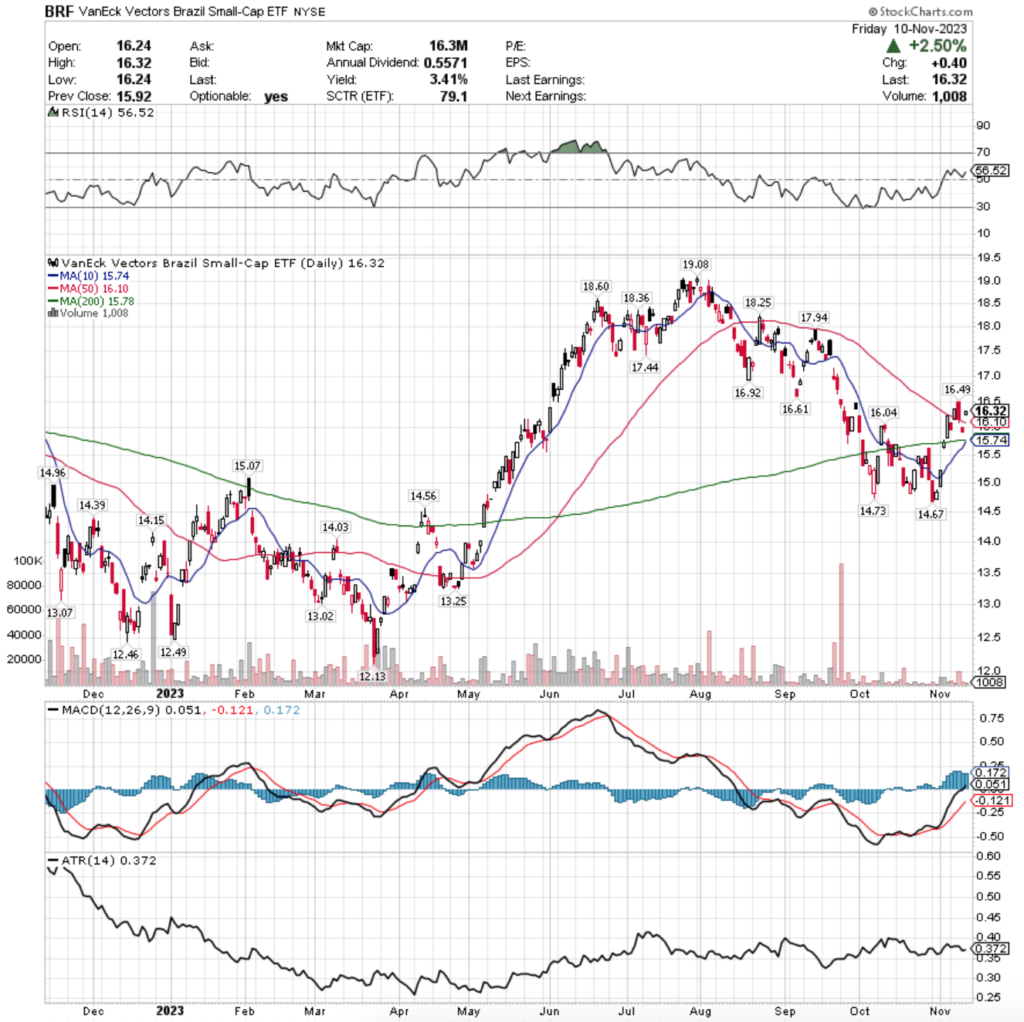
BRF ETF – VanEck Vectors Brazil Small-Cap ETF’s Technical Performance Over The Past Year
Their RSI is trending towards overbought at 56.52, but their MACD is beginning to curl over already & starting to signal that there may be a bearish crossover in the coming week.
Volumes were -57.31% below average last week compared to the year prior (4,780 vs. 11,196.41), as market participants were not exactly eager to move one way or the other last week, which is also not a signal of strength (even aside from the highest volume day being declining volume).
Their price action last week mostly just stuck to around the 50 DMA, with a handful of gaps that have created windows that have limited support around.
Despite their 3.41% distribution yield which may provide some cushion against losses, this is one to be keeping a close eye on in the coming weeks, as there does not appear to be much strength currently.
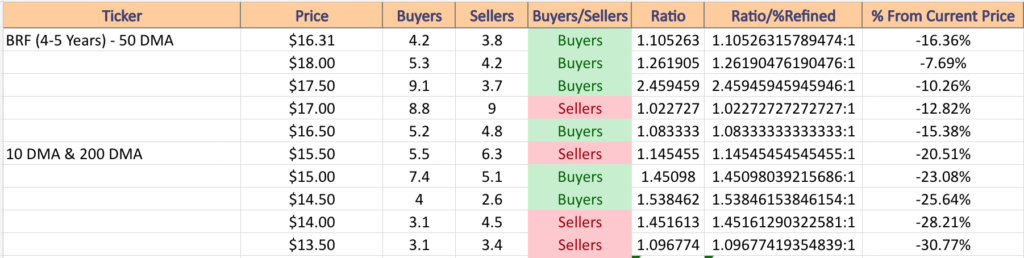
BRF has support at the $16.10 (50 Day Moving Average; Volume Sentiment: Buyers, 1.11:1), $16.04 (Volume Sentiment: Buyers, 1.11:1), $15.78 (200 Day Moving Average; Volume Sentiment: Sellers, 1.15:1) & $15.74/share price level (10 Day Moving Average; Volume Sentiment: Sellers, 1.15:1), with resistance at the $16.49 (Volume Sentiment: Buyers, 1.11:1), $16.61 (Volume Sentiment: Buyers, 1.08:1), $16.92 (Volume Sentiment: Buyers, 1.08:1) & $17.44/share price levels (Volume Sentiment: Sellers, 1.02:1).
BRF ETF’s Technical Performance Over The Past 4-5 Years
Cannabis (THCX), Retail (RETL), Self-Driving EV & Tech (IDRV) & South Korea (KORU) Are All Bearishly Lagging The Market
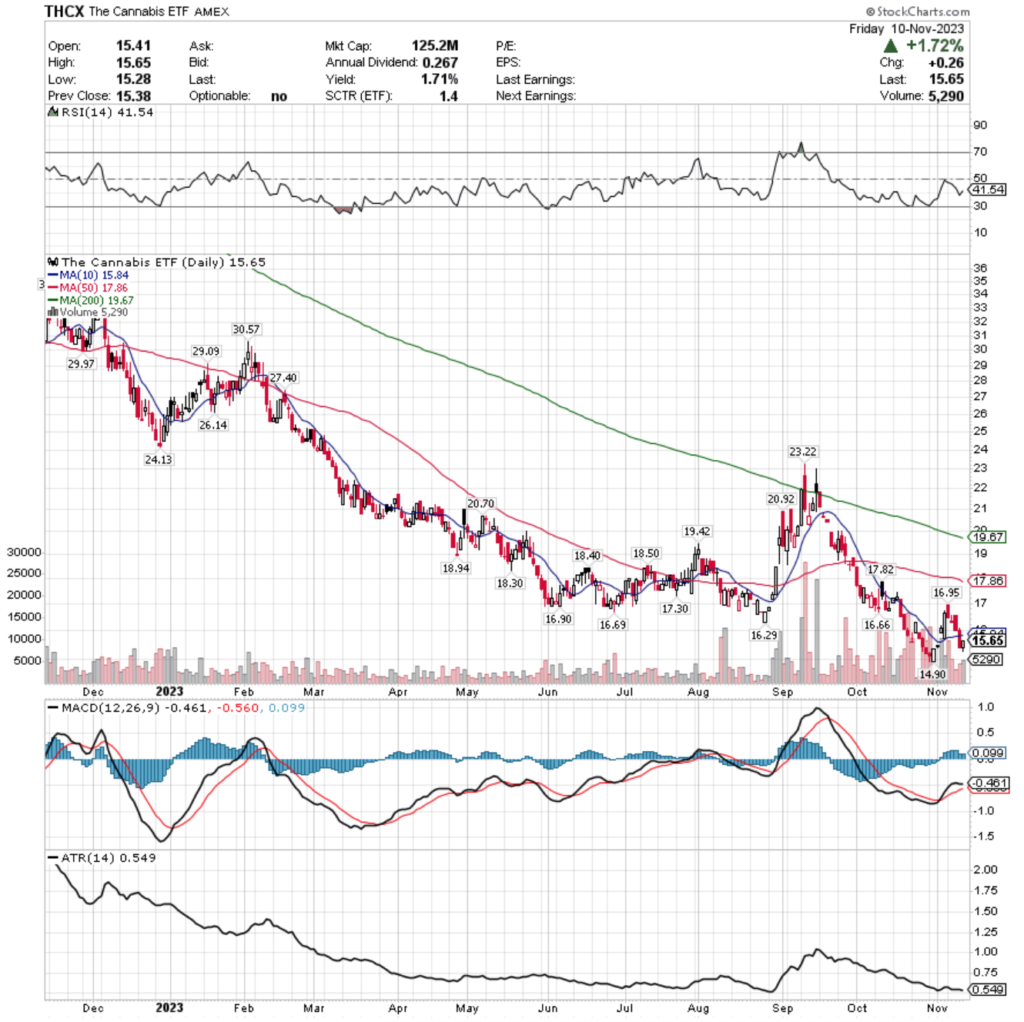
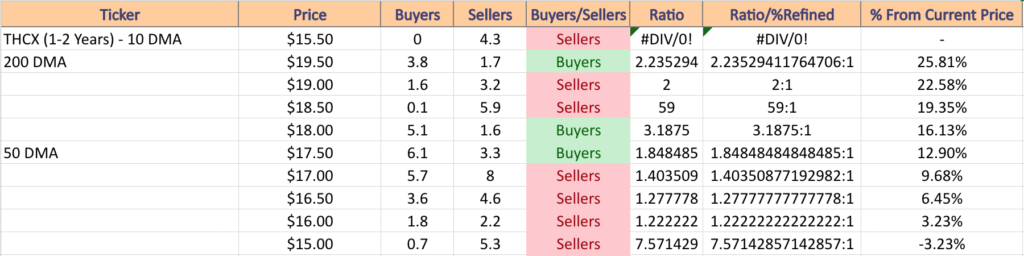
THCX, the Cannabis ETF has declined -52.67% over the past year, falling -56.29% from their 52-week high in December of 2022, while reclaiming +5.02% from their 52-week low in October of 2023 (ex-distributions).
THCX ETF – Cannabis ETF’s Technical Performance Over The Past Year
Their RSI is trending back towards neutral & currently sits at 41.54, while their MACD is about to bearishly crossover during the next session or two.
Volumes were +48.6% above average last week compared to the year prior (5,520 vs. 3,714.66), as market participants were eager to hop out of the pool with some money before they potentially retest their 52-week low in the coming weeks.
Investors would be wise to keep an eye on the 10 DMA & how it acts as resistance & pushes the price back towards the 52-week low, as there is limited support of any kind right now for THCX.
Once they are able to reverse course, it will be imperative to see how the 10 DMA functions as support, but that likely will not be for some time.
While they offer a 1.71% distribution yield, that isn’t enough cushion to take risks with something so close to their 52-week low & with limited enthusiasm at their last level of support.
THCX has support at the $14.90/share price level (52-Week Low; Volume Sentiment: NULL, 0:0*), with resistance at the $15.84 (10 Day Moving Average; Volume Sentiment: Sellers, 4.3:0*), $16.29 (Volume Sentiment: Sellers, 1.22:1), $16.66 (Volume Sentiment: Sellers, 1.28:1) & $16.69/share price levels (Volume Sentiment: Sellers, 1.28:1).
THCX ETF’s Price:Volume Sentiment Over The Past 1-2 Years
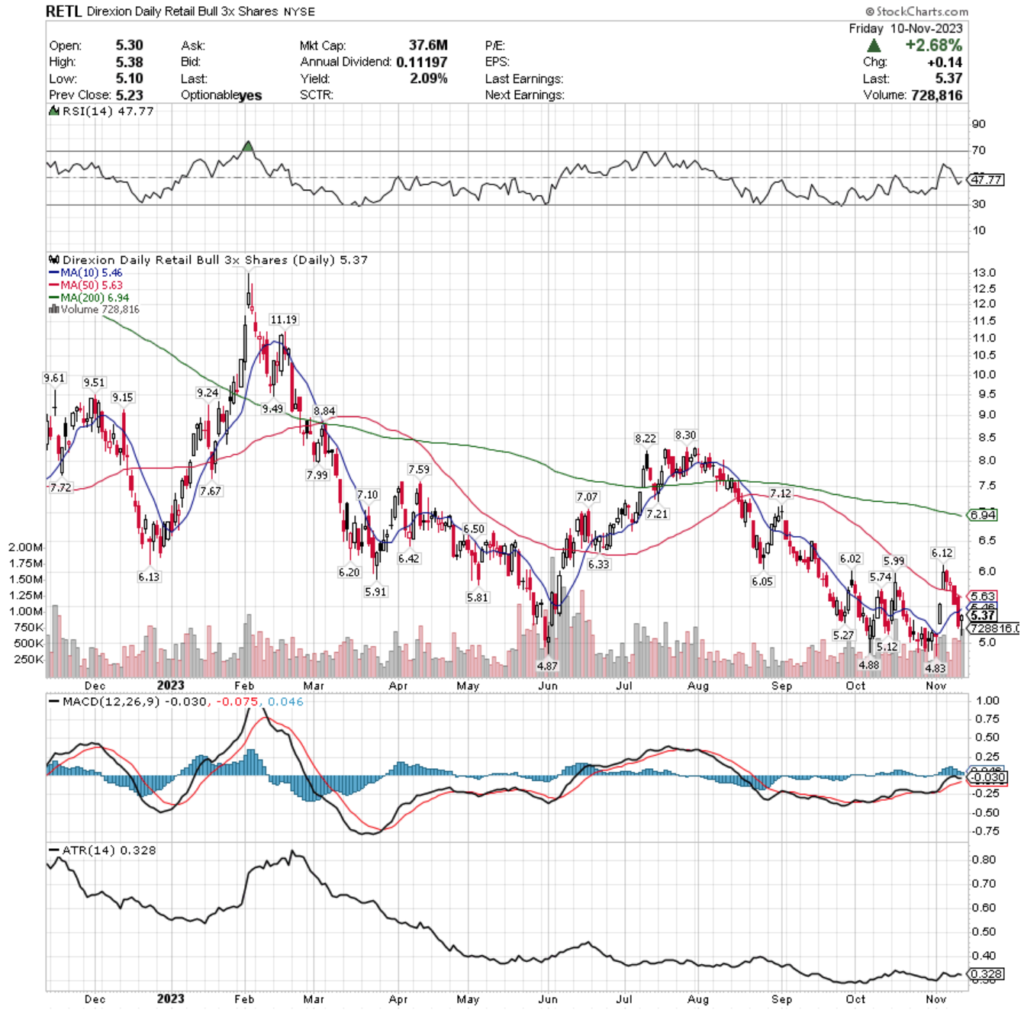
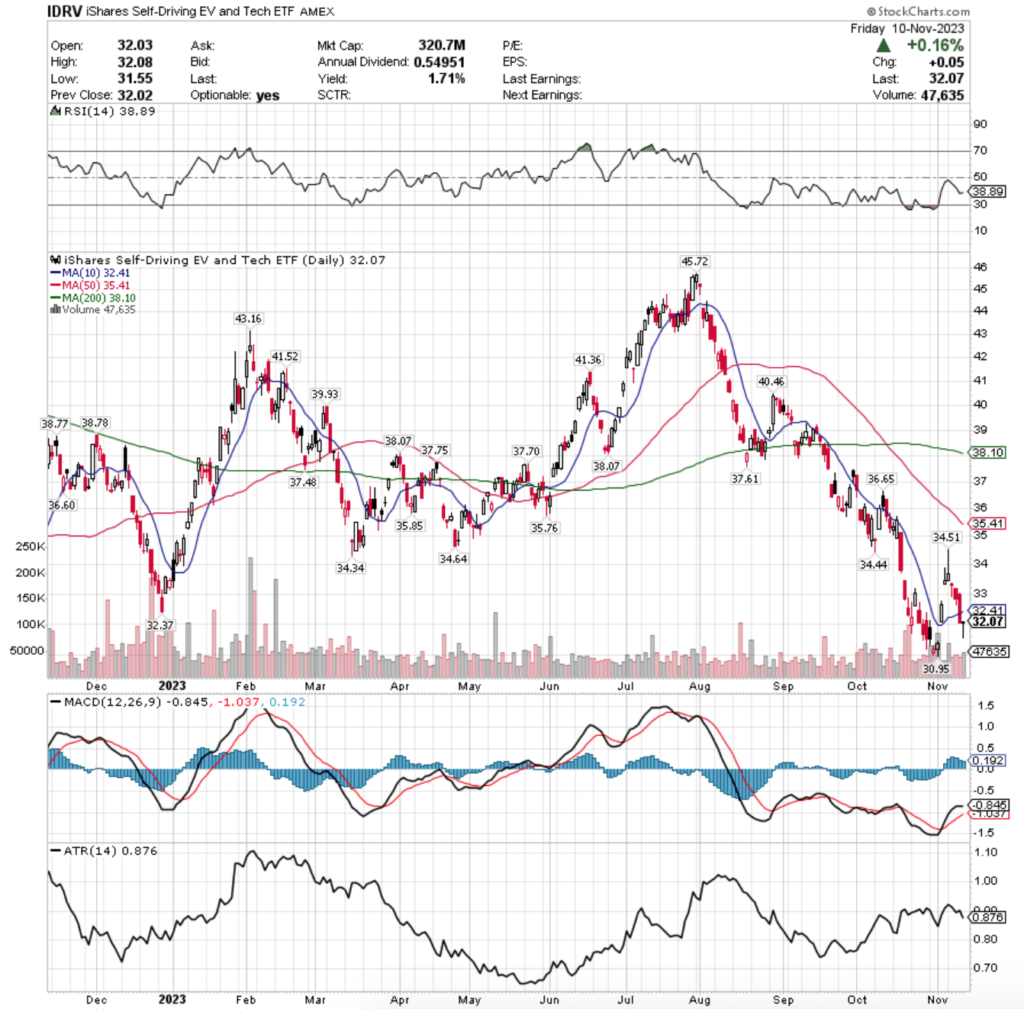
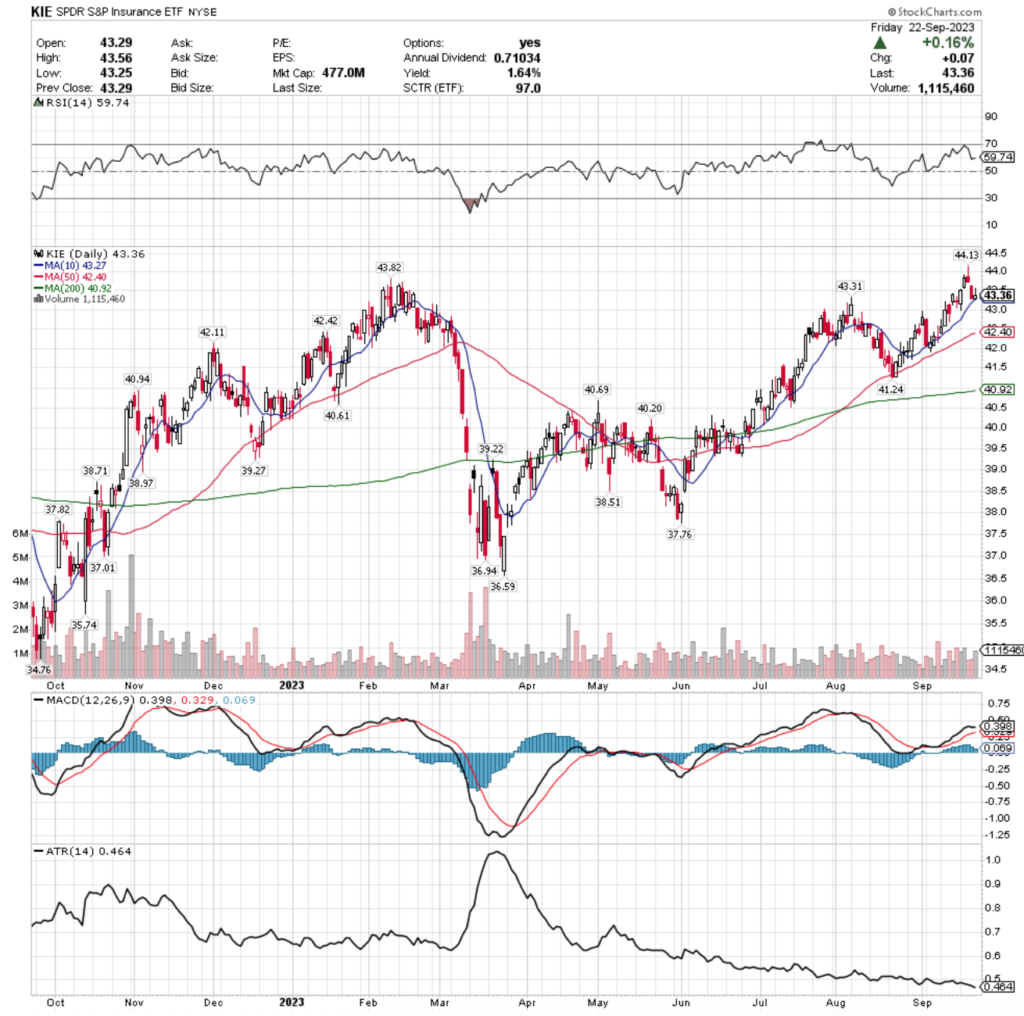
RETL, the Direxion Daily Retail Bull 3x Shares ETF has fallen -39.49% over the past year, losing -59.29% since their 52-week high in February of 2023, while reclaiming +11.18% since their 52-week low in November of 2023 (ex-distributions).
RETL ETF – Direxion Daily Retail Bull 3x Shares ETF’s Technical Performance Over The Past Year
Their RSI is around neutral at 47.77, while their MACD is signaling a bearish crossover will take place by mid-week.
Volumes were +11.98% above average last week compared to the year prior (505,440 vs. 451,369.72), as after 4 days of profit taking, Friday’s session managed to close on decent advancing volume.
While it was advancing volume & the highest volume day of the week, it is not an invitation to turn bullish just yet.
Investors will need to keep an eye on how the 10 & 50 DMAs function as resistance in the coming week, while also noting how the window that Friday’s session’s lower shadow tested holds up or gets filled.
RETL does have some support in the consolidation zone below their current price that was established in September/October, but a cool off from November’s early pop days that resulted in gap ups appears near.
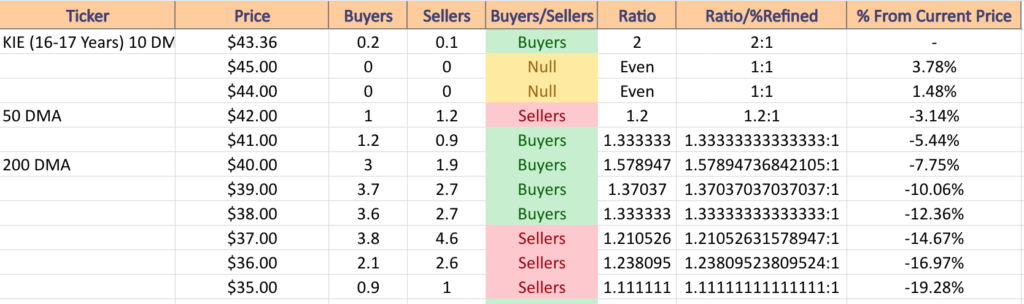
Being so close to the 52-week low & only offering a 2.09% distribution yield makes it risky to begin looking at RETL just yet & it would be wisest to wait & see how the floor beneath them holds up before experimenting with a new position, especially given that they’re in the lowest price zone with sentiment that favors Sellers 1.96:1 from the past 1-2 years.
RETL has support at the $5.27 (Volume Sentiment: Sellers, 1.96:1), $5.12 (Volume Sentiment: Sellers, 1.96:1), $4.88 (Volume Sentiment: NULL; 0:0*) & $4.87/share price level (Volume Sentiment: NULL; 0:0*), with resistance at the $5.46 (10 Day Moving Average; Volume Sentiment: Sellers, 1.96:1), $5.63 (50 Day Moving Average; Volume Sentiment: Sellers, 1.96:1), $5.74 (Volume Sentiment: Sellers, 1.96:1) & $5.81/share price levels (Volume Sentiment: Sellers, 1.96:1).
RETL ETF’s Price:Volume Sentiment Over The Past 1-2 Years
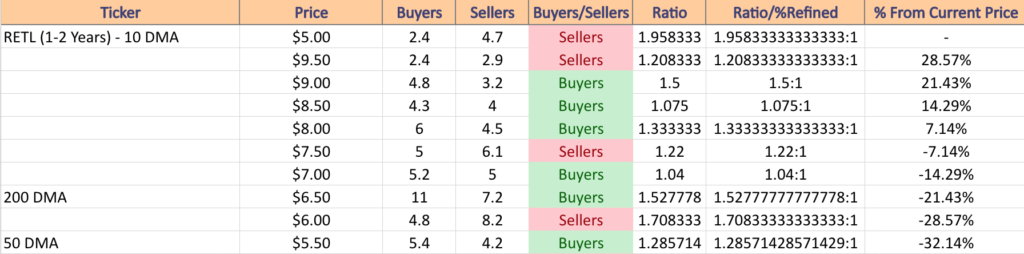
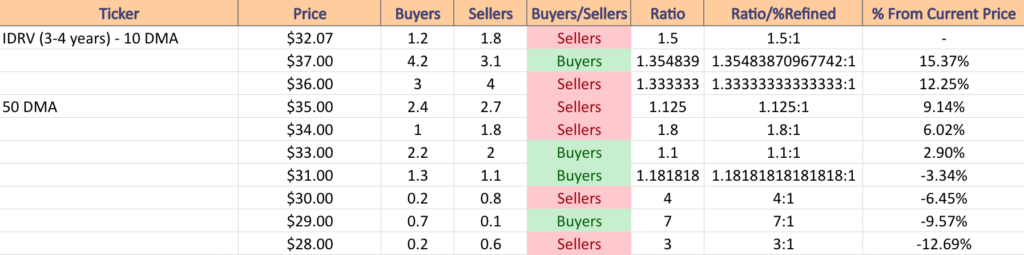
IDRV, the iShares Self-Driving EV & Tech ETF has lost -16.5% over the past year, declining -29.86% since their 52-week high in July of 2023, and has advanced +3.62% since their 52-week low in November of 2023 (ex-distributions).
IDRV ETF – iShares Self-Driving EV & Tech ETF’s Technical Performance Over The Past Year
Their RSI is trending towards oversold & currently sits at 38.89, while their MACD is currently bullish, but flat, and will likely see a bearish crossover in the near-term, unless Friday’s dragonfly doji is able to actually spur a reversal.
Volumes last week were -0.29% below average compared to the year prior (47,000 vs. 47,134.66), showing that investors were indeed eager to take money off of the table following the gaps up of last Thursday & Friday’s sessions.
Given their proximity to their 52-week low & their modest 1.71% distribution yield, all eyes should be on the 10 DMA & their 52-week low as we enter the next few weeks before any positions are taken, especially given that this current price zone they are in is historically favoring the Sellers, 4:1.
While the $29-29.99 zone is heavily buyer favored (7:1), it would be wise to keep a close eye on your charts, as if that doesn’t hold up the next zone is dominated by sellers 3:1, which may signal a consolidation zone in the $29-29.99 range that appears down the line.
IDRV has support at the $30.95/share price level (52-Week Low; Volume Sentiment: Sellers, 4:1), with resistance at the $32.37 (Volume Sentiment: Sellers, 1.5:1), $32.41 (10 Day Moving Average; Volume Sentiment: Sellers, 1.4:1), $34.34 (Volume Sentiment: Sellers, 1.8:1) & $34.44/share price levels (Volume Sentiment: Sellers, 1.8:1).
IDRV ETF’s Price:Volume Sentiment Over The Past 3-4 Years
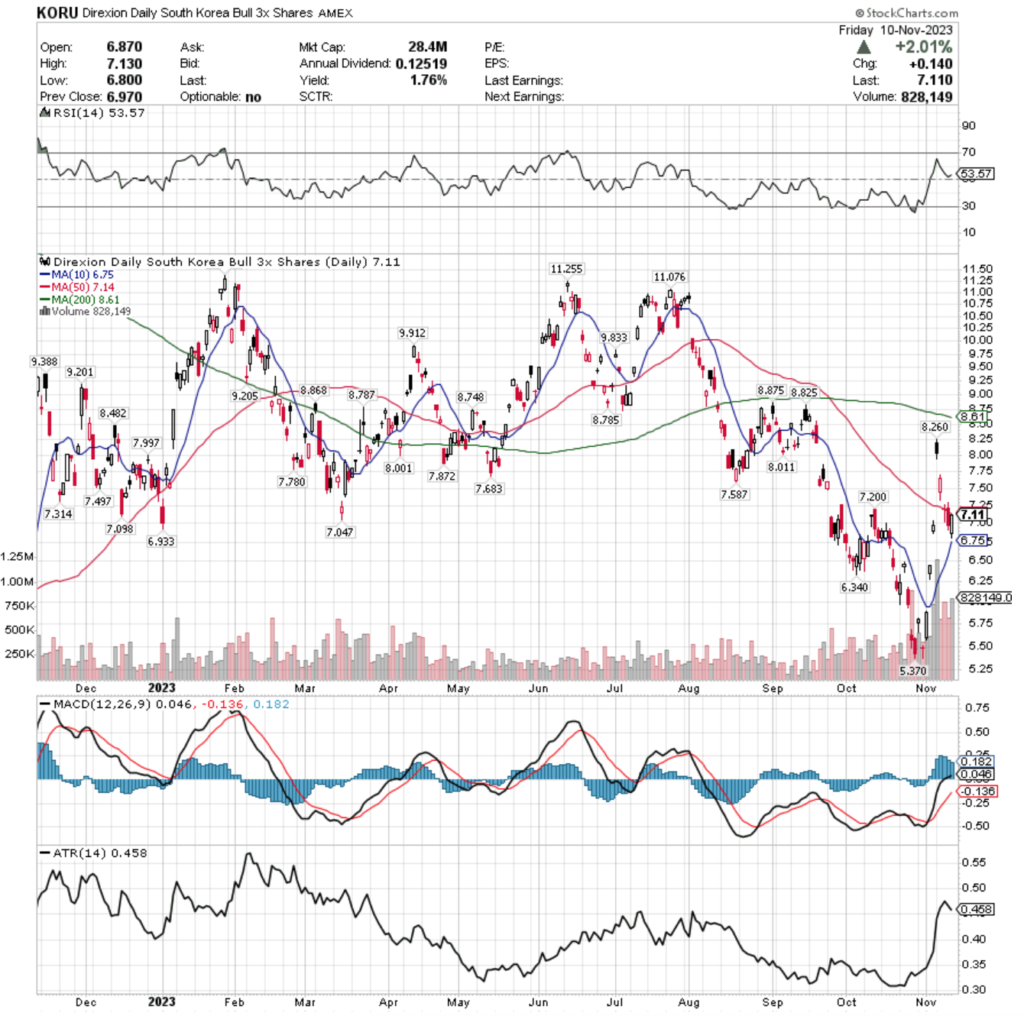
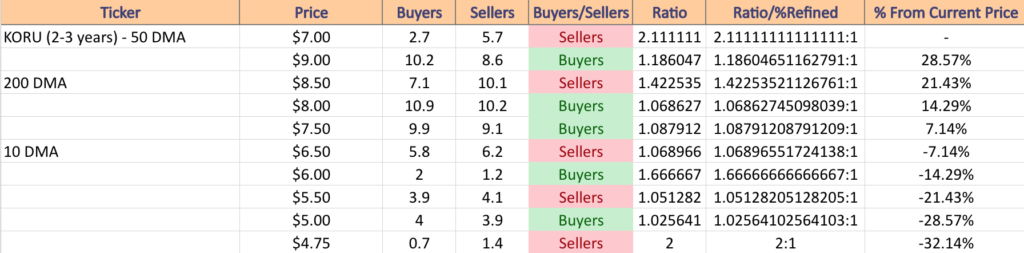
KORU, the Direxion Daily South Korea Bull 3x Shares ETF has fallen -23.63% over the past year, declining -38.07% since their 52-week high in January of 2023, while gaining +32.4% since their 52-week low in October of 2023 (ex-distributions).
KORU ETF – Direxion Daily South Korea Bull 3x Shares ETF’s Technical Performance Over The Past Year
Their RSI is just above the neutral level of 50 & sits at 53.57, while their MACD looks set to bearishly crossover by the end of the week, unless they are able to consolidate further into the range that they tried to establish towards the end of last week.
Volumes were +214.49% above average last week vs. the year prior’s average (818,960 vs. 260,410.36), which should be viewed with caution, given that the highest volume day was Monday’s astronomical gap up session, which quickly deflated throughout the rest of the week.
Tuesday & Wednesday’s gap downs paired with the dragonfly doji of Wednesday signaled that there is still a lot of uncertainty in the air & the 50 day moving average has provided adequate strength as a resistance level recently.
Friday’s session tried to advance, however the 50 DMA turned it down, which will lead to an interesting week as the 10 DMA is moving towards the lower end of Friday’s candle to act as support.
Their 1.76% distribution yield is not much cushion for entering a new position now, and volume sentiments should be watched closely as they interact with support & resistance levels in the coming week, as there could be more volatility in store.
KORU has support at the $7.09-7.10 (Volume Sentiment: Sellers, 2.11:1), $7.05 (Volume Sentiment: Sellers, 2.11:1), $6.93 (Volume Sentiment: Sellers, 1.07:1) & $6.75/share price level (10 Day Moving Average; Volume Sentiment: Sellers, 1.07:1), with resistance at the $7.14 (50 Day Moving Average; Volume Sentiment: Sellers, 2.11:1), $7.20 (Volume Sentiment: Sellers, 2.11:1), $7.31 (Volume Sentiment: Sellers, 2.11:1) & $7.50/share price levels (Volume Sentiment: Buyers, 1.09:1).
KORU ETF’s Price:Volume Sentiment Over The Past 2-3 Years
The Week Ahead
The week ahead kicks off with Fed Governor Lisa Cook speaking at 8:50 am, followed by Monthly U.S. Federal Budget data at 2 pm.
Monday’s earnings reports include AECOM, Fortrea, Genius Sports, Harrow, Henry Schein, Monday.com, The Beauty Health Company, Sun Life, Tower Semiconductor & Tyson Foods.
Tuesday gets busier, with New York Fed President John Williams speaking at 3 am, Fed Vice Chair Philip Jefferson speaking at 5:30 am, NFIB Optimism Index reported at 6 am, Consumer Price Index, Core CPI, CPI Year-Over-Year & Core CPI Year-Over-Year reported at 8:30 am, Fed Vice Chair For Supervision Michael Barr testifying to s Senate panel at 10 am & Chicago Fed President Austan Goolsbee speaking at 12:45 pm.
Home Depot, Alcon, Aramark, CAE, Canadian Solar, Energizer, HUYA, IHS Holding Limited, Oaktree Specialty Lending, On, Paysafe, Sally Beauty, Sea Ltd., Tencent Music, Varex Imaging, Vipshop & WalkMe are all due to report earnings on Tuesday.
8:30 am Wednesday is packed with data, including the Producer Price Index, Core PPI, PPI Y-o-Y, Core PPI Y-o-Y, U.S. Retail Sales, Retail Sales minus Autos & Empire State Manufacturing Survey data, followed by New York Fed President John Williams Speaking at 9:25 am, Business Inventories data released & Michael Barr testifying before a House panel at 10 am & Richmond Fed President Tom Barkin speaking at 3:30 pm.
Thursday kicks off with Fed Vice Chair for Supervision Michael Barr speaking at 7:10 am, Initial Jobless Claims, Import Price Index, Import Price Index Minus Fuel, Philadelphia Fed Manufacturing Survey data & Cleveland Fed President Loretta Mester speaking at 8:30 am, Industrial Production & Capacity Utilization reports at 9:15 am, NY Fed President John Williams speaking at 9:25 am, Home Builders Confidence Index data at 10 am, Fed Governor Waller speaking at 10:30, Michael Barr speaking again at 10:35 am & Fed Governor Lisa Cook speaking at 12pm.
Walmart, Alibaba Group Holding, Applied Materials, Bath & Body Works, Beazer Homes, Berry Global, Borr Drilling, Brady, BrightView, Dolby Labs, Dole, Gap, Macy’s, Post, Ross Stores, Shoe Carnival, Stratasys, UGI Corp, Warner Music Group & ZTO Express report earnings on Thursday.
Housing Starts & Building Permits data is released Friday at 8:30 am, followed by Boston Fed President Susan Collins speaking at 8:45 am, Michael Barr & Chicago Fed President Goolsbee speaking at 9:45 am & San Francisco Fed President Daly speaking at 10 am.
Friday we get earnings reports from BJ’s Wholesale, Buckle, Spectrum Brands & Twist Bioscience.
See you back here next week!
*** I DO NOT OWN SHARES OR OPTIONS CONTRACT POSITIONS IN SPY, QQQ, IWM, DIA, DXJS, SPHQ, ILF, BRF, THCX, RETL, IDRV or KORU AT THE TIME OF PUBLISHING THIS ARTICLE ***
Last week indexes all began to show weakness, as volumes told the tale that investors & market participants are beginning to become fearful & head towards the exits.
At times like these it is important to have an understanding of how market participants have behaved at similar price levels in recent history, as we have posted on here before in prior price:volume sentiment analyses.
This document will provide a brief overview of current technical conditions for the S&P 500 (SPY), NASDAQ (QQQ), Russell 2000 (IWM) & Dow Jones Industrial Average (DIA), and provide a list of their historic volume sentiments at each price level that they’ve traded at in the past few years.
The first image of the price:volume sentiment images will contain their support & resistance levels over the past year & how the price:volume sentiment stands at each, followed by a broader list of price levels & their respective sentiments.
Below those items will also be a text version of the list, where the moving averages & current price levels will be annotated, and any support/resistance levels will be in BOLD text.
This will be in place of my usual weekend post.
Technical Analysis & Price:Volume Sentiment For SPY (S&P 500)
SPY, the SPDR S&P 500 ETF, declined -2.39% over the past week, as the cracks we’ve been seeing over the past couple of months finally began to give way & are set to retest the $420.18/share support set in early October.
SPY ETF – SPDR S&P 500 ETF’s Technical Performance Over The Past Year
Their RSI is currently bounding towards the oversold mark of 30 & sits at 35.45, while their MACD has just bearishly crossed over, signaling more near-term declines are on the horizon.
Most alarming for SPY was that their volume last week was +17.33% above average compared to the year prior (97,438,267 vs. 83,046,224), as bearish sentiment has begun to take over just as the share price tests the support of the 200 Day Moving Average.
Monday the week kicked off on a slightly bullish note, however the session’s high was nowhere near testing the resistance of the 50 day moving average & the volume was very weak, which is troubling for the only bullish day on a very bearish week.
Tuesday resulted in a decline that did test the 50 DMA, but that ultimately also tested the support of the 10 day moving average & the candles real body wound up being wedged between the two moving averages, again on similarly light volume to Monday, which was a bad omen.
Wednesday we got the confirmation that things had taken a turn for the worst, with a bearish session that neither tested the 50 DMA again, nor that could stay above the 10 DMA’s support level, as the 10 DMA ended up being halfway through the wide-range candle’s real body by the close.
Thursday briefly attempted to test the 10 DMA’s resistance, but the open & closing price action on the candle tell the whole story, market participants were not interested in price levels being that high, which lead to Friday’s bearish session that closed hovering just above the 200 DMA’s support.
SPY’s Average True Range signals that there will be more volatility in the near-term, with a slight chance of a brief consolidation for a day or two this week, only if the 200 DMA support level holds up.
If it fails to, it will be imperative to understand how prior trading took place at each price level, so that market participants can gauge what sentiment may be like at the support levels it tests in the coming weeks.
SPY’s $416/share block is currently Buyer dominated over the past 2-3 years 2.24:1, but there is plenty of seller sentiment mixed into the price blocks down -8.83% from their current share price, before it becomes a steep slope of sellers until a ~13-14% decline from their current price has occurred.
SPY ETF’s Price:Volume Sentiments From The Past 2-3 Years On Their Past Year Support & Resistance Levels
SPY ETF’s Price:Volume Sentiment Over The Past 2-3 Years
SPY ETF’s Price:Volume Sentiment Over The Past 2-3 Years
SPY ETF’s Price:Volume Sentiment Over The Past 2-3 Years
$468 – NULL – 0:0*; +11.11% From Current Price Level
$464 – Buyers – 1.44:1; +10.16% From Current Price Level
$460 – Sellers – 1:0*; +9.21% From Current Price Level
$456 – Buyers – 3.2:0*; +8.26% From Current Price Level
$452 – Sellers – 1.13:1; +7.31% From Current Price Level
$448 – Buyers – 1.33:1; +6.37% From Current Price Level
$444 – Sellers – 1.13:1; +5.42% From Current Price Level
$440 – Buyers – 1.10:1; +4.47% From Current Price Level
$436 – Buyers – 1.21:1; +3.52% From Current Price Level
$432 – Buyers – 1.09:1; +2.57% From Current Price Level
$428 – Buyers – 1.05:1; +1.62% From Current Price Level – 10 & 50 Day Moving Averages**
$424 – Sellers – 1.81:1; +0.67% From Current Price Level
$420 – Sellers – 3.15:1; -0.28% From Current Price Level; Current Price Block*
$416 – Buyers – 2.24:1; -1.23% From Current Price Level – 200 Day Moving Average*
$412 – Sellers – 1.03:1; -2.18% From Current Price Level
$408 – Buyers – 1.28:1; -3.13% From Current Price Level
$404 – Sellers – 1.15:1; -4.08% From Current Price Level
$400 – Sellers – 1.93:1; -5.03% From Current Price Level
$396 – Buyers – 2.52:1; -5.98% From Current Price Level
$392 – Buyers – 1.76:1; -6.93% From Current Price Level
$388 – Buyers – 1.05:1; -7.88% From Current Price Level
$384 – Sellers – 1.84:1; -8.83% From Current Price Level
$380 – Sellers – 2.38:1; -9.78% From Current Price Level
$376 – Sellers – 1.63:1; -10.73% From Current Price Level
$372 – Sellers – 1.26:1; -11.68% From Current Price Level
$368 – Sellers – 1.75:1; -12.63% From Current Price Level
$364 – Sellers – 1.86:1; -13.58% From Current Price Level
$360 – Buyers – 1.53:1; -14.53% From Current Price Level
$356 – Sellers – 5.89:1; -15.48% From Current Price Level
$352 – Sellers – 2.1:0*; -16.43% From Current Price Level
$348 – Sellers – 1.7:0*; -17.38% From Current Price Level
$344 – NULL – 0:0*; -18.33% From Current Price Level
$340 – NULL – 0:0*; -19.28% From Current Price Level
Technical Analysis & Price:Volume Sentiment For QQQ (NASDAQ)
QQQ ETF – Invesco QQQ Trust ETF’s Technical Performance Over The Past Year
Their RSI is aggressively moving towards the oversold mark at 30 & sits currently at 38.57, while their MACD has recently crossed over bearishly & is currently in freefall.
Volumes were +7.26% higher than average last week compared to the year prior (57,765,767 vs. 53,856,939), but Thursday & Friday’s near matching bearish volumes are a cause for concern, given that they were the highest volume sessions of the week.
Friday at such a level would be expected, as it would be a risk-off move going into the weekend, but the fact that Thursday’s volumes were near-identical signals that there is more than just a little fear out in the markets & indicative of more risk-off behavior in the near-future.
Much like SPY, QQQ kicked off the week on a bullish note, opening at the 50 day moving average’s support & closing up on the day, before Tuesday’s declining day which showed a hint of optimism, opening at the same support level, joined by the 10 DMA for support & closing slightly above their open, despite declining overall.
However, Wednesday’s session opened beneath the 10 & 50 DMA’s resistance levels, and while they briefly broke above it mid-day, prices focused on the lower range of the day’s prices & tested even below their close, foreshadowing the weakness of Thursday & Friday.
Thursday again attempted to break the resistance of the 10 & 50 DMAs, but resulted in declines, which led to Friday’s additional day of declines as fear officially crept into the market.
Like SPY, QQQ has limited support anywhere near their current price, which signals that they may see sharper declines than SPY in the near-term & making their Average True Range reading harder to rely on, as it signals a brief consolidation is warranted in the near-term, but there are few places with strong support levels near their price, as until the $340 block begins at $343.99, it is a seller dominated zone (making it a -4.12% decline before any sturdy footing, historically).
Even should QQQ find brief footing in the $340 (Buyers, 3.28:1) & $336 (Buyers, 1.25:1), the next two blocks are Seller dominated before one last Buyer stand in the $324/share block, which is -8.63% below the current price level, before the sellers take over again.
QQQ ETF’s Price:Volume Sentiment Over The Past 1-2 Years Applied To Their Past Year’s Support & Resistance Levels
QQQ ETF’s Price:Volume Sentiment Over The Past 1-2 Years
QQQ ETF’s Price:Volume Sentiment Over The Past 1-2 Years
QQQ ETF’s Price:Volume Sentiment Over The Past 1-2 Years
$388 – NULL – 0:0*; +9.42% From Current Price Level
$384 – Buyers – 1.4:1; +8.29% From Current Price Level
$380 – Buyers – 4.25:1; +7.16% From Current Price Level
$376 – Sellers – 1.03:1; +6.03% From Current Price Level
$372 – Buyers – 1.07:1; +4.91% From Current Price Level
$368 – Buyers – 1.24:1; +3.78% From Current Price Level
$364 – Buyers – 1.29:1; +2.65% From Current Price Level – 10 & 50 Day Moving Averages**
$360 – Sellers – 1.09:1; +1.52% From Current Price Level
$356 – Sellers – 1.73:1; +0.39% From Current Price Level
$352 – Buyers – 1.63:1; -0.73% From Current Price Level; Current Price Block*
$348 – Sellers – 1.48:1; -1.86% From Current Price Level
$344 – Sellers – 1.78:1; -2.99% From Current Price Level
$340 – Buyers – 3.28:1; -4.12% From Current Price Level
$336 – Buyers – 1.25:1; -5.25% From Current Price Level – 200 Day Moving Average*
$332 – Sellers – 6.13:1; -6.37% From Current Price Level
$328 – Sellers – 1.05:1; -7.5% From Current Price Level
$324 – Buyers – 2.57:1; -8.63% From Current Price Level
$320 – Sellers – 1.2:1; -9.76% From Current Price Level
$316 – Sellers – 1.97:1; -10.89% From Current Price Level
$312 – Sellers – 1.67:1; -12.01% From Current Price Level
$308 – Buyer s- 1.21:1; -13.14% From Current Price Level
$304 – Buyers – 1.05:1; -14.27% From Current Price Level
$300 – Sellers – 2.25:1; -15.4% From Current Price Level
$296 – Buyers – 2.33:1; -16.53% From Current Price Level
$292 – Buyers – 1.72:1; -17.65% From Current Price Level
$288 – Sellers – 2.02:1; -18.78% From Current Price Level
$284 – Sellers – 1.59:1; -19.91% From Current Price Level
$280 – Even; 1:1; -21.04% From Current Price Level
$276 – Sellers – 1.09:1; -22.17% From Current Price Level
$272 – Sellers – 1.77:1; -23.29% From Current Price Level
$268 – Sellers – 1.23:1; -24.42% From Current Price Level
$264 – Buyers – 1.33:1; -25.55% From Current Price Level
$260 – Sellers – 4.4:1; -26.68% From Current Price Level
$256 – Sellers – 2.2:0*; -27.81% From Current Price Level
Technical Analysis & Price:Volume Sentiment For IWM (Russell 2000)
IWM, the iShares Russell 2000 ETF lost -2.25% last week, after being in a steady decline since August & is approaching their 52-week low, which was set almost one year ago.
IWM ETF – iShares Russell 2000 ETF’s Technical Performance Over The Past Year
Their RSI is approaching the oversold mark & sits currently at 32.57, while their MACD crossed over bearishly a few days ago.
Most alarming for IWM is the strength of the outflow volume last week, which was +46.01% higher than average when compared to the average volumes for the year prior (41,537,250 vs. 28,447,780), as this indicates a bit more than profit taking was going on & is a signal of broader weakness.
Monday of last week showed hope for the bulls, as IWM was able to break & close above the resistance of the 10 day moving average & the momentum was able to carry into Tuesday for another day of gains.
Tuesday flashed warning signs however, as the day’s price action was all centered around the lower end of the candle, but the upper shadow ran up beyond the $176/share level, but was unable to close near it.
Wednesday the mudslide began & the support of the 10 DMA was broken down, leading way to Thursday & Friday’s declines as well.
Their ATR signals that there may be a brief consolidation on the horizon, unless there is an outright steep decline this week, as all eyes look to see how the support of their 52-week low holds up from about one year ago.
Sellers are currently in control on the $166 price block 1.75:1, with the next lower block of $164 being the lowest level with data for the past 2-3 years being seller dominated at a rate of 2.83:1.
Any further declines will be into uncharted territory from this analysis’s perspective, as $162/share & lower are denoted NULL (not enough volume to report on, but not no volume at all).
IWM ETF’s Price:Volume Sentiment Over The Past 1-2 Years Applied To Their Past Year’s Support & Resistance Levels
IWM ETF’s Price:Volume Sentiment Over The Past 1-2 Years
IWM ETF’s Price:Volume Sentiment Over The Past 1-2 Years
$198 – NULL – 0:0*; +18.96% From Current Price Level
$196 – Buyers – 2.29:1; +17.76% From Current Price Level
$194 – Buyers – 1.38:1; +16.56% From Current Price Level
$192 – Buyers – 1.12:1; +15.36% From Current Price Level
$190 – Sellers – 1.27:1; +14.16% From Current Price Level
$188 – Buyers – 4.8:1; +12.95% From Current Price Level
$186 – Buyers – 3.4:1; +11.75% From Current Price Level
$184 – Sellers – 1.33:1; +10.55% From Current Price Level
$182 – Buyers – 1.36:1; +9.35% From Current Price Level
$180 – Sellers – 1.22:1; +8.15% From Current Price Level – 200 Day Moving Average*
$178 – Sellers – 1.25:1; +6.95% From Current Price Level – 50 Day Moving Average*
$176 – Buyer s- 1.55:1; +5.74% From Current Price Level
$174 – Buyers – 1.08:1; +4.54% From Current Price Level
$172 – Buyers – 1.31:1; +3.34% From Current Price Level – 10 Day Moving Average*
$170 – Sellers – 1.88:1; +2.14% From Current Price Level
$168 – Sellers – 3.5:1; +0.94% From Current Price Level
$166 – Sellers – 1.75:1; -0.26% From Current Price Level; Current Price Block*
$164 – Sellers – 2.83:1; -1.47% From Current Price Level
$162 – NULL – 0:0*; -2.67% From Current Price Level
Technical Analysis & Price:Volume Sentiment For DIA (Dow Jones Industrial Average)
DIA ETF – SPDR Dow Jones Industrial Average ETF’s Technical Performance Over The Past Year
Their RSI is nosediving towards oversold & sits currently at 36.17, with a MACD that is set for a bearish crossover tomorrow or Tuesday.
Volumes were still an area of concern for DIA though, with last week’s volume being +20.45% above average compared to the year prior (4,367,283 vs. 3,625,732) & Thursday was the largest volume day, on a decline that broke the support of the 10 & 200 day moving averages, signaling that there is a sense of panic now for the index that has remained the most resilient recently.
Monday kicked off with a candle that is slightly larger bodied than a spinning top & remained relatively range-bound, indicating hesitance on the part of market participants & Tuesday’s candle’s real body remained in the same range, despite the upper shadow extending higher, indicating that there was limited interest in going above the range.
Wednesday’s decline was supported by the 10 day moving average, before Thursday’s aggressive decline (by volume) broke through the 10 & 200 DMA, leading to Friday’s decline that broke down the $331.76/share support level to close lower.
All eyes will be on the $328/share range, which has historically been dominated by buyers over the past 3-4 years at a rate of 1.1:1.
After that the sellers take control for another -7% of downside before buyers step back into control historically, as the data below shows.
DIA ETF’s Price:Volume Sentiment Over The Past 3-4 Years Applied To The Past Year’s Support & Resistance Levels
DIA ETF’s Price:Volume Sentiment Over The Past 3-4 Years
DIA ETF’s Price:Volume Sentiment Over The Past 3-4 Years
DIA ETF’S Price:Volume Sentiment Over The Past 3-4 Years
$356 – NULL – 0:0; +7.49% From Current Price Level
$352 – Buyers – 2.6:0*; +6.28% From Current Price Level
$348 – Sellers – 1.28:1; +5.08% From Current Price Level
$344 – Buyers – 1.35:1; +3.87% From Current Price Level
$340 – Buyers – 1.56:1; +2.66% From Current Price Level – 50 Day Moving Average*
$336 – Buyers – 1.2:1; +1.45% From Current Price Level – 10 Day Moving Average*
$332 – Sellers – 1.07:1; +0.24% From Current Price Level – 200 Day Moving Average*
$328 – Buyers – 1.1:1; -0.96% From Current Price Level; Current Price Block*
$324 – Sellers – 1.41:1; -2.17% From Current Price Level
$320 – Sellers – 1.27:1; -3.38% From Current Price Level
$316 – Sellers – 1.12:1; -4.59% From Current Price Level
$312 – Sellers – 1.46:1; -5.79% From Current Price Level
$308 – Buyers – 1.24:1; -7% From Current Price Level
$304 – Buyers – 1.09:1; -8.21% From Current Price Level
$300 – Buyer s – 1.17:1; -9.24% From Current Price Level
$296 – Even – 1:1; -10.63% From Current Price Level
$292 – Sellers – 1.35:1; -11.83% From Current Price Level
$288 – Sellers – 1.08:1; -13.04% From Current Price Level
$284 – Sellers – 1.05:1; -14.25% From Current Price Level
$280 – Sellers – 2.25:1; -15.46% From Current Price Level
$276 – Buyers – 3.33:1; -16.66% From Current Price Level
$272 – Buyers – 2:1; -17.87% From Current Price Level
$268 – Buyers – 2:1; -19.08% From Current Price Level
$264 – Sellers – 1.43:1; -20.29% From Current Price Level
$260 – Sellers – 1.18:1; -21.5% From Current Price Level
$256 – Even – 1:1; -22.7% From Current Price Level
$252 – Buyers – 7:1; -23.91% From Current Price Level
$248 – Sellers – 0.6:0*; -25.12% From Current Price Level
$244 – NULL – 0:0*; -26.33% From Current Price Level
The Week Ahead
Let’s take a look at some of the things that may move the markets in the coming week.
Monday has no economic data scheduled for reporting, but Agilysys, Alexandria Real Estate Equities, Brown & Brown, Cadence Bank, Calix Networks, Cleveland-Cliffs, Crane, Medpace, Packaging Cor of America, Simpson Manufacturing, W.R. Berkley & WSFS Financial are all scheduled to report earnings.
Tuesday brings us the S&P Case-Schiller Home Price Index (20 Cities) at 9 am, S&P Flash U.S. Services PMI & S&P Flash U.S. Manufacturing PMI data at 9:45 am.
Tuesday’s earnings calls include Microsoft, 3M, Alphabet, Archer-Daniels-Midland, Ares Capital, Boyd Gaming, Canadian National Railway, Centene, Coca-Cola, Chubb, Corning, Danaher, Dover, Dow, Encore Wire, F5 Networks, Franklin Electric, General Electric, General Motors, Halliburton, Hawaiian Holdings, Illinois Tool Works, Invesco, JBT Corp, Kimberly-Clark, Matador Resources, NextEra Energy, Nucor, Old National Bancorp, PACCAR, PacWest Bancorp, Pentair, Polaris Industries, PulteGroup, Quest Diagnostics, Range Resources, Robert Half, RTX, Sherwin-Williams, Simply Good Foods, Snap, Spotify, Synchrony Financial, Teck Resources, Teladoc Health, Texas Instruments, TransUnion, Verizon Communications, Vicor, Visa, Waste Management & Xerox.
Wednesday we get New Home Sales data at 10 am, as well as earnings reports from Meta Platforms, Agnico-Eagle Mines, Alamos, Align Technology, Amphenol, Antero Resources, AptarGroup, Automatic Data, AvalonBay, Avery Dennison, Baker Hughes, Boeing, BOK Financial, Canadian Pacific Kansas City, Chemed, Churchill Downs, CME Group, CNX Resources, Community Health, Edwards Lifesciences, Element Solutions, EQT Corp., Equinix, Ethan Allen, Everest Group, Evercore, Flex, Flowserve, Fortive, General Dynamic, Globe Life, Graco, Greenbrier, Hess, Hilton, International Business Machines, IDEX Corp, IMAX, Invitation Homes, Kilroy Realty, KLA Corp. Lending Club, Lithia Motors, Mattel, Molina Healthcare, Moody’s, Mr. Cooper Group, MSC Industrial, Navient, Netgear, Norfolk Southern, O’Reilly Automotive, Old Dominion Freight Line, Otis Worldwide, Owens Corning, Pilgrim’s Pride, Ryder System, Sallie Mae, SEI Investments, ServiceNow, Sun Communities, Sunnova Energy, Taylor Morrison Home, Teledyne Technologies, Teradyne, Thermo Fisher Scientific, T-Mobile US, Travel + Leisure, United Rentals, Universal Health, Valmont Industries, VICI Properties, Viking Therapeutic, Wabash National, Weatherford International, WesBanco, West Fraser, Western Union, Whirlpool, and Wyndham Hotels & Resorts.
GDP, Initial Jobless Claims, Durable-Goods Orders, Durable-Goods Minus Transportation, Advanced U.S. Trade Balance in Goods, Advanced Retail Inventories & Advanced Wholesale Inventories data are released at 8:30 am on Thursday, followed by Pending Home Sales at 10 am.
Thursday’s earnings calls include Amazon.com, A.O. Smith, AllianceBernstein, Altria Group, American Tower, Applied Industrial, Arch Coal, BJ Restaurants, Boston Beer, Boston Scientific, Bristol Meyers Squibb, Brunswick, Bunge, Camden Property, Capital One Financial, Carlisle Cos, Carrier Global, CenterPoint Energy, CMS Energy, Chemours, Chipotle Mexican Grill, Cincinnati Financial, Columbia Sportswear, Comcast, Coursera, Cullen/Frost, Deckers Outdoor, Dexcom, Digital Realty Trust, Eastman Chemical, Encompass Health, Enphase Energy, Essex Property, First American Financial, Federated Hermes, FirstEnergy, Ford Motor, Gaming & Leisure Properties, Grainger, Harley-Davidson, Hartford Financial Group, Hasbro, Hershey Foods, Hertz Global, Honeywell, Hub Group, Intel, International Paper, Juniper Networks, Kenvue, Keurig Dr. Pepper, Kimco Realty, L3Harris, Laboratory Corp. of America, Lennox International, Linde, Masco, Mastercard, Medical Properties Trust, Merck, Mobileye Global, Mohawk Industries,NerdWallet, Newmont Goldcorp, Northrop Grumman, NovoCure, Olin, Overstock.com, Peabody Energy, PG&E, Principal Financial Group, PTC Therapeutics, Reliance Steel, Republic Services, Royal Caribbean, Seagate Technology, Sketchers USA, SkyWest, Southwest Airlines, STAG International, STMicroelectronics, Terex, Texas Roadhouse, Textron, Tractor Supply Company, Tradeweb Markets, TRI Pointe Homes, United Parcel Services, U.S. Steel, UDR, Valero Energy, VeriSign, Vulcan Materials, Willis Towers Watson & Weyerhaeuser.
Friday the week winds down with Personal Income (nominal), Personal Spending (nominal), PCE Index, Core PCE Index, PCE (Year-over-Year) & Core PCE (Year-over-Year) at 8:30 am, followed by Consumer Sentiment (Final) data at 10 am.
SPY, the SPDR S&P 500 ETF advanced +0.46% over the past week, trailing only the Dow Jones Industrial Average in terms of weekly performance by an index.
SPY ETF – SPDR S&P 500 ETF’s Technical Performance Over The Past Year
Their RSI is trending away from the neutral 50 mark & sits at 46.43, while their MACD remains bullish but is beginning to curl over bearishly, with a bearish crossover to be expected in the next few sessions.
Volumes were +2.58% above average last week compared to the year prior (85,155,567 vs. 83,016,788), which does not serve much in the way of tell-tales, however, the declining days’ volumes each outnumber the volumes on the advancing days, indicating that risk off sentiment is creeping in (or at the bare minimum, aggressive short-term profit taking).
Monday kicked off with the 10 Day Moving Average providing support for the opening price & pushing it higher for the next two days, however it is worth noting that volume faded beyond the first day of advances.
Wednesday’s hanging man candlestick set the tone for the end of the week’s declining sessions, but Friday’s risk off declining day was supported by the 10 DMA still, which will be an area of interest in the coming week, particularly as the 50 DMA begins to apply downwards pressure on SPY.
Their Average True Range (ATR) is reverting towards the mean after the last two days of decline, which indicates that there will be more bearish sentiment in the near-term & investors should be cautious.
Once the support of the 10 DMA is broken, all eyes should revert to the 200 DMA, as it will be closing in on the share price from below & support levels in this range are sparse over the past year.
If the 200 DMA is broken, the $413-414/share zone will be the major area of interest to be watching in case of further declines.
SPY has support at the $431.49 (Volume Sentiment: Sellers, 1.1:1), $429.59 (10 Day Moving Average; Volume Sentiment: Sellers, 1.1:1), $420.18 (Volume Sentiment: Buyers, 1.04:1) & $418.48/share (200 Day Moving Average; Volume Sentiment: Buyers, 1.49:1) price levels, with resistance at the $437.33 (Volume Sentiment: Sellers, 1.17:1), $438.54 (50 Day Moving Average; Volume Sentiment: Sellers, 1.17:1), $452.08 (Volume Sentiment: Buyers, 1.25:1) & $457.82 /share (Volume Sentiment: Sellers, 1.07:1) price levels.
SPY ETF’s Price:Volume Sentiment Over The Past 1-2 Years
QQQ, the Invesco QQQ Trust ETF inched forward +0.16% this past week, as market participants were not interested in the riskier, tech-heavy names.
QQQ ETF – Invesco QQQ Trust ETF’s Technical Performance Over The Past Year
Their RSI is downtrending & about to pass through the neutral 50 mark bearishly, currently at 50.19, while their MACD is poised to roll over bearishly & bearishly crossover by mid-week.
Volumes were -5.06% below average last week compared to the year prior’s average (51,250,950 vs. 53, 981,234), indicating that there is less investor sentiment for NASDAQ names than average & enthusiasm is waning.
However, much like SPY, volumes were heavier on the declining days of Thursday & Friday than on the advancing days earlier in the week.
Monday was supported by the 10 day moving average, which led to Tuesday breaking above the resistance of the 50 DMA.
Wednesday’s hanging man set up the following two days of declines, and now all eyes are on the 10 DMA, as it is the closest support level.
Should that break down, there looks to be more trouble on the horizon, as their ATR looks primed to normalize more with further declines in the coming days.
QQQ has support at the $364.09 (10 Day Moving Average; Volume Sentiment: Buyers, 1.1:1 ), $358.06 (Volume Sentiment: Sellers, 2.57:1), $357.07 (Volume Sentiment: Sellers, 2.57:1) & $351.36/share (Volume Sentiment: Sellers, 1.03:1) price levels, with resistance at the $366.68 (50 Day Moving Average; Volume Sentiment: Buyers, 1.1:1), $371.80 (Volume Sentiment: Buyers, 8.2:1), $373.74 (Volume Sentiment: Sellers, 4.25:1) & $380.28/share (Volume Sentiment: Buyers, 1.41:1) price levels.
QQQ ETF’s Price:Volume Sentiment Over The Past 1-2 Years
IWM ETF – iShares Russell 2000 ETF’s Technical Performance Over The Past Year
Their RSI is trending back towards oversold levels at 33.43, with a MACD that is going to make a bearish crossover in the next day or two.
Volumes were +18.59% above average last week compared to the year prior (33,410,783 vs. 28,172,563) as investors were looking to take profits off of the table after the recent run up that began in early October.
Wednesday’s spinning top candlestick on a bearish day set the tone for the end of the week, with Thursday’s session shattering the 10 DMA’s support & Friday’s decline day not even testing the resistance level it set.
Their ATR suggests that there may be a brief consolidation in the coming days, but the other indicators are suggesting further declines.
IWM has support at the $169.09 (Volume Sentiment: Sellers, 1.6:1), $168.49 (Volume Sentiment: Sellers, 1.6:1), $168.46 (Volume Sentiment: Sellers, 1.6:1) & $167.53/share (Volume Sentiment: Sellers, 4.1:1) price levels, with resistance at the $171.08 (Volume Sentiment: Even, 1:1), $171.25 (Volume Sentiment: Even, 1:1), $171.39 (Volume Sentiment: Even, 1:1) & $172.84/share (10 Day Moving Average; Volume Sentiment: Sellers, 1.9:1) price levels.
IWM ETF’s Price:Volume Sentiment Over The Past 1-3 Years
DIA, the SPDR Dow Jones Industrial Average ETF gained +0.77% over the past week, as investors flocked into the larger cap names while seeking some form of stability & safety without becoming completely risk-off.
DIA ETF – SPDR Dow Jones Industrial Average ETF’s Technical Performance Over The Past Year
Their RSI is just below the neutral mark of 50 at 45.19, while their MACD is bullish, but clearly losing steam & looks set to bearishly crossover within the coming week.
Volumes were +7% above average last week compared to the year prior (3,876,233 vs. 3,622,649), which is notable as they highest volume day was Friday, when most folks were taking risk off & the day was an advancing session, despite ending in a spinning top candlestick that while being a positive day, ended lower than the opening price (bearish implications).
Tuesday’s session was able to find support, but the spinning top candlestick that closed lower than it opened signaled that there was pain to come, which Wednesday’s lower close than open dragonfly doji candle confirmed.
Thursday’s decline broke the 200 Day Moving Average’s support, but the 10 DMA held it up & Friday closed just above the 200 DMA, but on a spinning top that closed lower than it opened, indicating uncertainty & impending declines.
Their ATR suggests that by mid-week there will be more declines & the support of the 10 & 200 DMA’s will be tested.
DIA has support at the $335.68 (200 Day Moving Average; Volume Sentiment: Sellers, 1.18:1), $334.48 (10 Day Moving Average; Volume Sentiment: Sellers, 1.18:1), $331.94 (Volume Sentiment: Buyers, 1.02:1) & $329/share (Volume Sentiment: Buyers, 1.02:1) price levels, with resistance at the $338.38 (Volume Sentiment: Buyers, 1.32:1), $338.71 (Volume Sentiment: Buyers, 1.32:1), $339.42/339.45 (Volume Sentiment: Buyers, 1.32:1) & $342.27/share (Volume Sentiment: Buyers, 1.46:1) price levels.
DIA ETF’s Price:Volume Sentiment Over The Past 3-4 Years
Oil & Gas Production & Exploration (GUSH), Japan (DXJ), Turkey (TUR) & North American Natural Resources (IGE) Are All Bullishly Leading The Market
GUSH ETF – Direxion Daily S&P Oil & Gas Exploration & Production Bull 2x Shares ETF’s Technical Performance Over The Past Year
Their RSI is just above neutral trending north towards overbought levels at 55.35 & their MACD is bullish after completing a crossover recently.
Volumes were -21.39% below average last week compared to the year prior (1,337,800 vs. 1,701,814), signaling that investor enthusiasm is waning for GUSH.
Monday’s gap up session was the strongest volume of the week, but indecision began to show itself on Tuesday when the trading day resulted in a doji candlestick.
Wednesday showed weakness as the day began with a decline, tested lower (briefly dipping beneath the support of the 10 day moving average, but was able to close higher than it opened, while Thursday showed more weakness as the day ended in a decline.
Thursday was able to test higher than Wednesday & its open & closing price range were concentrated towards the upper end of the candlestick, which set the stage for Friday’s gap up that broke the resistance of the 50 DMA, but ultimately investors continued to signal indecision as the day resulted in a spinning top candlestick heading into the weekend.
Their Average True Range is reverting back to its mean & may be able to add in some brief strength, but by the end of the week most of the higher price level concentration will leave the calculation, and likely will result in declines.
While GUSH offers a 1.97% distribution yield, that is limited protection against declines in the near future & profit taking or hedging strategies using options such as buying puts or selling calls is something worth considering.
GUSH has support at the $38.68 (50 Day Moving Average; Volume Sentiment: Buyers, 1.06:1), $37.54/37.53 (Volume Sentiment: Even, 1:1), $37.46 (Volume Sentiment: Even, 1:1) & $37.28/share (Volume Sentiment: Even, 1:1) price levels, with resistance at the $40.77 (Volume Sentiment: Buyers, 1.28:1), $40.89 (Volume Sentiment: Buyers, 1.28:1), $41.10 (Volume Sentiment: Buyers, 4.24:1) & $41.65/share (Volume Sentiment: Buyers, 4.24:1) price levels.
GUSH ETF’s Price:Volume Sentiment Over The Past 1-2 Years
DXJ ETF – WisdomTree Japan Hedged Equity Fund ETF’s Technical Performance Over The Past Year
Their RSI is just below the neutral mark at 48.2, while their MACD is bearish but trying to advance towards a bullish crossover.
Volumes were 62.69% above average last week compared to the year prior (791,150 vs. 486,299), which has negative implications as their highest volume day for the week was a risk off Friday.
Monday kicked off on an indecisive note as the day resulted in a spinning top, followed by a gap up shooting star candlestick on Tuesday that was able to break above the resistance of the 10 & 50 day moving averages, but was still a bearish signal in the near-term.
Wednesday was another spinning top, as market participants were unsure of DXJ’s value & the price action was relatively contained in the day prior’s price range.
Thursday the bulls took over, forcing a gap up open that resulted in a black filled candle as the day closed below the open, despite opening sharply higher, in another sign that there is still heavily bearish sentiment.
Friday’s gap down confirmed this, although the support levels provided by the crossing 10 DMA through the 50 DMA (bearishly) held up & went untested throughout the day & will be an interesting area to watch this week.
Their Average True Range may be forming a head & shoulders type pattern, which would mean it would revert to the mean, and given where price levels are in the ATR calculation, further declines appear to be on the horizon in the near-term due to the volatile swings lower in the days that will remain in the calculation.
This is also confirmed by the bearish head & shoulders pattern that recent formed around their 52-week high in mid-September, as it appears that many investors have been taking profits off of the table over the past month.
A 2.58% distribution yield is a decent cushion against near-term losses for DXJ holders, but the impending volatility looks like it may be a good time to begin looking at hedging options on open positions.
DXJ has support at the $86.70 (50 Day Moving Average; Volume Sentiment: NULL, 0:0), $86.52 (10 Day Moving Average; Volume Sentiment: NULL, 0:0*), $85.59 (Volume Sentiment: Buyers, 2:1) & $85.55/share (Volume Sentiment: Buyers, 2:1) price levels, with resistance at the $88.85 (Volume Sentiment: NULL, 0:0*) & $92.01/share (52 Week High; Volume Sentiment: NULL, 0:0*) price levels.
DXJ ETF’s Price:Volume Sentiment Over The past 6-7 Years
TUR, the iShares MSCI Turkey ETF has climbed +56.03% over the past year, adding +50.67% since their 52-week low in October of 2022 (ex-distributions).
TUR ETF – iShares MSCI Turkey ETF’s Technical Performance Over The Past Year
Their RSI is trending bearishly at 45.76 & their MACD is in bearish decline following their performance over the past week & a half.
Volumes were -69.68% below average last week compared to the year prior (92,100 vs. 303,732) which is a sign of investors’ waning sentiment, particularly when you realize that the sole bullish day of the week was also the lowest volume day as market participants began to take profits following their recent run up to new 52-week highs.
Monday started the week off on a solemn note for TUR, with their price dipping below the previous support of the 10 day moving average & hardly testing it during the day’s session, foreshadowing the weakness to come during the week.
Tuesday was able to break above the 10 DMA’s resistance, & tried making a break higher, but closed well below the highest price of the day & resulted in a shooting star candlestick, a bearish omen.
Wednesday the declines continued, with the day looking very similar to Monday in terms of being unable to break the 10 DMA’s resistance, however they did not trade as low as they did on Monday.
Thursday’s gap down hammer candle became cause for near-term future concern as well, as while the day’s open/close were concentrated near the top of the candle, the lower shadow covered a wide trading range & broke below the 50 DMA, signaling that there is likely more weakness to come, which was confirmed in Friday’s session.
Friday’s spinning top broke below the support of the 50 DMA as investors ran towards the door in risk-off fashion before the weekend, with the candle’s real body being concentrated towards the lower end of the candlestick, showing that investors are feeling uneasy about TUR’s near-term prospects & hinting at more declines to come.
Given that they’ve broken the support of the 50 DMA & their ATR & RSI are both in relatively neutral positions, there appears to be room for declines on the horizon for TUR before oscillators signal that things have sold off too far.
Despite having a 3.36% distribution yield, given their proximity to their 52-week high, it would be a wise time to plot out hedging strategies for TUR.
TUR has support at the $37.06 (Volume Sentiment: Buyers, 5:1), $36.91 (Volume Sentiment: Buyers, 1.14:1), $36.14 (Volume Sentiment: Buyers, 1.14:1) & $35.94/share (Volume Sentiment: Buyers, 1.42:1) price levels, with resistance at the $37.38 (50 Day Moving Average; Volume Sentiment: Buyers, 5:1), $38.69 (10 Day Moving Average; Volume Sentiment: Buyers, 1.25:1), $39.50 (Volume Sentiment: NULL, 0:0*) & $39.76/share (52-Week High; Volume Sentiment: NULL, 0:0*) price levels.
TUR ETF’s Price:Volume Sentiment Over The Past 8-9 Years
IGE ETF – iShares North American Natural Resources ETF’s Technical Performance Over The Past Year
Their RSI is just above the neutral mark at 53.71 & their MACD recently had a bullish crossover a couple of days ago.
Volumes were -43.49% below average last week compared to the year prior (92,150 vs. 163,078), signaling that there is beginning to be a severe lack of enthusiasm for IGE by market participants, with the declining days leading the advancing days last week in terms of daily volume.
Monday kicked off with a major gap up where the day was able to close above the resistance of the 10 day moving average, but while Tuesday continued the climb, indecision & skittishness began to show through, as the upper shadow of the day’s candle was able to break the 50 DMA’s resistance, but the real body of the spinning top settled near the middle of the candle, signaling that investors are not confident.
Wednesday’s bearish hammer candle’s lower shadow tested the support of the 10 DMA & was able to temporarily break below it in a sign of weakness, & Thursday’s lower shadow was able to use it as support, but was unable to break & stay above the resistance of the 50 DMA.
While Friday’s spinning top was able to rest atop the 50 DMA as a support level, it signals that there is still much uncertainty about IGE in the eye’s of market participants.
Their ATR is currently reverting back to its mean, but by Thursday the days included in the calculation will be below Friday’s price & volatile, which signals more near-term unrest for IGE’s share price is on the horizon.
Despite offering a 2.83% distribution yield to long-term shareholders, there appears to be a bearish head & shoulders pattern forming with the head being the 52-week high & prices are nearing the left shoulder’s price level, making it important to have a hedging strategy in place.
IGE has support at the $41.45 (Volume Sentiment: Buyers, 1.11:1), $41.37 (50 Day Moving Average; Volume Sentiment: Buyers, 1.11:1), $40.75 (Volume Sentiment: Buyers, 1.11:1) & $40.57/40.56/share (10 Day Moving Average; 2 Touch-points; Volume Sentiment: Buyers, 1.11:1) price levels, with resistance at the $42.17 (Volume Sentiment: Buyers, 2:1), $42.62 (Volume Sentiment: Buyers, 2:1), $42.74 (Volume Sentiment: Buyers, 2:1) & $43.04/share (52-Week High; Volume Sentiment: NULL, 0:0*) price levels.
IGE ETF’s Price:Volume Sentiment Over The Past 10-11 Years
Europe (EURL), China (CHAU), Junior Gold Miners (JNUG) & Chile (ECH) Are All Bearishly Lagging The Market
EURL, the Direxion Daily FTSE Europe Bull 3x Shares ETF has advanced +72.45% over the past year, gaining +68.09% since their 52-week low in October of 2022, but has recently been in a major decline, losing -29.84% since their 52-week high in May of 2023 (ex-distributions).
EURL ETF – Direxion Daily FTSE Europe Bull 3x Shares ETF’s Technical Performance Over The Past Year
Their RSI is trending downwards towards the oversold end of neutral at 41.75, with a MACD that is still bullish, but beginning to curl over bearishly following the last few sessions.
Volumes were -24.11% below average last week compared to the year prior (23,316 vs. 30,725), but there was a glimmer of hope flashed as their bullish days had better volume than their bearish days.
However that seems to have faded quickly as the slide into the weekend more than covered the window created by Tuesday’s gap up & was only saved from falling further by the support of the 10 day moving average.
Their ATR suggests that we may see a brief consolidation period in the coming week, but with only a 2.9% distribution yield & an impending bearish MACD crossover, it would be wise to examine hedging strategies for open positions.
EURL has support at the $17.33 (10 Day Moving Average & Closing Price Friday; Volume Sentiment: Sellers, 1.5:1), $17.17 (Volume Sentiment: Sellers, 1.5:1), $16.96 (Volume Sentiment: Buyers, 1.27:1) & $16.65/share (Volume Sentiment: Buyers, 1.27:1) price levels, with resistance at the $17.96 (Volume Sentiment: Buyers, 1.05:1), $18.56 (Volume Sentiment: Sellers, 2.31:1), $18.62 (Volume Sentiment: Sellers, 2.31:1) & $18.64/share (Volume Sentiment: Sellers, 2.31:1) price levels.
EURL ETF’s Price:Volume Sentiment Over The Past 2-3 Years
CHAU ETF – Direxion Daily CSI 300 China A Shares Bull 3x Shares ETF’s Technical Performance Over The Past Year
Their RSI is trending towards the oversold end of the neutral range at 40.38 & their MACD is still slightly hanging on to being bullish, but fading out after last week’s trading performance.
Volumes were -37.91% below average last week compared to the year prior (43,583 vs. 70,198), as investor sentiment is souring on CHAU & Wednesday’s spinning top closed lower than it’s open despite being a bullish day while having the week’s highest volumes, signaling weariness among market participants.
Monday kicked the week off with a hanging man, where the open was balanced atop the support of the 10 day moving average, which held up through Wednesday, where a minor gap up resulted in a spinning top that closed lower than it opened, signaling bearishness.
The high volume of that day is particularly concerning, as it led into two consecutive days of declines going into the weekend.
Thursday broke down through the support of the 10 day moving average & Friday’s bearish gap down signaled more bearishness is on the horizon as it moved further away from the resistance of the 10 DMA.
While their ATR suggests that there may be a brief consolidation on the horizon, counting back the days in the calculation it is evident it will last a week at most, as the price levels after that support more further declines & volatility.
While their 2.51% distribution yield will provide some cushion against losses, CHAU shareholders may want to be thinking more about hedging strategies & unloading shares in the coming days before the further declines continue.
CHAU has support at the $15.43 (Volume Sentiment: Sellers, 2:0*) & $14.72/share (52-Week Low; Volume Sentiment: NULL, 0:0*) price levels, with resistance at the $15.68 (Volume Sentiment: Buyers, 11:1), $15.86 (10 Day Moving Average; Volume Sentiment: Buyers, 11:1), $15.95 (Volume Sentiment: Buyers, 11:1) & $16.27/share (Volume Sentiment: Sellers, 3.55:1) price levels.
CHAU ETF’s Price:Volume Sentiment Over The Past 3-4 Years
JNUG, the Direxion Daily Junior Gold Miners Bull 2x Shares ETF has advanced +21.6% over the past year, including a +22.58% gain since their 52-week low in October of 2023, but has declined -45.86% since their 52-week high in April of 2023 (ex-distributions).
JNUG ETF – Direxion Daily Junior Gold Miners Bull 2x Shares ETF’s Technical Performance Over The Past Year
Their RSI has just broken across the neutral 50 mark & sits at 52.74, while their MACD remains climbing bullishly, as they may become a safe haven for market participants during heightened volatility.
Volumes were +56.72% above average last week compared to the year prior (2,399,383 vs. 1,530,961), mostly on the buying side days, which is also a bullish signal, or at least a much more positive signal than most of the volumes that have been looked at in this article.
Monday’s gap up over the resistance of the 10 DMA set the stage for the rest of the week, with Tuesday also advancing, before a bullish doji on Wednesday began to cast shadows of doubt onto their near-term future.
Sure enough, Thursday featured a down day that had a large price range, but it was supported by the 10 DMA & led into Friday’s advancing day.
Of note regarding Friday’s session, it was the highest volume day of the week & going into the weekend, which appears to be a sign of strength, but note that the open-to-close range of the candle’s real body is heavily concentrated on the lower half, and their large upper shadow signals that while there was interest in higher price levels, it was short lived & prices ultimately settled lower.
JNUG offers a 1.53% distribution yield which offers a small amount of cushion against losses in the near-term.
However, their ATR is suggesting that there may be more gains on the horizon (barring a broad market sell off), as it is reverting back towards its mean during the week of advances, but it would be wise to keep a close eye on its performance in the coming weeks in relation to the ATR for further clues into where it may head next.
JNUG has support at the $27.20 (Volume Sentiment: Sellers, 1.8:0*), $22.78 (Volume Sentiment: NULL, 0:0*), $22.76 (Volume Sentiment: NULL, 0:0*) & $22.68/share (Volume Sentiment: NULL, 0:0*) price levels, with resistance at the $28.25 (Volume Sentiment: Sellers, 1.44:1), $28.45 (Volume Sentiment: Sellers, 1.44:1), $28.53 (Volume Sentiment: Sellers, 1.44:1) & $28.80/share (50 Day Moving Average; Two Touch-points; Volume Sentiment: Sellers, 1.44:1) price levels.
JNUG ETF’s Price:Volume Sentiment Over The Past 1-2 Years
ECH, the iShares MSCI Chile Capped ETF has added +14.97% over the past year, gaining +7.92% since their 52-week low in October of 2022, but has lost -22.24% since their 52-week high in July of 2023 (ex-distributions).
ECH ETF – iShares MSCI Chile Capped ETF’s Technical Performance Over The Past Year
Their RSI is trending back towards oversold conditions at 36.99, while their MACD is bullish, but showing signals of near-term weakness that may result in a bearish crossover in the next few days.
Volumes were -33.65% below average last week compared to the year prior (453,533 vs. 683,568), which signals weakness in the gains they had on Tuesday & Wednesday last week, as although those days combined for slightly more bullish volume than the Thursday & Friday declines, Monday was also a bearish day & the sentiment is negative in the near-term.
Keep an eye on the 10 DMA this week, as prices have been fluctuating around it looking to find support, but seeming to not be firmly decided upon it becoming resistance, which will be a good indication of where ECH will be heading next.
Their ATR suggests that there is a chance of seeing a brief consolidation period, but other indicators suggest that may not occur until more declines take place & while their 7.45% distribution yield provides lots of room for a cushion against declines, it does not warrant taking that much risk & a wait & see approach with planned hedges seems wisest in this market setting.
ECH has support at the $24.20 (Volume Sentiment: Buyers, 1.16:1), $24.13 (Volume Sentiment: Buyers, 1.16:1), $24 (Volume Sentiment: Buyers, 1.16:1) & $23.44/share (Volume Sentiment: Sellers, 1.02:1) price levels, with resistance at the $24.93 (10 Day Moving Average & Current Price Level; Volume Sentiment: Buyers, 1.16:1), $25.48 (Volume Sentiment: Sellers, 1.16:1), $25.56 (Volume Sentiment: Sellers, 1.16:1) & $26.06/$26.07/share (2 Touch-points; Volume Sentiment: Buyers, 1.14:1) price levels.
ECH ETF’s Price:Volume Sentiment Over The Past 12-13 Years
The Week Ahead
Monday kicks off with the Empire State Manufacturing Survey at 8:30 am, followed by Philadelphia Fed President Patrick Harker speaking at 10:30 am & again at 4:30 pm.
Charles Schwab & Equity Lifestyle Properties are scheduled to report earnings on Monday.
Tuesday we get U.S. Retail Sales & Retail Sales Minus Autos data at 8:30 am, followed by Industrial Production & Capacity Utilization data at 9:15 am, Business Inventories & Homebuilder Confidence Index data at 10 am & Fed Speaker Bowman & Minneapolis Fed President Neel Kashkari speaking at 10:30 am, & the day winds down with Richmond Fed President Tom Barking speaking at 10:45 am.
Tuesday’s earnings calls will be busy, with Johnson & Johnson, Albertsons, Bank of America, Bank of New York Mellon, Fulton Financial, Goldman Sachs, Hancock Whitney, Interactive Brokers, J.B. Hunt Transportation Services, Lockheed Martin, Pinnacle Financial Partners, Prologis, United Airlines & Wintrust Financial all scheduled to report.
Housing Starts & Building Permits data are released Wednesday at 8:30 am, followed by Fed Governor Chris Waller speaking at 12 pm, New York Fed President John Williams speaking at 12:30 pm, the Fed Beige Book released at 2 pm & wrapped up by Fed Governor Lisa Cook speaking at 6:55 pm.
Netflix, Tesla, Abbot Labs, Alcoa, Ally Financial, ASML, Citizens Financial Group, Crown Castle, Discover Financial Services, Equifax, F.N.B. Corp., First Horizon, Kinder Morgan, Lam Research, Las Vegas Sands, M&T Bank, Morgan Stanley, NASDAQ, Northern Trust, PPG Industries, Procter & Gamble, Rexford Industrial Realty, SL Green Realty, State Street, Steel Dynamics, Travelers, U.S. Bancorp, Winnebago & Zions Bancorp are all scheduled to report earnings on Wednesday.
Thursday will be a busy day, starting with Initial Jobless Claims & the Philadelphia Fed Manufacturing Survey data at 8:30 am, followed by Existing Home Sales & U.S. Leading Economic Indicators data reported at 10 am, before Fed Chairman Jerome Powell speaks at 12 pm & a number of other Fed members speaking throughout the rest of the afternoon (this seems interesting/worth keeping an ear open for).
Friday winds down with Cleveland Fed President Loretta Mester speaking at 12:15 pm, with earnings calls from American Express, Autoliv, Comerica, Huntington Banc, Regions Financial & SLB.
See you back here next week!
*** I DO NOT OWN SHARES OR OPTIONS CONTRACT POSITIONS IN SPY, QQQ, IWM, DIA, GUSH, DXJ, TUR, IGE, EURL, CHAU, JNUG, or ECH AT THE TIME OF PUBLISHING THIS ARTICLE ***
SPY, the SPDR S&P 500 ETF declined -0.68% last week, as investors walked away from risk later in the week.
SPY ETF – SPDR S&P 500 ETF’s Technical Performance Over The Past Year
Their RSI is bouncing back from near oversold territory & sits at 34.56, while their MACD is bearish & attempting to make a run at a bullish crossover over the coming week.
Volumes were +15.32% above average last week compared to the year prior’s average, indicating that investors are not feeling overly confident given the strongest volume day was Friday’s risk off into the weekend session & their 3 bullish sessions were all relatively calm.
Monday kicked off with the lowest volume of the week as investors were not anxious to hop back into the pool, & Tuesday’s declines confirmed it.
Wednesday we saw a spinning top candlestick that was filled in (bearish) with the real body situated towards the top of the candle, signaling some bullish sentiment & predicting the bullish Thursday session (while still indicating uncertainty across the board).
Thursday attempted higher but the upper shadow of the candlestick compared to the closing level of the real body indicate that investors still were not that enthused, especially as the 10 Day Moving Average worked its way down towards the price level as a resistance level.
Friday closed on a bearish session that was unable to reach the resistance of the 10 DMA, but open & closing levels of the day’s range were more bullish than the day before.
Their ATR suggests that we will see a brief consolidation in the coming week, where all eyes should be glued to the 10 DMA to see how it impacts price action, while also keeping tabs on the 200 DMA that is currently acting as support.
SPY has support at the $422.29 (Volume Sentiment: Buyers, 1.04:1 ), $416.09 (200 Day Moving Average; Volume Sentiment: Buyers, 1.49:1), $413.72 (Volume Sentiment: Buyers, 1.6:1) & $404.13/share (Volume Sentiment: Sellers, 1.82:1) price levels, with resistance at the $431.49 (Volume Sentiment: Sellers, 1.1:1), $432.70 (10 Day Moving Average; Volume Sentiment: Buyers, 1.23:1), $443.10 (50 Day Moving Average; Volume Sentiment: Buyers, 2.43:1) & $454.08/share (Volume Sentiment: Buyers, 1.25:1) price levels.
SPY ETF’s Price:Volume Sentiment Over The Past 1-2 Years
QQQ ETF – Invesco QQQ Trust ETF’s Technical Performance Over The Past Year
Their RSI is currently at 40.06, getting out of the oversold end of the neutral range, while their MACD looks to be making an attempt at a bullish crossover in the coming week.
Volumes were -2.06% lower than average last week compared to the average volume of the year prior, which has bearish implications given that 4 of the 5 sessions last week resulted in advances that people were not enthusiastic to participate in.
Monday’s candlestick had a brief glimmer of faint optimism, closing bullish on the day & advancing from last Friday’s risk off session, but Tuesday the bears took back control & walked prices lower.
Wednesday closed with a dragonfly doji, indicating indecision, but also a potential reversal & prices went north on Thursday & Friday.
Friday, however, was unable to test the 10 DMA successfully & as a result that will be adding downward resistance pressure against the price.
Their ATR implies that there may be a brief consolidation in the coming week for their price, with each passing day the range becoming more friendly for a greater decline in the near-term.
QQQ has support at the $354.19 (Volume Sentiment: Buyers, 2.33:1), $351.36 (Volume Sentiment: Sellers, 1.03:1), $329.41 (200 Day Moving Average; Volume Sentiment: Buyers, 1.05:1) & $312.31/share (Volume Sentiment: Sellers, 2:1) price levels, with resistance at the $360.60 (10 Day Moving Average; Volume Sentiment: Sellers, 1.38:1), $369.41 (50 Day Moving Average; Volume Sentiment: Buyers, 8.2:1), $380.28 (Volume Sentiment: Buyers, 1.41:1) & $387.42/share (Volume Sentiment: Buyers, 1.4:1) price levels.
QQQ ETF’s Price:Volume Sentiment Over The Past 1-2 Years
IWM, the iShares Russell 2000 ETF climbed +0.51% over the past week, as investors showed the most interest in small cap stocks out of the major indexes.
IWM ETF – iShares Russell 2000 ETF’s Technical Performance Over The Past Year
Their RSI is trending back towards oversold, currently at 37.74 & their MACD looks primed to have a possible bullish crossover in the coming days.
Volumes were +6.01% higher than average last week compared to the year prior, which is slightly bullish when you break down the advancing:declining days, however, like the previous 2 indexes, watch the 10 DMA.
Monday closed lower, but the upper shadow paved the way for the rest of the week’s candles, until Friday’s was unable to break the resistance of the 10 DMA.
It is also worth noting that their 200 DMA is about to roll over bearishly while applying resistance.
IWM has support at the $174.52 (Volume Sentiment: Buyers, 1.3:1), $174.29 (Volume Sentiment: Buyers, 1.3:1), $173.42 (Volume Sentiment: Sellers, 1.9:1) & $171.39/share (Volume Sentiment: Even, 1:1) price levels, with resistance at the $177.48 (10 Day Moving Average; Volume Sentiment: Buyers, 1.71:1), $178.45 (Volume Sentiment: Sellers, 1.9:1), $180.76 (Volume Sentiment: Sellers, 1.02:1) & $181.49/share (200 Day Moving Average; Volume Sentiment: Sellers, 1.02:1 ) price levels.
IWM ETF’s Price:Volume Sentiment Over The Past 1-2 Years
DIA ETF – SPDR Dow Jones Industrial Average ETF’s Technical Performance Over The Past Year
Their RSI is currently trending towards oversold at 31.41, with their MACD in decline & looking to continue further south.
Volumes were +7.93% higher than average last week compared to the average volume for the year prior, which signals bearish sentiment as outflow volume outnumbered bullish days.
Monday’s slightly bullish session gave a shot of hope, but Tuesday opened with declines before the 200 DMA caught their price & helped nudge it higher, even if momentarily.
Friday they closed below the 200 DMA’s support level, which sets the stage for more pressure to the downside.
DIA has support at the $334.31 (Volume Sentiment: Sellers, 1.18:1), $332.93 (Volume Sentiment: Sellers, 1.18:1), $331.94 (Volume Sentiment: Buyers, 1.02:1) & $329/share (Volume Sentiment: Sellers, 1.46:1) price levels, with resistance at the $335.43 (200 Day Moving Average; Volume Sentiment: Sellers, 1.18:1), $339.42 (Volume Sentiment: Buyers, 1.32:1), $339.87 (10 Day Moving Average; Volume Sentiment: Buyers, 1.32:1) & $342.27/share (Volume Sentiment: Buyers, 1.46:1) price levels.
DIA ETF’s Price:Volume Sentiment Over The Past 1-2 Years
Uranium (URA), Oil & Gas (DIG), Natural GAS (FCG) & Semiconductors (SMH) Are All Bullishly Leading The Market
URA, the Global X Uranium ETF has gained +35.74% over the past year, including a gain of +47.68% from their 52-week low in March of 2023 (ex-distributions).
URA ETF – Global X Uranium ETF’s Technical Performance Over The Past Year
Their RSI is returning from overbought territory & trending back towards neutral following the declines of Wednesday & Thursday’s session & their MACD looks set for a bearish crossover early next week.
Volumes spiked +121.12% over the past week compared to the average for the year prior, as investors were getting excited as URA reached a new 52-week high on Thursday & some profits were taken on Friday.
Wednesday’s high declining volume that preceded the new 52-week high is a cause for concern though & shows that investors are beginning to lose enthusiasm for URA in the near-term, atop the profit taking that we saw on Friday.
Monday opened the week up on a strong note for URA, but Tuesday’s session resulted in a bearish harami, which was confirmed during Wednesday’s wild decline session, where investors were selling in droves & prices dipping beneath the support of the 10 day moving average during the session.
Thursday the sellers took back over & pushed the new 52-week high, but the session resulted in a shooting star candle, signaling hesitancy on the part of market participants & setting the stage for Friday’s selloff into the weekend that closed just above the 10 day moving average.
URA offers a 0.18% distribution yield, which will not protect much against losses & so it would be a wise time to consider trimming profits or to look into a hedging strategy using options such as selling calls or buying puts.
The 10 DMA will be an important support level to watch in the coming week, and URA’s Average True Range suggests that we will see a consolidation in the coming week as it looks to revert back towards its mean.
URA has support at the $26.96 (10 Day Moving Average; VolumeSentiment: Buyers,1.31:1), $25.71 (Volume Sentiment: Buyers, 1.19:1), $23.99 (50 Day Moving Average; Volume Sentiment: Buyers, 1.79:1) & $23.86/share (Volume Sentiment: Buyers, 1.79:1) price levels, with resistance at the $27.27 (Volume Sentiment: Buyers, 1.31:1) & $28.42 (52-Week High; Volume Sentiment: Buyers, 24:1) price levels.
DIG, the ProShares Ultra Oil & Gas ETF has climbed +40.92% over the past year, adding +47.09% since their 52-week low in September of 2022 (ex-distributions).
DIG ETF – ProShares Ultra Oil & Gas ETF’s Technical Performance Over The Past Year
Their RSI is neutral at 50.97, but their MACD has been bearish for the last couple of weeks following their last decline in mid-September.
Volumes dropped -49.75% last week compared to the average volume for the year prior, signaling that investors have become wary of their near-term future & value.
Monday’s session showed a revived enthusiasm following a week & a half long decline for DIG, but Tuesday’s session formed a bearish harami pattern with a spinning top candlestick, confirming the uncertainty that we see in the volume.
Wednesday was a gap up that was able to open above the support of the 10 day moving average, which while it came as a surprise makes sense given the day prior’s session did close higher than the open, despite being a declining day.
Thursday’s shooting star candlestick was the foreshadowing for the risk off Friday session, where prices closed below the 10 DMA’s support & showed that investors were thinking of even lower based on the lower shadow of the candle.
DIG’s Average True Range suggests that we will be seeing a consolidation move this week & with only a 0.59% distribution yield it would be worth considering hedging options for any positions in DIG.
Their 50 DMA will prove to be an interesting level of support in the near-term now that their 10 DMA is pushing downward while applying resistance to their share-price.
DIG has support at the $43 (VolumeSentiment: Buyers, 1.43:1), $42.72 (Volume Sentiment: Buyers, 1.43:1), $42.26 (Volume Sentiment: Buyers, 1.43:1) & $42.19/share (Volume Sentiment: Buyers, 1.43:1) price levels, with resistance at the $43.46 (Volume Sentiment: Buyers, 1.43:1), $43.82 (10 Day Moving Average; Volume Sentiment: Buyers, 1.43:1), $43.88 (Volume Sentiment: Buyers, 1.43:1) & $44.58/share (Volume Sentiment: Sellers, 1.13:1) price levels.
FCG, the First Trust Natural Gas ETF advanced 17.92% over the past year, adding +27.9% since their 52-week low in March of 2023 (ex-distributions).
FCG ETF – First Trust Natural Gas ETF’s Technical Performance Over The Past Year
Their RSI is neutral at 51.1 & their MACD is currently bearish, but is making an attempt at a bullish crossover following Wednesday’s gap up session.
Volumes fell a dramatic -73.86% last week below average compared to the year prior, indicating that market participants are feeling very reserved & unsure about the near-term for FCG.
Monday kicked off strong with a bullish engulfing candle that was followed Tuesday by a shooting star that while it was a red candle did close higher than it opened & the upper shadow tested higher, but was stopped short of the resistance of the 50 day moving average.
Wednesday’s gap up opened right in the cradle that was created by the 10 DMA crossing bearishly through the 50 DMA, but Thursday’s spinning top set the stage for the declines seen on Friday’s session as the already indecisive investors showed even more uncertainty with the day’s price action.
Friday resulted in a decline, but the lower shadow of the candle for the day was supported by the 50 day moving average, which will be an important level to watch as this week unfolds, especially as their 10 DMA is declining at such a steep angle.
FCG’s ATR indicates that there is a cool down period on the near-term horizon & while they provide a 3.2% distribution yield to long-term holders that serves as some cushion against losses, it looks like a hedging strategy in the near-term is worth looking into.
FCG has support at the $25.85 (50 Day Moving Average; VolumeSentiment: Buyers, 1.38:1), $25.72 (10 Day Moving Average; Volume Sentiment: Buyers, 1.38:1), $25.68 (Volume Sentiment: Buyers, 1.38:1) & $25.45/share (Volume Sentiment: Buyers, 1.38:1) price levels, with resistance at the $26.48 (Volume Sentiment: Buyers, 2.5:1), $26.68 (Volume Sentiment: Buyers, 2.5:1), $27.23 (Volume Sentiment: ) & $27.66 (52-Week High; Volume Sentiment: Sellers, 1.25:1) price levels.
SMH, the VanEck Vectors Semiconductors ETF has climbed +56.07% over the past year, notching an impressive +73.66% since their 52-week low in October of 2022 (ex-distributions).
SMH ETF – VanEck Vectors Semiconductors ETF’s Technical Performance Over The Past Year
Their RSI is trending back towards neutral at 44.77 after being near oversold earlier in September, while their MACD is bearish but looking primed to attempt a break at a bullish crossover in the coming few days.
Volumes were +5.2% higher than average compared to the year prior this past week, as investors were ready to slow the bleeding of the past month & began to buy back into SMH.
Monday kicked the week off on a bullish note, but Tuesday the declines resumed as prices were stuck in a tight range that began last Thursday.
Wednesday saw a spark of skeptical optimism as the session closed in a dragonfly doji, enabling Thursday’s session to break upward & test the resistance of the 10 day moving average, which it was able to close above & its upper shadow signaled that there was appetite for higher prices.
Friday’s candlestick paints a bearish picture for next week however, as despite the day gaining +0.48%, the price closed lower than the open & while the candle was not a proper shaped spinning top, the shadows & body all signal a tight range, mostly due to the threat of a government shutdown fears.
SMH provides a 0.83% distribution yield for long-term investors, which is not much in terms of protection against declines, so a hedging strategy would be appropriate for any existing positions in the near-term, especially as we see how strong the support of the 10 day moving average will be in the coming week.
Their Average True Range sits currently right about at its mean, signaling that they will likely move at the will of the major indexes in the coming weeks, adding to the need for protection against near-term losses as it appears as though the decline is set to continue or at the very least prices will consolidate into a range following the declines of September.
SMH has support at the $143.46 (10 Day Moving Average; VolumeSentiment: Buyers, 1.2:1), $142.98 (Volume Sentiment: Buyers, 1.2:1), $139.76 (Volume Sentiment: NULL; 0:0*) & $133.54/share (50 Day Moving Average; Volume Sentiment: Buyers, 1.6:0*) price levels, with resistance at the $146.27 (Volume Sentiment: Sellers, 1.18:1), $146.83 (Volume Sentiment: Sellers, 1.18:1), $150.71 (50 Day Moving Average; Volume Sentiment: Buyers, 2.11:1) & $151.71 (Volume Sentiment: Buyers, 2.11:1) price levels.
Mexico (MEXX), Healthcare (CURE), Utilities (VPU) & Net Lease Real Estate (NETL) Are All Bearishly Lagging The Market
MEXX, the Direxion Daily MSCI Mexico Bull 3x Shares ETF has advanced a remarkable +104.6% over the past year, including +94.01% since their 52-week low in September of 2022, however since their 52-week high in July of 2023 they have declined -33.73% (ex-distributions).
MEXX ETF – Direxion Daily MSCI Mexico Bull 3x Shares ETF’s Technical Performance Over The Past Year
Their RSI is bouncing back from near the oversold level of 30 & currently sits at 35.34, while their MACD is still bearish but attempting to make a bullish crossover in the coming week.
Trading volumes last week were -12.75% below average compared to the year prior, signaling uncertainty among investors for MEXX.
One thing of note, the only advancing session of the week’s volume was less than half of the volume for the nearest declining day of the week, so it appears investors are still not convinced of MEXX in the near-term, but the selling pressure is beginning to ease, or most of the folks who wanted to get out of the pool since their 52-week high have done so.
Monday kicked the week off with a declining session on a gap down where the upper shadow signals there was an attempt to break higher, but the close near the $24 mark shows that sentiment waned near immediately & the bears still have control.
Tuesday the declines continued until Wednesday’s session’s hammer candle was able to stop the bleeding & force prices higher on Thursday.
Thursday’s gains though should be viewed skeptically, as the low volume does not express a change in investor sentiment.
Friday attempted to open higher & continue the run, but shutdown fears forced a risk off environment that led to the day’s decline of -2.21%.
MEXX offers a 1.89% distribution yield for long-term shareholders, but this only provides so much cushion against losses & a hedging strategy in the near-term would be advised.
MEXX has support at the $22.62 (VolumeSentiment: Sellers, 1.5:1), $22.18 (Volume Sentiment: Sellers, 1.5:1), $21.13 (Volume Sentiment: Buyers, 1.2:1) & $20.99/share (Volume Sentiment: Buyers, 1.48:1) price levels, with resistance at the $23.22 (Volume Sentiment: Sellers, 1.44:1), $24.31/2 (2 Touch-Points; Volume Sentiment: Buyers, 1.28:1), $24.72 (10 Day Moving Average; Volume Sentiment: Buyers, 1.28:1) & $24.95 (Volume Sentiment: Buyers, 1.28:1) price levels.
CURE, the Direxion Daily Healthcare Bull 3x Shares ETF has nudged forward +2.5% over the past year, including a +9% gain since their 52-week low in October of 2022, but has dropped -31.94% from their 52-week high in December of 2022 (ex-distributions).
CURE ETF – Direxion Daily Healthcare Bull 3x Shares ETF’s Technical Performance Over The Past Year
Their RSI is trending towards oversold & sits at 32.5, while their MACD trends further bearishly.
Last week’s trading volume was -17.55% below average compared to the year prior, indicating that many investors who wanted to sell may have unloaded their shares following a month-long decline, but the lack of meaningful advancing volume does not indicate that the pain is over just yet.
Monday opened on a bullish note, before Tuesday & Wednesday featured more declines, with Wednesday’s wide-range session seeing the most volume, which given the length of the lower shadow on the candle has further bearish implications in the near-term.
Thursday’s shooting star narrowly missed creating a harami pattern as its upper shadow broke over the day prior’s range, but the light volume was not enough to push other bulls back into new positions, leading to the further declines seen on Friday.
CURE offers a 1.83% distribution yield, which does not provide much protection from losses, making it worth considering hedging options for existing positions that do not want to be closed.
Their ATR suggests that there may be a brief consolidation & cool down in the coming week, following a month of losses, which will make it important to keep an eye on the resistance that the 10 day moving average is providing throughout the week to see how prices behave in relation to it.
CURE has support at the $87.49 (VolumeSentiment: Sellers, 0.5:0*), $86.03 (Volume Sentiment: Sellers, 3.3:0*), $85.53 (Volume Sentiment: Buyers, 1.22:1) & $85.44/share (Volume Sentiment: Buyers, 1.22:1) price levels, with resistance at the $90.99 (Volume Sentiment: Buyers, 2.07:1), $92.03 (10 Day Moving Average; Volume Sentiment: Sellers, 11:1), $93.35 (Volume Sentiment: Buyers, 2:1) & $95.55/share (Volume Sentiment: Sellers, 1.6:1) price levels.
VPU, the Vanguard Utilities ETF has fallen -9.08% over the past year, declining -20.64% from their 52-week high in December of 2022, while reclaiming +0.62% since their 52-week low in September of 2023 (ex-distributions).
VPU ETF – Vanguard Utilities ETF’s Technical Performance Over The Past Year
Their RSI is oversold at 24.62 & their MACD is still in bearish decline.
Volumes last week were +65.02% above average compared to the year prior, mostly due tot he declining sessions of Wednesday & Thursday, as well as the attempted recovery in Friday’s session.
VPU is near its 52-week low, following a ~-6.22% decline during the week, where Friday’s session was able to slow the bleeding, but also did not finish with future bullish implications.
While the day closed +0.24%, the session’s close was below its open & the lower shadow of the day’s candle went lower than the low of Thursday, signaling that market participants are still not ready to turn bullish on VPU.
While they offer a 3.66% distribution yield to long-term holders, this does not look like a safe time to enter a position & existing positions would benefit from a hedging strategy put in place while market participants establish where they value VPU.
Their ATR signals that there may be a consolidation in the near-term, but does not signal that the losses will be over anytime soon.
VPU has support at the $127.45/share (52-Week Low; VolumeSentiment: Buyers, 3:1) price level, with resistance at the $130.60 (Volume Sentiment: Sellers, 1.25:1 ), $131.78 (Volume Sentiment: Sellers, 1.25:1), $134.33 (10 Day Moving Average; Volume Sentiment: Sellers, 1.2:1) & $135.77/share (Volume Sentiment: Sellers, 1.2:1) price levels.
NETL, the Fundamental Income Net Lease ETF has dipped -0.99% over the past year, losing -22.53% from their 52-week high in February of 2023 & regaining +1.52% since their 52-week low in September of 2023 (ex-distributions).
NETL ETF – Fundamental Income Net Lease ETF’s Technical Performance Over The Past Year
Their RSI is oversold at 27.82, with a MACD that is beginning to curl bullishly, but is a long way from making a bullish crossover.
Volumes last week were -24.05% below average compared to the year prior, indicating that market participants are not feeling particularly optimistic about NETL at this time.
Monday the week kicked off on a sour note, with a gap down session that was able to reclaim some of the open’s losses with a slightly higher close, but bad feelings were in the air.
Tuesday it continued with another gap down session that covered a wide price range before Wednesday’s declines set the floor in for the rest of the week.
Thursday attempted an advance, but resulted in a harami pattern & set the stage for Friday’s slightly up session that closed lower than it opened, and also featured a longer lower shadow than upper, indicating that investors are still very much on the fence about the near-term value of NETL.
NETL offers a 5.29% distribution yield, which provides some protection against losses, but is still not enough to warrant an entry to a new position at this time & hedging options should be explored for any existing positions, especially as they are just off of their 52-week low.
NETL has support at the $21.24/share (52-Week Low; VolumeSentiment: Sellers, 1.5:1) price level, with resistance at the $21.65 (Volume Sentiment: Sellers, 1.5:1), $21.75 (Volume Sentiment: Sellers, 1.5:1), $21.99 (Volume Sentiment: Sellers, 1.5:1) & $22.16/share (10 Day Moving Average; Volume Sentiment: Sellers, 1.76:1) price levels.
The Week Ahead
Monday starts the week off with ISM Manufacturing & Construction Spending data both at 10 am.
There are no major earnings reports scheduled for Monday.
Job Openings Data is released at 10 am on Tuesday, with McCormick & Company & Cal-Maine Foods due to report earnings.
Wednesday starts with ADP Employment data at 8:15 am, followed by Factory Orders & ISM Services data at 10 am.
AngioDynamics, Helen of Troy, Resources Connection, RPM & Tilray are all due to report earnings on Wednesday.
Initial Jobless Claims & the U.S. Trade Deficit data are set to be reported at 8:30 am on Thursday.
Lamb Weston, Conagra, Constellation Brands & Levi Strauss are all scheduled to report earnings on Thursday.
Friday the week winds down with the U.S. Employment Report, U.S. Employment Rate, U.S. Hourly Wages & Hourly Wages Year-over-Year at 8:30 am before Consumer Credit data is reported at 3 pm & there are no noteworthy earnings reports scheduled for the day.
See you back here next week!
*** I DO NOT OWN SHARES OR OPTIONS CONTRACT POSITIONS IN SPY, QQQ, IWM, DIA, URA, DIG, FCG, SMH, MEXX, CURE, VPU, or NETL AT THE TIME OF PUBLISHING THIS ARTICLE ***
SPY, the SPDR S&P 500 ETF declined -2.98% over the past week, in a week that saw lots of risk-off behavior among market participants.
SPY ETF – SPDR S&P 500 ETF’s Technical Performance Over The Past Year
Their RSI is currently hovering above oversold territory at 33.17, but their MACD is in bearish freefall following last week’s declines.
Volumes were -6.23% below average compared to the year prior (78,641,179 vs. 83,867,006), which is mostly attributed to the first two sessions of the week.
Monday the week kicked off on a spinning top that couldn’t penetrate the resistance of the 10 & 50 day moving averages as the week kicked off on a note of uncertainty.
Tuesday resulted in a dragonfly doji & Wednesday opened higher at the 10 DMA’s resistance level, but was a day of declines for the S&P 500, closing lower than Tuesday’s candle’s lower shadow indicating that market participants were feeling more cautious & risk off.
Thursday this sentiment was confirmed as SPY gapped down with hardly much upper shadow on the day’s candlestick on the highest volume of the week, as investors were eager to hop out of the pool. following the Federal Reserve announcement & Chariman Powell’s Press Conference.
Friday the declines continued as market participants did not want to carry much risk into the weekend, which was confirmed by the day’s volume being just lower than that of Thursday’s.
SPY’s Average True Range indicates that there may be a period of consolidation in the coming week at these new recent lows, however this is hard to judge due to the limited support that they have at these price levels, having just broken below the major level that was holding up the price action of the previous month.
It will be all eyes on the 200 Day Moving Average moving forward as SPY looks to find some footing for support.
SPY has support at the $415.11 (200 Day Moving Average; Volume Sentiment: Buyers, 1.6:1), $414.61 (Volume Sentiment: Buyers, 1.6:1), $413.72 (Volume Sentiment: Buyers, 1.6:1) & $404.13/share (Volume Sentiment: Sellers, 1.82:1) price levels, with resistance at the $431.49 (Volume Sentiment: Sellers, 1.1:1), $441.52 (10 Day Moving Average; Volume Sentiment: Buyers, 2.43:1), $445.37 (50 Day Moving Average; Volume Sentiment: Buyers, 1.45:1) & $452.08/share (Volume Sentiment: Buyers, 1.25:1) price levels.
Price:Volume Sentiment For SPY ETF Over The Past 1-2 Years
QQQ, the Invesco QQQ Trust ETF fell -3.44% over the past week, as the risk-off sentiment struck the tech-heavy NASDAQ index the hardest.
QQQ ETF – Invesco QQQ Trust ETF’s Technical Performance Over The Past Year
Their RSI is trending towards oversold at 35.73 & their MACD has been bearish for over the past week.
Volumes were -12.37% below average compared to the year prior (48,223,528 vs. 55,031,426), indicating some uncertainty among market participants, particularly on the bookend days of the week which happened to be the only advancing days (Monday had lowest volume of week, Friday had second highest).
Monday opened up the week on a cautious, but optimistic note as the session was green, but the volume was very light, which was confirmed Tuesday with a hanging man candlestick.
Wednesday opened just above the range of Tuesday’s shadow while testing the 10 DMA, but resulted in a large decline that engulfed Tuesday’s candle bearishly, setting the stage for Thursday.
Thursday’s gap down session was the strongest volume of the week as investors decided that QQQ could not break through the resistance of the 10 DMA the day prior.
Friday closed the week out on a rather ominous note, with a bullish session whose close was lower than its open & the shadows of the day’s range match the shadows of Thursday’s candle.
QQQ’s ATR may help to prop prices up in the next day or two, but after the first two days are removed from the calculation there is room to run lower while reverting back to the ATR’s mean, as then the furthest out inputs to the calculation would be within the most recent consolidation range or lower.
$357.07/share will be an area to watch as it is the last support level before the 200 DMA at $327.50 (-8.3% lower), which would expose QQQ to further, more violent declines in the near-term.
QQQ has support at the $357.07 (Volume Sentiment: Sellers, 2.57:1), $327.50 (Volume Sentiment: Buyers, 2.48:1), $312.31 (Volume Sentiment: Sellers, 2:1) & $307.92/share (Volume Sentiment: Buyers, 1.04:1) price levels, with resistance at the $358.06 (Volume Sentiment: Sellers, 2.57:1), $369.02 (10 Day Moving Average; Volume Sentiment: Buyers, 8.2:1), $371.80 (Volume Sentiment: Buyers, 8.2:1) & $371.85/share (50 Day Moving Average; Volume Sentiment: Buyers, 8.2:1) price levels.
Price:Volume Sentiment For QQQ ETF Over The Past 1-2 Years
IWM ETF – iShares Russell 2000 ETF’s Technical Performance Over The Past Year
Their RSI dipping into oversold territory at 29.29, with their MACD continuing to be bearish throughout the better part of September.
Volumes were -10.39% below average compared to the year prior (25,139,418 vs. 28,054,233) in the week that was five consecutive sessions of declines, mostly due to Monday & Friday’s sessions being on weak volume.
Monday’s session barely broke down through the support of the 200 DMA, while Tuesday opened in line with it, only to attempt to reach the 10 DMA (upper shadow) & ultimately decline to close below the 200 DMA’s resistance & test lower price levels (lower shadow).
Wednesday again tried to test the 10 DMA’s resistance unsuccessfully, after opening at the 200 DMA & resulted in a close well below the moving average.
Thursday’s gap down following the Fed announcement & press conference was the strongest volume of the week (Wednesday’s volatile session was second strongest), with Friday showing more risk-off sentiment by market participants, as prices drifted lower after being unable to break above Thursday’s session’s open.
Much like QQQ’s ATR, IWM’s ATR is signaling that there is a chance of a 2-4 day consolidation at these levels before we resume the descent, but things still are looking prepared to move further to the downside.
IWM has support at the $175.34 (Volume Sentiment: Buyers, 1.3:1), $174.23 (Volume Sentiment: Buyers, 1.3:1), $172.20 (Volume Sentiment: Sellers, 1.9:1) & $169.25/share (Volume Sentiment: Sellers, 1.6:1) price levels, with resistance at the $179.28 (Volume Sentiment: Sellers, 1.19:1), $181.61 (Volume Sentiment: Sellers, 1.02:1), $181.83 (10 Day Moving Average; Volume Sentiment: Sellers, 1.02:1) & $182.36/share (200 Day Moving Average; Volume Sentiment: Buyers, 1.08:1) price levels.
Price:Volume Analysis Of IWM ETF Over The Past 1-2 Years
DIA ETF – SPDR Dow Jones Industrial Average ETF’s Technical Performance Over The Past Year
Their RSI is trending towards oversold at 36.13, with a MACD that’s been in bearish territory for the better part of the last two months.
Volumes declined -16.56% last week compared to the average for the year prior (3,018,586 vs. 3,617,642), mostly due to the first two days of the week, confirming that the weakness shown from Wednesday on is likely to continue in the near-term.
Monday resulted in a spinning top, signaling indecision as prices were just supported by the 10 day moving average & unable to test the 50 DMA.
Tuesday set the stage for declines with a hanging man candlestick that was held down by the resistance of the 10 DMA, followed by Wednesday’s attempt to test the 50 DMA after opening at the 10 day moving average, but resulting in a down day below the resistance of the 10 DMA.
Thursday resulted in a gap down & Friday’s session continued that sentiment as market participants are showing signs of being uneasy about the near-term environment.
DIA’s ATR is signaling that there may be some form of a cool off consolidation or at least a more “controlled burn” decline to come in the near-term as they look primed to test the support of the 200 DMA in the coming week.
DIA has support at the $339.45 (Volume Sentiment: Buyers, 1.32:1), $339.42 (Volume Sentiment: Buyers, 1.32:1), $338.71 (Volume Sentiment: Buyers, 1.32:1) & $338.38/share (Volume Sentiment: Buyers, 1.32:1) price levels, with resistance at the $342.27 (Volume Sentiment: Buyers, 1.46:1), $344.05 (Volume Sentiment: Buyers, 1.54:1), $344.92 (10 Day Moving Average; Volume Sentiment: Buyers, 1.54:1) & $347.56/share (50 Day Moving Average; Volume Sentiment: Buyers, 1.54:1) price levels.
Price:Volume Sentiment For DIA ETF Over The Past 3-4 years
India Growth Leaders (GLIN), Emerging Markets Dividends (EDIV), Energy Momentum (PXI) & Insurance (KIE) Are All Bullishly Leading The Market
GLIN ETF – VanEck Vectors India Growth Leaders ETF’s Technical Performance Over The Past Year
Their RSI is just above neutral at 55.1, with a MACD that is in bearish decline following profit taking from their recent 52-week high.
Volumes were +66.66% above average last week compared to the year prior (17,344 vs. 10,406.68), with the highest volume days occurring on Monday & Thursday, both of which were declining days where investors were collecting their profits from the run up that’s taken place over the past 6 months.
Monday’s session opened above the 10 day moving average, but was unable to find support at it despite moving higher to approach the $39.50-mark during the session & the selling pressure pushed the price below the 10 DMA.
Tuesday’s session was able to break out slightly above the 10 DMA’s resistance, but Wednesday saw the share price tumble back beneath the 10 DMA’s resistance.
The open:close price action for Wednesday & Monday’s declines were all concentrated in the lower half of the candlestick, which signals investor sentiment is to the downside.
Thursday’s session resulted in a gap down spinning top candlestick, indicating that investors are feeling bearish, but unsure about where to value GLIN’s price with the open & close being very close to one another (but too spread out to be a doji).
Friday the week ended on another narrow spinning top candlestick, as investors were willing to take a slight bit of risk, but the mood still looks bearish at worst & uncertain at best for the near-term.
GLIN offers a 1.43% distribution yield for long-term holders of their shares, which is not much protection against moves to the downside, which means it would be wise for investors to take some profits & or use a hedging strategy with options such as selling calls or buying puts for the near-term.
Their Average True Range (ATR) indicates that there may be a new consolidation range built around the range of Thursday & Friday’s candlesticks, but investors should keep their eyes peeled on the 50 day moving average & how prices begin to behave around it.
If it serves as adequate support the consolidation range sounds likely, however if it fails to hold up which the price:volume sentiment indicates is a strong possibility there will be further declines from the 52-week high.
GLIN has support at the $38.38 (Volume Sentiment: Buyers, 1.07:1), $37.72 (50 Day Moving Average; Volume Sentiment: Sellers, 1.28:1), $37.62 (Volume Sentiment: Sellers, 1.28:1) & $36.78/share (Volume Sentiment: Sellers, 1.74:1) price levels, with resistance at the $39.04 (10 Day Moving Average; Volume Sentiment: Sellers, 1.24) & $39.62 /share (Volume Sentiment: Sellers, 1.24) price levels.
Price:Volume Sentiment For GLIN ETF Over the Past 7-8 Years
EDIV ETF – SPDR S&P Emerging Markets Dividend ETF’s Technical Performance Over The Past Year
Their RSI is sitting on the overbought end of neutral at 57.43 & their MACD looks primed to crossover bearishly in the coming week as it is barely hovering in a bullish position.
Volumes last week skyrocketed +71.01% above average compared to the year prior (58,068.75 vs. 33,956.08) led by Tuesday’s bullish session & Thursday’s bearish session.
Tuesday’s volume spike seems to be more of a last resort pump to try to keep the price above the 10 day moving average & not a signal of strength, which is confirmed by their dragonfly doji & the rest of the week’s performance.
Monday the week kicked off with a shooting star candlestick that opened around the 10 DMA & closed slightly higher than the open, but it was still a seller dominated session that resulted in a decline with the indecision indicated by the day’s candlestick being echoed into the week.
Tuesday’s dragonfly doji candle continued the message of uncertainty, but was able to stay above the support of the 10 DMA, but Wednesday’s shooting star candlestick paved the way for the decline below the 10 DMA that occurred on Thursday.
Thursday’s gap down session was supported near-perfectly by the 50 DMA, with the 10 DMA providing resistance for the upper shadow of the candle.
Friday resulted in a bullish session, but the shooting star spinning top candlestick implies that there is still great uncertainty about EDIV’s valuation & signals to expect further near-term declines, particularly if the week opens below the 10 DMA, at which point attention will shift to how strong the 50 DMA can hold up (buyer dominated price zone, but sitting atop 2 seller dominated zones in the chart below).
EDIV offers a 4.65% distribution yield for long-term holders, which does provide some cushion against losses, but it would be wise to explore options for hedging against more near-term declines as they cool off from their 52-week high.
Their ATR is indicating that there will likely be a dip below the 50 DMA in either a consolidation range & or a steeper decline in the coming weeks, which is important as after that price level the nearest support is ~3.2% lower.
EDIV has support at the $30 (10 Day Moving Average; Volume Sentiment: Buyers, 2:1), $29.63 (50 Day Moving Average; Volume Sentiment: Buyers, 1.43:1), $28.67 (Volume Sentiment: Sellers, 1.09:1) & $28.44/share (Volume Sentiment: Sellers, 1.09:1) price levels, with resistance at the $30.38 (Volume Sentiment: Buyers, 2:1) & $31.16/share (Volume Sentiment: Sellers, 1.1:1) price levels.
Price:Volume Sentiment For EDIV ETF Over The Past 12-13 Years
PXI, the Invesco DWA Energy Momentum ETF has improved +24.68% over the past year, including a +26.85% climb from their 52-week low in May of 2023 (ex-distributions).
PXI ETF – Invesco DWA Energy Momentum ETF’s Technical Performance Over The Past Year
Their RSI is just below the neutral 50-mark at 47.86, with their MACD being bearish after the declines from the high of early September as investors began to take profits following the 3-4 month run up.
Volumes tumbled -25.28% below average last week compared to the year prior (29,008 vs. 38,820) in a sign that there is not much confidence in the market & investors are unsure as to where they value PXI shares.
Monday’s session kicked off with a spinning top candlestick that was able to be supported by the 10 day moving average before Tuesday opened with a sign of optimism near the top of Monday’s candle’s upper shadow.
The mood soured as they broke through the support of the 10 day moving average in a session that covered a wide range of prices.
Wednesday’s candle attempted to test the 10 DMA but was unable to, with the day’s open & closing prices being concentrated on the lower end of the candlestick & a small shadow below it indicating that investors were eying further declines.
Thursday the declines continued over a rather wide range of prices & Friday’s candlestick formed a harami with Thursday’s.
While Friday’s session opened above the close of Thursday’s, the close was below the open for the day, indicating further weak sentiment among market participants as the 10 DMA was moved further away from & became more bearish.
The 50 DMA will be an area to watch in the coming week, as it has begun to curl over & signal a bearish sentiment in the coming days, particularly if the resistance of the 10 DMA continues pushing pressure down on PXI’s share price.
While they offer a 2.79% distribution yield for long-term holders, a hedging strategy would be advised in the near-term while waiting to see how their support levels hold upas a means of protection.
Their ATR implies that there may be a consolidation range forming in the near-term, however if the support of the 50 DMA is unable to hold up (particularly over the next 4-8 sessions) there is room to dive further down.
PXI has support at the $44.85 (2 Touch-Points In Last 52-Weeks; Volume Sentiment: Buyers, 1.33:1), $44.81 (Volume Sentiment: Buyers, 1.33:1), $44.45 (Volume Sentiment: Buyers, 1.33:1) & $44.22/share (50 Day Moving Average, 2 Touch-Points In Past 52-Weeks; Volume Sentiment: Buyers, 1.33:1) price levels, with resistance at the $45.21 (Volume Sentiment: Buyers, 2.67:1), $46 (10 Day Moving Average; Volume Sentiment: Sellers, 2.75:1), $46.07 (Volume Sentiment: Sellers, 2.75:1) & $47.20/share (Volume Sentiment: Buyers, 3.33:1) price levels.
Price:Volume Sentiment For PXI ETF Over The Past 3-4 Years
KIE, the SPDR S&P Insurance ETF has gained +21.61% over the past year, adding +22.56% from their 52-week low in September of 2022 (ex-distributions).
KIE ETF – SPDR S&P Insurance ETF’s Technical Performance Over The Past Year
Their RSI is on the overbought end of neutral at 59.74, while their MACD is still bullish but beginning to signal a bearish crossover is to come in the next few days.
Volumes dipped -6.99% below average last week compared to the year prior (959,227.5 vs. 1,031,362.59), an indication of lackluster enthusiasm by investors, even as they hit a fresh 52-week high on Wednesday.
Monday kicked the week off on a bullish note following Friday’s bearish doji, although the lower shadow did dip lower than the lower shadow of Friday’s candle.
Tuesday the climb continued with a small gap up & investors were interested in seeing KIE reach new highs as the upper shadow went up to $43.92/share, but the close of the day was lower at $43.83.
Tuesday led the week in volume.
Wednesday opened lower & a shooting star candle was formed as the new 52-week high was hit, but the day’s close was much lower & narrowly above the close of Tuesday’s session.
The weak volume on Wednesday compared to Tuesday (~66%) also confirmed the bearish sentiment behind the shooting star candle, as despite hitting the new high there was very limited enthusiasm among market participants.
Thursday featured low volume (similar to Wednesday) profit taking by those who hadn’t done so the day prior, which led to the decline into Friday, where an inverted hammer candlestick was able to be supported by the 10 day moving average.
As we’ve see with the other names so far in this weekend’s bullish section, there will likely be a retest or two of this support in the coming days, with a support zone falling in the $43.27-31 range.
Their ATR is indicating that a reversion to its mean would require further declines in the coming sessions, which sets the stage for the bearish head & shoulders pattern that has been emerging on their chart since August & will be something to keep a close eye on in the next few weeks.
KIE offers a 1.64% distribution yield to long-term holders of the security, which is limited protection against losses, making it important to explore hedging options & taking some profits while waiting to see how this support zone holds up.
KIE has support at the $43.31 (Volume Sentiment: Buyers, 2:1), $43.27 (10 Day Moving Average; Volume Sentiment: Buyers, 2:1), $42.42 (Volume Sentiment: Sellers, 1.2:1) & $42.40/share (50 Day Moving Average; Volume Sentiment: Sellers, 1.2:1) price levels, with resistance at the $43.82 (Volume Sentiment: Buyers, 2:1) & $44.13/share (52-Week High; Volume Sentiment: NULL, 0:0*) price levels.
Price:Volume Sentiment For KIE ETF Over The Past 16-17 Years
Retail (RETL), 7-10 Year Treasuries (TYD), Industrials (DUSL) & Global Wind Energy (FAN) Are All Bearishly Lagging The Market
RETL, the Direxion Daily Retail Bull 3x Shares ETF has fallen -18.78% over the past year, dropping -58.3% from their 52-week high in February of 2023, but reclaiming +11.79% from their 52-week low in June of 2023 (ex-distributions).
RETL ETF – Direxion Daily Retail Bull 3x Shares ETF’s Technical Performance Over The Past Year
Their RSI is floating just above the oversold level of 30 at 30.65, while their MACD has been bearish since the beginning of the month of September.
Volumes dropped -22.01% below average last week compared to the year prior (368,925 vs. 473,029) as a sign of uncertainty amid a week of five consecutive declining sessions.
Monday kicked off with a declining session that opened just below Friday’s close & began sliding down immediately, as there is no upper shadow on the day’s candlestick.
Monday dipped below the support of the 10 DMA & investors favored the downside as indicated by the lower shadow on the day’s candle.
Tuesday provided the most clues about investor sentiment, as it was the highest volume day of the week & resulted in a doji whose upper shadow barely broke above the day prior’s close, signaling a lot of price movement in a narrow range (compared to the prior 4 sessions) that ultimately resulted in a narrow close & open as investors sit in uncertainty
Wednesday prices tried to make a run for the 10 DMA’s resistance level, but were cut short around the $6 mark & the day closed out below the low of Tuesday’s session.
Thursday & Friday the declines continued to the $5.50 mark, with only the 52-week low $4.87/share remaining as support for RETL from the past year’s prices.
While they offer a 2.04% distribution yield for long-term holders that can provide some cushion, this looks like there may be more declines on the horizon for RETL.
Their ATR is signaling that we may see a brief consolidation range over the next 4-6 days as higher priced sessions are dropped from the calculation in favor of lower prices ones, before seeing declines continue.
This will be especially true if the 10 DMA comes closer to the price but serves as solid resistance over it.
RETL has support at the $4.87/share (52-Week Low; Volume Sentiment: NULL, 0:0*) price level, with resistance at the $5.66 (Volume Sentiment: Buyers, 1.3:1), $5.81 (Volume Sentiment: Buyers, 1.3:1), $5.88 (Volume Sentiment: Buyers, 1.3:1) & $5.91/share (Volume Sentiment: Buyers, 1.3:1) price levels.
Price:Volume Sentiment For RETL ETF Over The Past 1-2 Years
TYD, the Direxion Daily 7-10 Year Treasury Bull 3x Shares ETF has declined -17.22% over the past year, losing -25.45% since their 52-week high in April of 2023, while regaining +1.35% from their 52-week low in September of 2023 (ex-distributions).
TYD ETF – Direxion Daily 7-10 Year Treasury Bull 3x Shares ETF’s Technical Performance Over The Past Year
Their RSI is rebounding back from oversold territory but currently sits at 34.66, while their MACD has been bearish for the last week or two.
Volumes were +23.54% higher than average last week compared to the year prior (50,213 vs. 40,646), which sends an interesting signal as they were highest on the three declining days, signaling some profit taking on Tuesday following Monday’s advancing session & the second highest volume day was Thursday’s gap down session.
Volumes are indicating that market participants are still viewing TYD bearishly & signaling that there may be a retest of the current only support level & 52-week low at $24.78.
Monday saw a day that resulted narrowly to the upside over Friday’s session’s close that was unable to break Friday’s opening price (indicated by upper shadow).
Tuesday investors were eager to pull their money out after Monday’s gains, resulting in the strongest day by volume of the week.
Wednesday was a bearish engulfing candle, that while it attempted to challenge the 10 DMA’s resistance level fell well short of it & resulted in a further decline atop Tuesday’s lowest price level & set the stage for Thursday’s gap down session.
Friday attempted to claw back some gains after that new 52-week low set Thursday & may lead into a brief consolidation range while the oscillators & indicators revert back to their means.
They offer a 2.51% distribution yield for long-term holders of the security, but with such limited upside signals currently this looks like a good opportunity to watch how it behaves near its lowest level of the past year & how it handles the downside pressure of the 10 & 50 DMAs acting as resistance.
There are 8 days in the calculation period for their ATR that occur before last Friday’s gap down, after which the price range will be lower for the last 14 days & the declines should be expected to continue after a brief pause.
Should they manage to float rangebound all of this week, things will become more interesting as four sessions later the price action before Thursday’s gap down is all removed from the calculation, enabling a more steep descent.
TYD has support at the $24.78/share (52-Week Low; Volume Sentiment: NULL, 0:0*) price level, with resistance at the $25.55 (Volume Sentiment: Sellers, 1.4:1), $25.65 (10 Day Moving Average; Volume Sentiment: Sellers, 1.4:1), $26.40 (Volume Sentiment: Sellers, 1.9:1) & $26.92/share (50 Day Moving Average; Volume Sentiment: Seller, 1.9:1) price levels.
Price:Volume Sentiment For TYD ETF Over The Past 8-9 Years
DUSL, the Direxion Daily Industrials Bull 3x Shares has gained +48.82% over the past year, while falling -24.45% since their 52-week high in August of 2023, but has managed to regain +59.64% from their 52-week low in October of 2022 (ex-distributions).
DUSL ETF – Direxion Daily Industrials Bull 3x Shares’s Technical Performance Over The Past Year
Their RSI is in oversold territory at 27.35 & their MACD has been bearish since the beginning of September.
Volumes dropped -37.25% below average last week compared to the year prior (16,213.25 vs. 25,838.86) as investors were unsure if their 200 day moving average would be able to hold up as support.
A telling signal is that Thursday’s gap down session that confirmed that the 10 & 200 DMAs are now resistance was the highest volume session of the week, as investors are lacking confidence in DUSL.
Monday’s spinning top’s open & closing prices were concentrated around the bottom of the candle, while the 10 DMA served as strong resistance against the price action.
Tuesday resulted in a hammer candlestick that was supported by the 200 DMA, but did test its support throughout the day as the shadow shows it did briefly dip below it before it closed above it.
Wednesday was the day of judgement, where prices opened at the 10 DMA, briefly tried to break above it as indicated by the upper shadow, but were forced back downward, to close below the support of the 200 DMA & to even test lower than the day’s close as indicated by the lower shadow.
Thursday investors decided in droves that they were not confident in DUSL’s current price & Friday the declines continued lower, with a brief attempt to trade above Thursday’s close (upper shadow).
DUSL pays a 1.59% distribution yield to long-term shareholders, which is not much in terms of protection against losses.
While their Average True Range is moving away from the mean throughout all of these declines, over the next 2-7 days the high level of the range will be removed from the calculation, enabling a further decline which may be triggered sooner as we see the 10 DMA is bearishly crossing through the 200 DMA on Monday.
DUSL has support at the $31.42 (Volume Sentiment: Buyers, 1.25:1), $30.78 (Volume Sentiment: Buyers, 1.16:1), $30.46 (Volume Sentiment: Buyers, 1.16:1) & $29.88/share (Volume Sentiment: Sellers, 1.61:1) price levels, with resistance at the $31.93 (Volume Sentiment: Buyers, 1.25:1), $32.06 (Volume Sentiment: Buyers, 1.14:1), $32.17 (Volume Sentiment: Buyers, 1.14:1) & $32.63/share (Volume Sentiment: Buyers, 1.14:1) price levels.
Price:Volume Sentiment For DUSL ETF Over The Past 1-2 Years
FAN, the First Trust ISE Global Wind Energy Index Fund ETF has lost -4.92% over the past year, falling -20.19% from their 52-week high in January of 2023, but has recovered +5.34% since their 52-week low in October of 2022 (ex-distributions).
FAN ETF – First Trust ISE Global Wind Energy Index Fund ETF’s Technical Performance Over The Past Year
Their RSI is trending toward oversold territory at 34.44, as their MACD hovers barely bullish & looks set for a bearish crossover in the next day or two’s sessions.
Volumes were -49.98% below average last week compared to the year prior (34,049.5 vs. 68,075.29) as investors sat unsure watching to see how close to their 52-week low they might test.
Monday kicked off with bearish gap down spinning top, setting the stage for further declines that were provided on Tuesday.
Wednesday saw a break to the upside & an attempt to close above the $15.50 mark that did not hold up & the day’s session closed just below the open of Tuesday’s.
Thursday the 10 DMA’s support was blown right through on a gap down & investors signaled they wanted to see FAN priced lower as Friday closed lower than Thursday & featured a lower shadow to the candlestick as well, indicating there is still more bearish sentiment regarding FAN.
With only 1.98% cushion in distribution yield it would be wise to watch how this behaves as it approaches its 52-week low again before entering into any position.
Their ATR is trending away from the mean, however on Wednesday two of the 7 sessions that are above the range of the current price level will be removed from the calculation, meaning we may see some form of an attempt at consolidation in the near-term before the declines are set to continue.
FAN has support at the $ 14.82(Volume Sentiment: Buyers, 3:1) & $13.97/share (Volume Sentiment: Buyers, 1.38:1) price levels, with resistance at the $14.99 (Volume Sentiment: Buyers, 3:1), $15.03 (Volume Sentiment: Buyers, 1.67:1), $15.26 (10 Day Moving Average; Volume Sentiment: Buyers, 1.67:1) & $15.43 /share (Volume Sentiment: Buyers, 1.67:1) price levels.
Price:Volume Sentiment For FAN ETF Over The Past 14-15 Years
The Week Ahead
The week kicks off Monday with no major data announcements & Thor Industries scheduled to report earnings.
Tuesday New Homes Sales are announced at 8:30 am, the S&P Case-Shiller Home Price Index (20 Cities) data is reported at 9 am, followed by Consumer Confidence at 10 am & Fed Governor Bowman speaking at 1:30 pm.
Costco Wholesale, AAR Corp., Cintas, Ferguson, MillerKnoll, TD Synnex, Progress Software & United Natural Foods are all scheduled to report earnings data on Tuesday.
Wednesday features Durable-Goods Orders & Durable-Goods Minus Transportation data at 8:30 am.
Micron Technologies, Concentrix, H.B. Fuller, Jefferies, Paychex & Worthington are all due to report earnings on Wednesday.
Initial Jobless Claims & GDP (revision) data are scheduled for 8:30 am Thursday, followed by Fed Governor Cook speaking at 1 pm & Fed Chairman Powell speaking at 4pm (conveniently right after the close).
Friday morning winds the week down with Personal Income, Personal Spending, PCE Index, Core PCE Index, PCE (Year-over-Year), Core PCE (Year-over-Year), Advanced U.S. Trade Balance In Goods, Advanced Retail Inventories & Advanced Wholesale Inventories data at 8:30 am, followed by the Chicago Business Barometer at 9:45 am & at 10 the week wraps up with Consumer Sentiment (final) data.
Carnival is scheduled to report earnings on Friday.
See you back here next week!
*** I DO NOT OWN SHARES OR OPTIONS CONTRACT POSITIONS IN SPY, QQQ, IWM, DIA, GLIN, EDIV, PXI, KIE, RETL, TYD, DUSL or FAN AT THE TIME OF PUBLISHING THIS ARTICLE ***
JETS, the U.S. Global Jets ETF has had a volatile year, climbing +17.81% from their 52-week low in September of 2022, but declining -22.67% from their 52-week high in July of 2023 (ex-distributions).
The ETF is composed of Southwest Airlines Co. (LUV, 9.98%), Delta Air Lines Inc. (DAL, 9.96%), United Airlines Holdings Inc. (UAL, 9.8%), American Airlines Group Inc. (AAL, 9.77%), Hawaiian Holdings Inc. (HA, 3.11%), Alaska Air Group Inc. (ALK, 3.07%) & more.
As broader market volatility heats up it’s worth checking in to see how buyers:sellers have interacted at the various prices that JETS has traded at in recent history (4-5 years) in order to better anticipate how they may behave in the near-future & to have an understanding of how strong support & resistance levels may be.
The Price:Volume analysis below seeks to display the volume at specific share-price levels from over the past one-to-two years & is intended to serve as a reference point for how investors viewed JETS ETF’s value at each level.
It also includes a list of moving averages, as well as support & resistance levels, which will be marked in bold.
Breaking Down The Technicals & Price:Volume Sentiment For JETS, The U.S. Global Jets ETF
JETS ETF – U.S. Global JETS ETF’s Technical Performance Over The Past Year
Their RSI is deeply oversold at 20.91, while their MACD is bearish but flattening out to attempt a bullish crossover in the coming week.
Unlike the major indexes & many of the other names that we have dug into this week, JETS has traded at +13.1% higher than average volume over the past week & a half compared to the year prior (4,314,025 vs. 3,814,177.29).
Sellers have dominated the battle since mid-July when they began a steep decline from their 52-week high, although 2 of the heaviest volume sessions in the past week & a half favored buyers.
JETS’s moving averages all are telling a foreboding message, with the 200 day moving average beginning to curl over bearishly & the 50 day moving average ready to make a death cross through it in the coming week.
The candlesticks of the past week & a half have been primarily bearish.
Last Monday the week kicked off with a spinning top signaling indecision among investors, followed by a gravestone doji on Tuesday which carries bearish implications.
Sure enough, Wednesday’s session was a gap down with a wide range & Thursday’s session opened higher than Wednesday’s, but it was barely able to break out above the prior day’s real body, tested the lows of it & ended up closing lower than it opened.
Friday resulted in another doji on higher than average volume within the past week & a half, but the mood was risk off as the close was narrowly lower than the open going into the weekend.
The decline continued on Monday, with the highest volume day of the past week & a half on a spinning top candlestick Tuesday.
Yesterday confirmed the indecision of the Tuesday when prices made a break upwards but were unable to match the resistance of the 10 DMA & the session closed out below the low of Tuesday.
Today appears to be following a similar track, as the price has declined & is sitting atop the lower Bollinger Band.
JETS’s Average True Range is moving away from its mean still, but after today’s session will take into account a larger price decline from the first week of September & we will likely see a brief consolidation range while indicators revert to their means before the decline continues.
The bold prices on the image below denote the moving average levels just listed & the bold entries in the list form of the analysis under the images include other levels of support.
Each corresponding price level using a ratio of Buyers:Sellers (or Sellers:Buyers), NULL values denote that there was not enough data, so the ratio would’ve been 0:0.
Ratios with a 0 for the denominator/constant are denoted with an *, but are reported as is, as we are accounting for volume/sentiment.
JETS, U.S. Global JETS ETF’s Resistance & Support Levels With Price:Volume Sentiment For The Past 4-5 Years
Price:Volume Sentiment For JETS, The U.S. Global Jets ETF Over The Past 4-5 Years
Price:Volume Sentiment For JETS, The U.S. Global Jets ETF Over The Past 4-5 Years
JETS, The U.S. Global Jets ETF’s Volume By Price Level Over The Past 4-5 Years
$33 – NULL – 0:0*; +88.25% From Current Price Level
$32 – NULL – 0:0*; +82.54% From Current Price Level
$31 – NULL – 0:0*; +76.84% From Current Price Level
$30 – NULL – 0:0*; +65.43% From Current Price Level
$29 – NULL – 0:0*; +65.43% From Current Price Level
$28 – Buyers – 0.7:0*; +59.73% From Current Price Level
$27 – Sellers – 1.67:1; +54.02% From Current Price Level
$26 – Buyers – 2.05:1; +48.32% From Current Price Level
$25 – Sellers – 2.23:1; +42.61% From Current Price Level
$24 – Buyers – 1.58:1; +36.91% From Current Price Level
$23 – Buyers – 1.2:1; +31.2% From Current Price Level
$22 – Buyers – 1.03:1; +25.5% From Current Price Level
$21 – Buyers – 1.2:1; +19.79% From Current Price Level
$20 – Sellers – 1.02:1; +14.09% From Current Price Level
$19.50 – Sellers – 1.67:1; +11.24% From Current Price Level – 50 Day Moving Average
$19 – Buyers – 1.08:1; +8.39% From Current Price Level – 200 Day Moving Average
$18.50 – Buyers – 1.08:1; +5.53% From Current Price Level
$18 – Buyers – 1.23:1; +2.68% From Current Price Level
$17.50 – Buyers – 1.25:1; -0.17% From Current Price Level – Current Price Level & 10 Day Moving Average
$17 – Buyers – 1.05:1; -3.02% From Current Price Level – Current Price Level
$16.50 – Sellers – 1.57:1; -5.88% From Current Price Level
$16 – Sellers – 2.33:1; -8.73% From Current Price Level
$15.50 – Buyers – 1.73:1; -11.58% From Current Price Level
$15 – Sellers – 2.7:1; -14.43% From Current Price Level
$14.50 – Even – 1:1; -17.28% From Current Price Level
$14 – Buyers – 2:1; -20.14% From Current Price Level
$13.50 – Sellers – 1.67:1; -22.99% From Current Price Level
$13 – Sellers – 2.33:1; -25.84% From Current Price Level
$12.50 – Sellers – 1.5:1; -28.69% From Current Price Level
$12 – Sellers – 1.5:1; -31.55% From Current Price Level
$11.50 – NULL – 0:0*; -34.4% From Current Price Level
$11 – NULL – 0:0*; -37.25% From Current Price Level
Tying It All Together
The list & image above paint the picture as to how investors & traders have behaved at various price levels that JETS has been at over the past four-to-five years.
It is not meant to serve as investment/trading advice, and is simply a way to visualize what investor/trader sentiment has been like at each of the price levels mentioned, as well as what it was at levels of support & resistance that are denoted in the image & list.
As always, do your own due diligence before making investing/trading decisions.
For more on the methodology on how the data was collected & put together, please refer to our original Price:Volume analysis.
*** I DO NOT OWN SHARES OR OPTIONS CONTRACT POSITIONS IN JETS AT THE TIME OF PUBLISHING THIS ARTICLE ***