Alphabet Inc. stock trades under the ticker GOOGL & has advanced +39.5% over the past year.
Their current share price (per last night’s close) is -8.9% below their 52-week high, which was achieved two days prior on 1/29/24, while their share price has recovered +58.16% since their 52-week low in February of 2023.
Given their recent fall from a 52-week high, it is beneficial to take a look at how buyers & sellers have interacted at each price level they’ve traded at in recent history to gain insight into how strong or weak support & resistance levels will be in the future.
Below is a brief technical analysis overview of GOOGL stock’s past year & recent week, along with a section that outlines the ratios listed above for each price level & notes their support & resistance levels from the past year.
It is not meant as investing advice, but rather as an extra resource to review in addition to your due-diligence process.
Please note that at price extremes, such as the recent 52-week high that there is limited data for both sides, which will skew things near tops towards the Buyers & towards Sellers near the lower end of the range.
Also, any price level that did not have enough meaningful data is denoted with a “NULL” & any ratio that has a 0 for consequent value is marked with a “*” after the ratio.
Technical Analysis Of Alphabet Inc. GOOGL Stock
Alphabet Inc. GOOGL Stock’s Technical Performance Over The Past Year
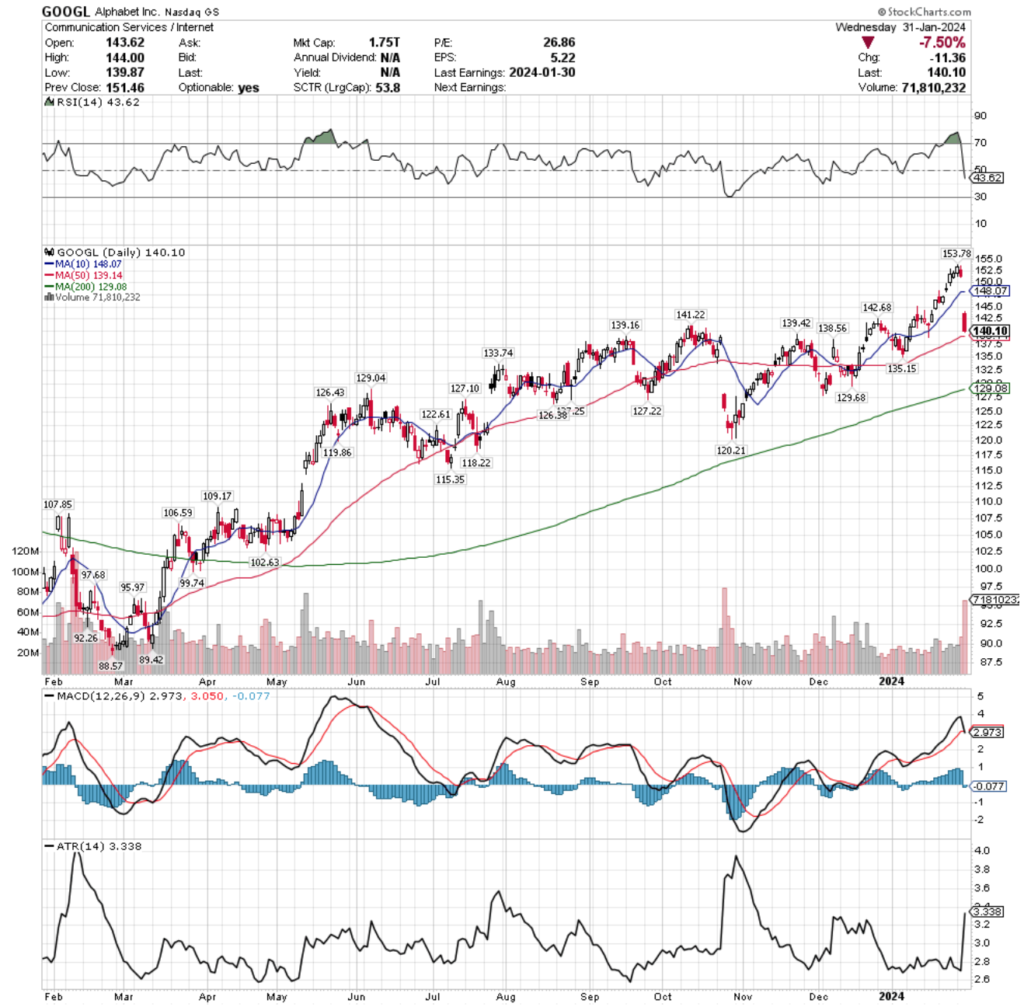
GOOGL stock’s RSI is currently below neutral & sits at 43.62 following their recent declines after spending a week & a half in overbought conditions.
Their MACD has also recently completed a bearish crossover following yesterday’s major gap down session.
Volumes were +18.65% above average over the past week compared to the week prior’s averages, mostly due to yesterday’s steep declines from their 52-week high, as investors rushed to take profits following their earnings report.
The high volume levels of yesterday’s session were the 6th highest of the past year, indicating that there is likely to be more bearish sentiment for GOOGL in the near-term, particularly if today’s session is unable to produce any meaningful gains.
Yesterday’s gap down created a -7.5% window, where the support of the 10-day moving average was completely blown through on the open, while the 50 DMA was able to provide some support, along with multiple support touch-points in the $138-139 support zone.
All eyes will be on how strong the 50 DMA & consolidation range that GOOGL stock spent most of the last 6 months of the year in holds up as a support level, as otherwise only the $135.15 & $133.74 price levels are providing support until there is a zone with multiple touch-points at $129/share.
Their Average True Range shot through the roof yesterday, as there had been limited volatility for the prior week or two as prices climbed relatively slowly & without much volatility.
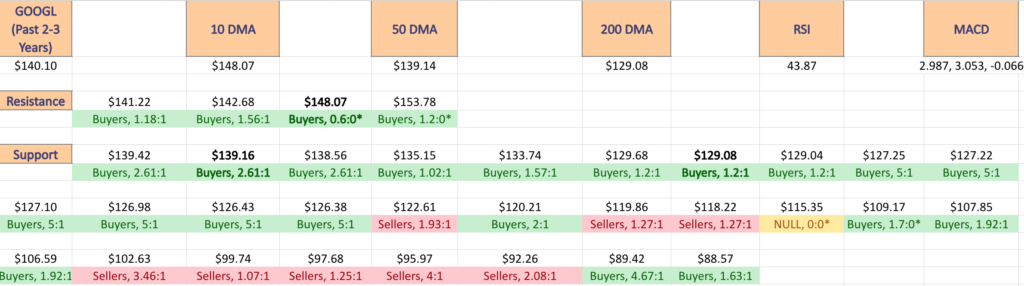
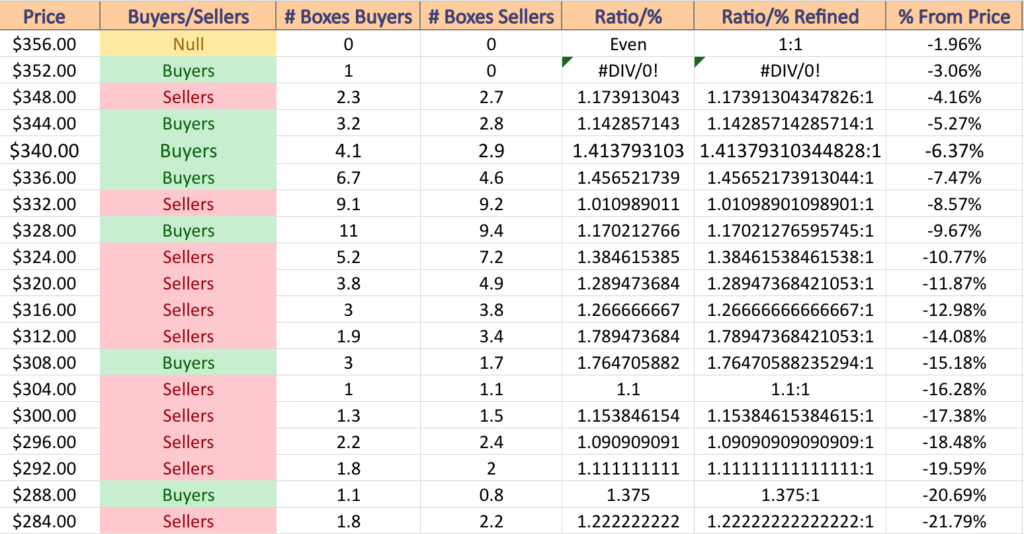
The following section leads off with an image showing all of their current support & resistance levels, as well as the ratio of Buyers:Sellers (or vice-versa) at each price level over the past 2-3 years.
Below that is a table that outlines all of the individual price levels with their ratios, as well as a text list version where the support/resistance levels are noted in bold.
Price Level:Volume Sentiment Analysis For Alphabet Inc. GOOGL Stock
Alphabet Inc. GOOGL Stock’s Price Level:Volume Sentiment Over The Past 2-3 Years At Key 1 Year Support & Resistance Levels
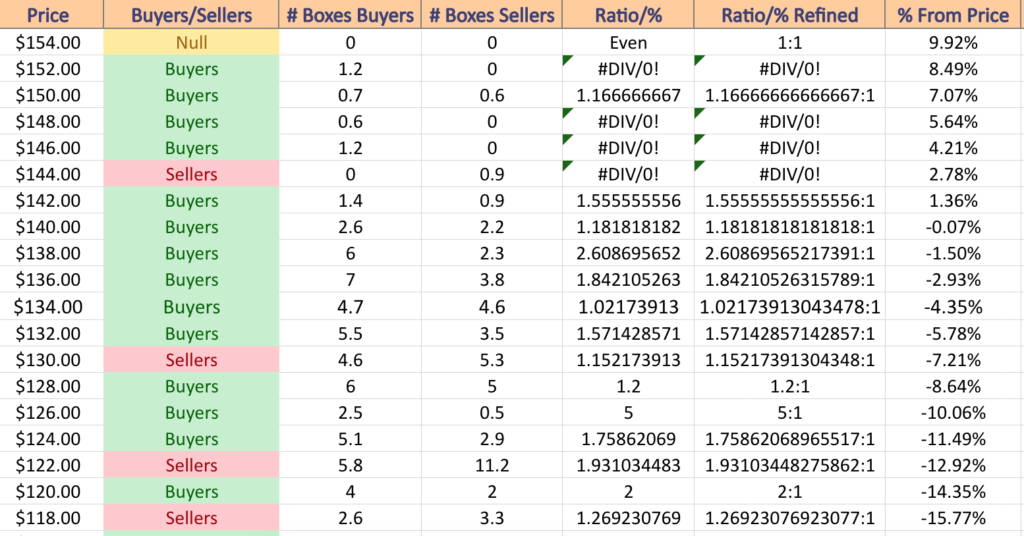
Alphabet Inc. GOOGL Stock’s Price Level:Volume Sentiment Over The Past 2-3 Years
Alphabet Inc. GOOGL Stock’s Price Level:Volume Sentiment Over The Past 2-3 Years
Alphabet Inc. GOOGL Stock’s Price Level:Volume Sentiment Over The Past 2-3 Years
$154 – NULL – 0:0*; +9.92% From Current Price Level
$152 – Buyers – 1.2:0*; +8.49% From Current Price Level
$150 – Buyers – 1.17:1; +7.07% From Current Price Level
$148 – Buyers – 0.6:0*; +5.64% From Current Price Level – 10 Day Moving Average*
$146 – Buyers – 1.2:0*; +4.21% From Current Price Level
$144 – Sellers – 0.9:0*; +2.78% From Current Price Level
$142 – Buyers – 1.56:1; +1.36% From Current Price Level
$140 – Buyers – 1.18:1; -0.07% From Current Price Level – Current Price Box*
$138 – Buyers – 2.61:1; -1.5% From Current Price Level – 50 Day Moving Average*
$136 – Buyers – 1.84:1; -2.93% From Current Price Level
$134 – Buyers – 1.02:1; -4.35% From Current Price Level
$132 – Buyers – 1.57:1; -5.78% From Current Price Level
$130 – Sellers – 1.15:1; -7.21% From Current Price Level
$128 – Buyers – 1.2:1; -8.64% From Current Price Level – 200 Day Moving Average*
$126 – Buyers – 5:1; -10.06% From Current Price Level
$124 – Buyers – 1.76:1; -11.49% From Current Price Level
$122 – Sellers – 1.93:1; -12.92% From Current Price Level
$120 – Buyers – 2:1; -14.35% From Current Price Level
$118 – Sellers – 1.27:1; -15.77% From Current Price Level
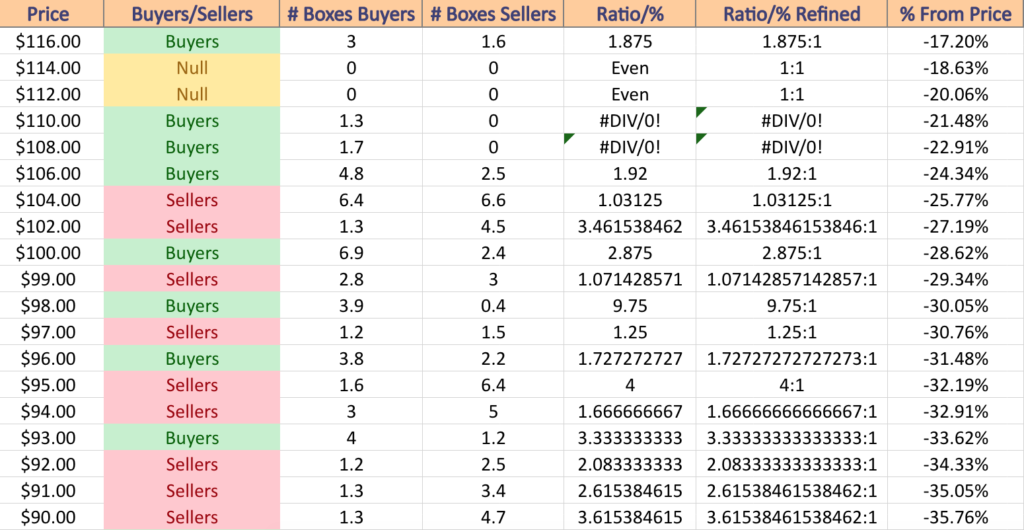
$116 – Buyers – 1.88:1; -17.2% From Current Price Level
$114 – NULL – 0:0*; -18.63% From Current Price Level
$112 – NULL – 0:0*; -20.06% From Current Price Level
$110 – Buyers – 1.3:0*; -21.48% From Current Price Level
$108 – Buyers – 1.7:0*; -22.91% From Current Price Level
$106 – Buyers – 1.92:1; -24.34% From Current Price Level
$104 – Sellers – 1.03:1; -25.77% From Current Price Level
$102 – Sellers – 3.46:1; -27.19% From Current Price Level
$100 – Buyers – 2.88:1; -28.62% From Current Price Level
$99 – Sellers – 1.07:1; -29.34% From Current Price Level
$98 – Buyers – 9.75:1; -30.05% From Current Price Level
$97 – Sellers – 1.25:1; -30.76% From Current Price Level
$96 – Buyers – 1.73:1; -31.48% From Current Price Level
$95 – Sellers – 4:1; -32.19% From Current Price Level
$94 – Sellers – 1.67:1; -32.91% From Current Price Level
$93 – Buyers – 3.33:1; -33.62% From Current Price Level
$92 – Sellers – 2.08:1; -34.33% From Current Price Level
$91 – Sellers – 2.62:1; -35.05% From Current Price Level
$90 – Sellers – 3.62:1; -35.76% From Current Price Level
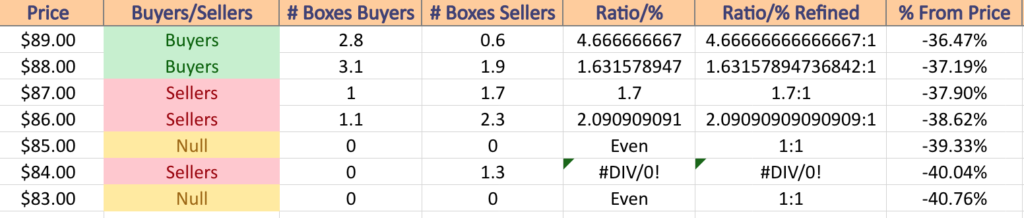
$89 – Buyers – 4.67:1; -36.47% From Current Price Level
$88 – Buyers – 1.63:1; -37.19% From Current Price Level
$87 – Sellers – 1.7:1; -37.9% From Current Price Level
$86 – Sellers – 2.09:1; -38.62% From Current Price Level
$85 – NULL – 0:0*; -39.33% From Current Price Level
$84 – Sellers – 1.3:0*; -40.04% From Current Price Level
$83 – NULL – 0:0*; -40.76% From Current Price Level
*** I DO NOT OWN SHARES OR OPTIONS CONTRACT POSITIONS IN GOOGL STOCK AT THE TIME OF PUBLISHING THIS ARTICLE ***
SPY, the SPDR S&P 500 ETF gained +1.21% this past week, having the second strongest week of the major indexes.
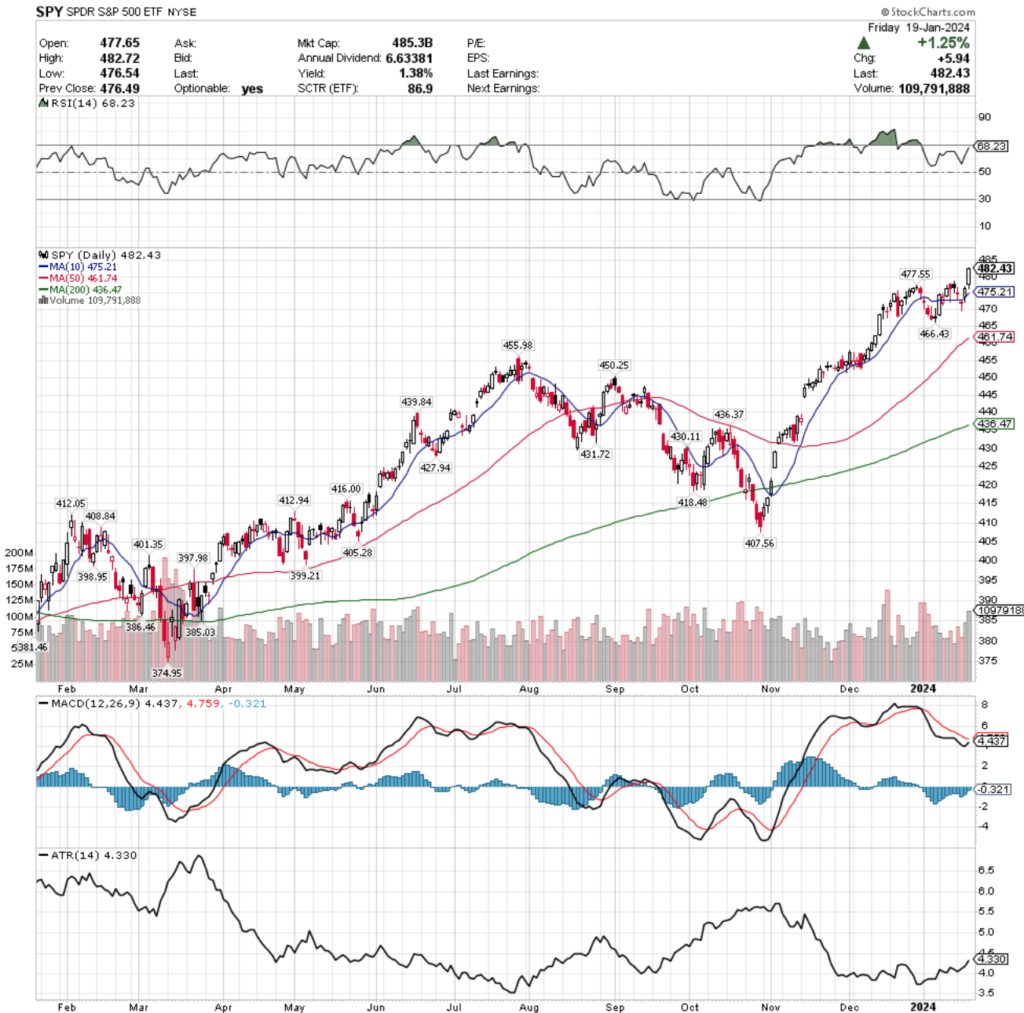
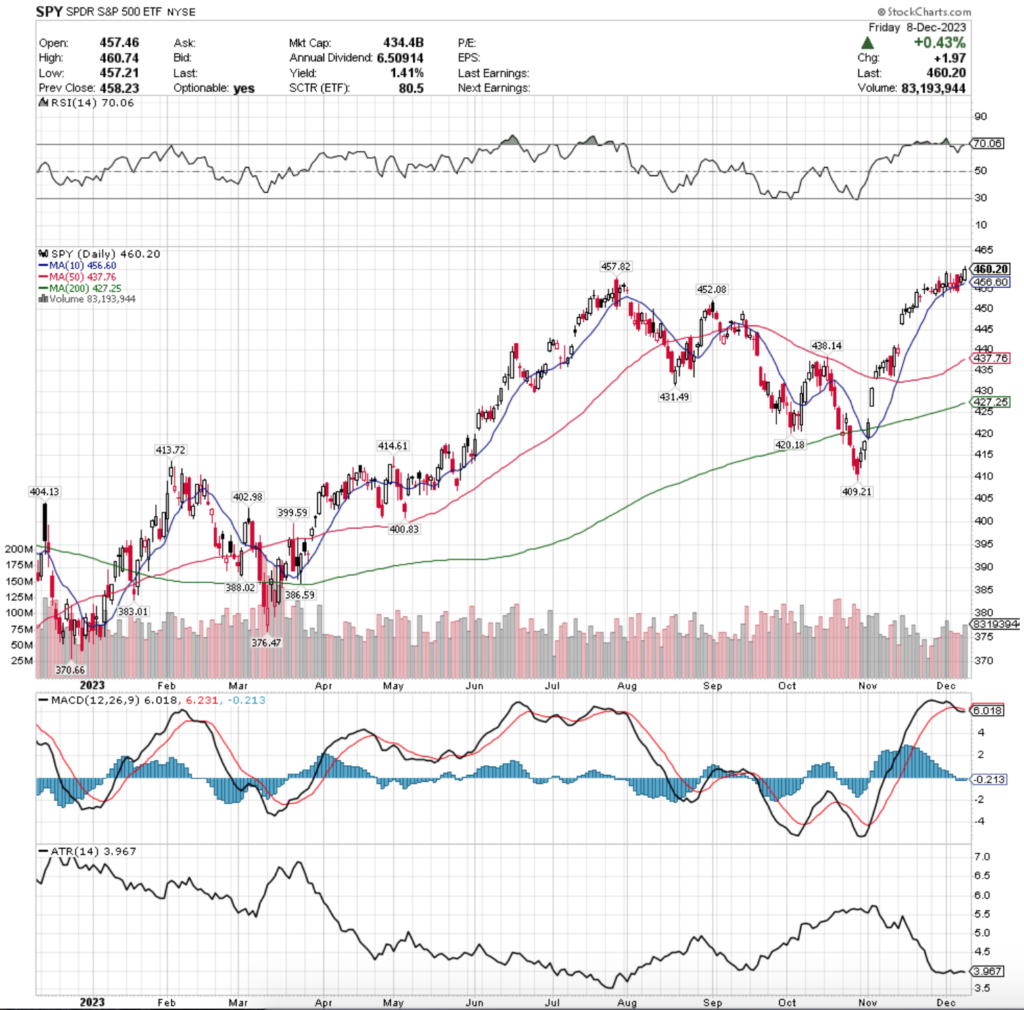
SPY ETF – SPDR S&P 500 ETF’s Technical Performance Over The Past Year
Their RSI is trending towards overbought levels again & is currently 68.23, while their MACD line is currently bearish, but trending upwards towards the signal line following the past two sessions.
Volumes were +4.46% above average this past week compared to the year prior (85,804,734 vs. 82,139,551), which emphasizes the squeezes set for 1/19 options contract expirations of Thursday & Friday’s sessions, as the three prior sessions in the week were on weak volumes.
Monday the week kicked off on a cautious & uncertain note, as the candle’s real body was near exactly the same as Friday’s & despite the session opening slightly above Friday’s close, the close was lower than the open, indicating weakness.
Tuesday continued that theme, as the day resulted in a doji candle whose upper shadow tested the closing price of Monday’s session to the upside, while also testing the support of the 10 day moving average before closing right in the middle of the day’s range.
The declines continued into Wednesday with a more bearish tone, as the day opened on a gap down below the 10 DMA, tested lower, but ultimately closed near the open at the top of the day’s range, creating a dragonfly doji & setting the stage for the reversal of fortune going into the end of the week.
Thursday opened at the 10 DMA support level, tested lower to Wednesday’s open/close area, but trudged higher & signaled that there may be some more appetite to go higher based on their small upper shadow, indicating that the squeeze was going to continue.
Sure enough, Friday showed the strongest volume of the week as shorts were covered & SPY rallied +1.25% heading into the weekend.
While a new 52-week high was set Friday, unless earnings go exceptionally well moving into next week, yesterday’s session is a candidate to be the head of the bearish head & shoulders pattern that has been emerging & mentioned in our other posts over the past few weeks.
There now is a better chance of a consolidation range appearing moving into the near future, as the support of the 10 & 50 day moving averages are now both within -4.29% of the current price.
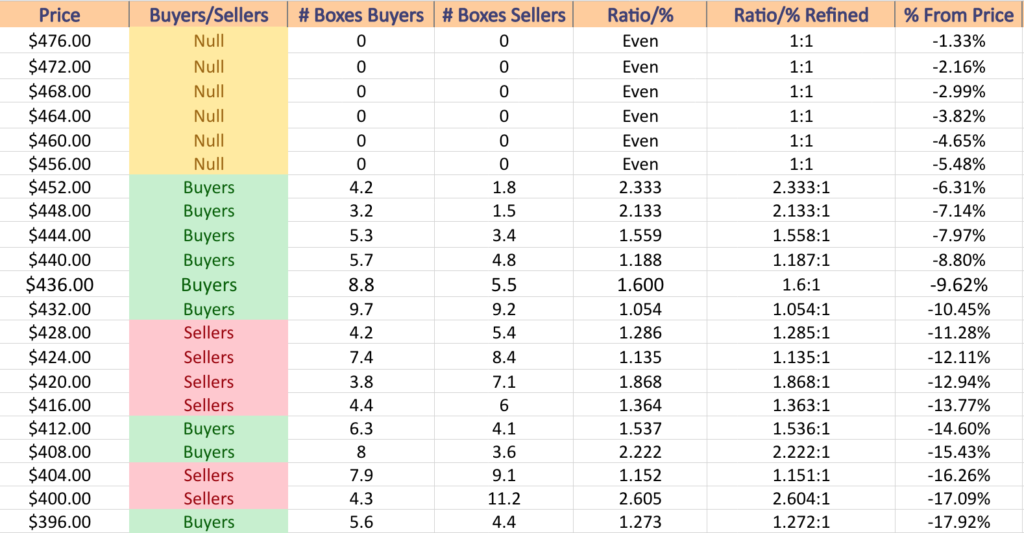
On a note of caution though, in the event of a larger decline those moving averages will begin putting downwards pressure on SPY’s price & force them to retest the $455.98 & $450.25 support levels, which if they are unable to hold up will lead it down to the $436-437 zone where there are currently two support levels.
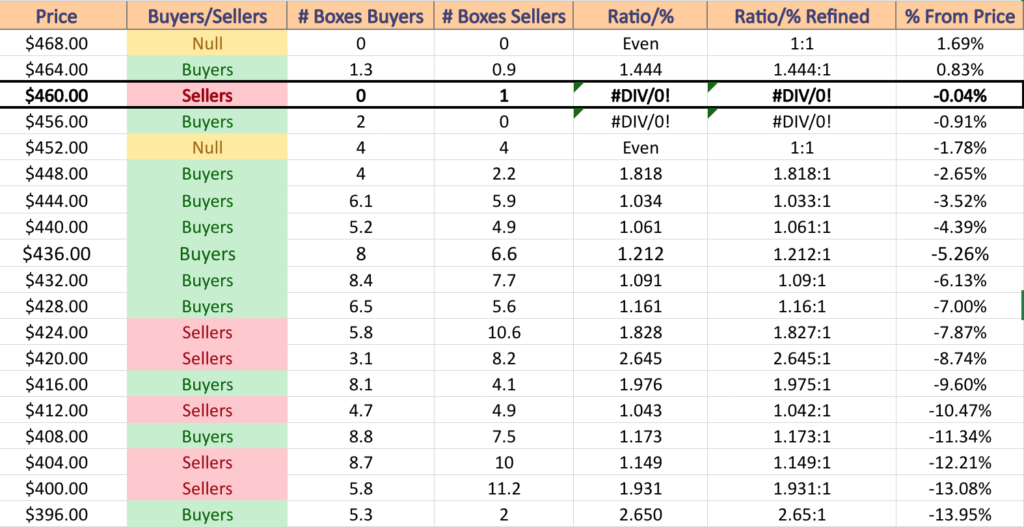
Currently the $440-443.99 price zone is weak in terms of support, as you can see in the chart below & there are no support levels in the $440-450 price zone.
There is currently not enough meaningful volume data for the closest levels of support for SPY due to them being at an all-time high.
Their Average True Range is moving higher slowly, indicating that volatility has begun to uptick from the quieter sessions of the month leading into the new year.
SPY has support at the $477.55 (Volume Sentiment: NULL, 0:0*), $475.21 (10 Day Moving Average; Volume Sentiment: NULL, 0:0*), $466.43 (Volume Sentiment: NULL, 0:0*) & $461.74/share (50 Day Moving Average; Volume Sentiment: NULL, 0:0*) price levels, with no resistance levels from the past year as they reached a new 52-week high on Friday.
SPY ETF’s Price Level:Volume Sentiment For The Past 1-2 Years
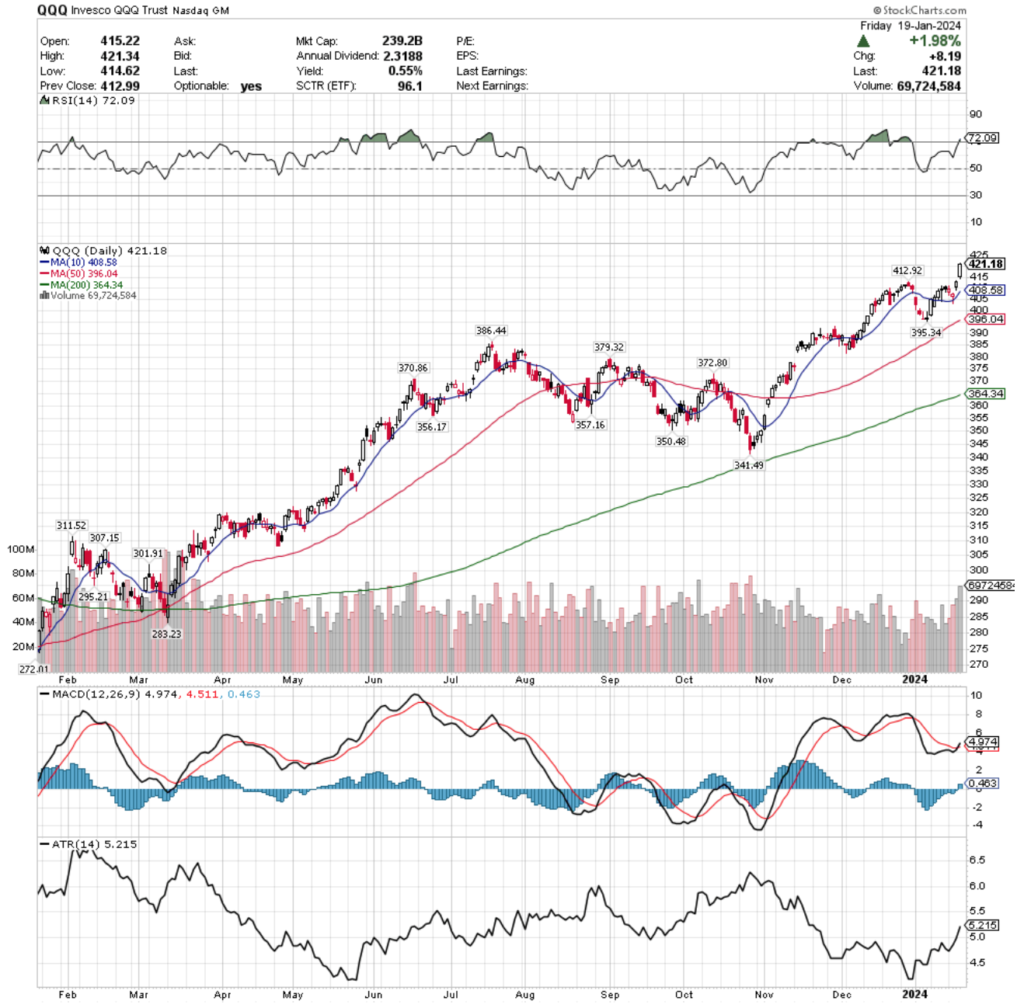
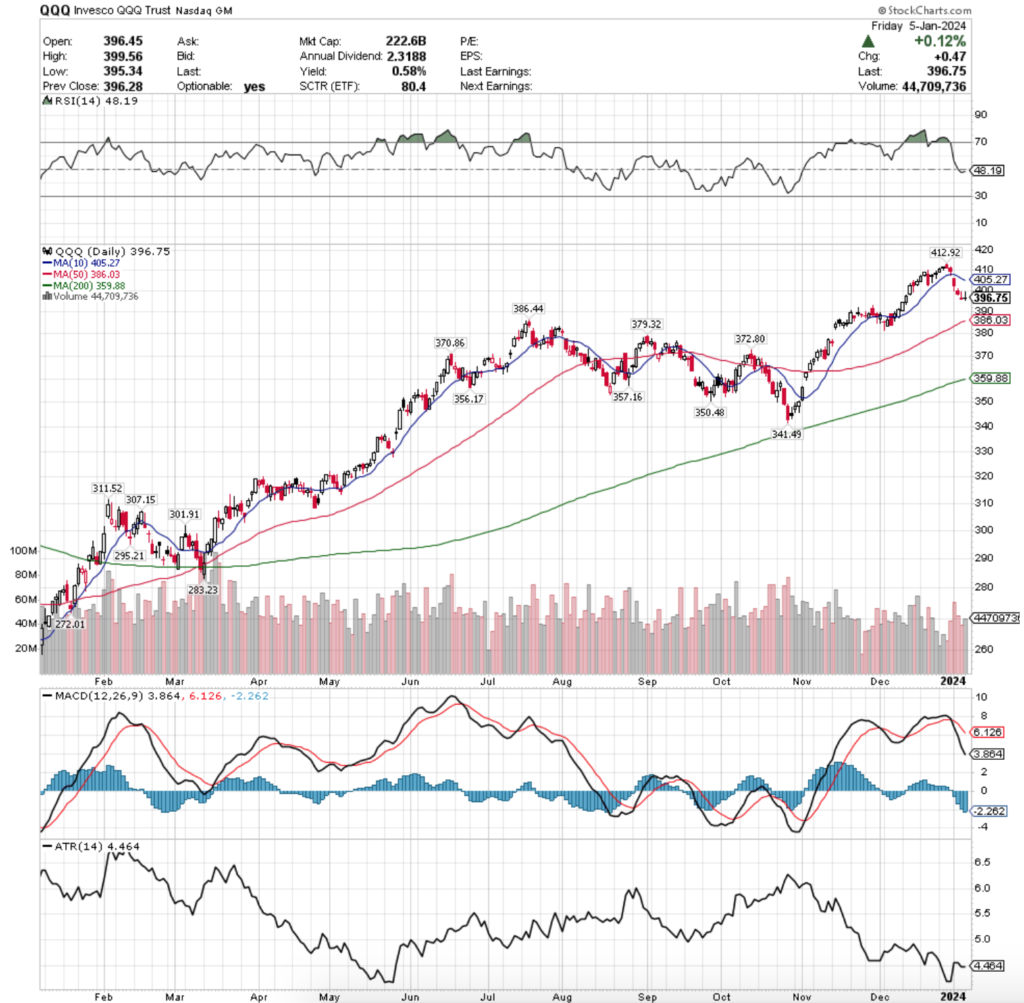
QQQ, the Invesco QQQ Trust ETF advanced +2.84%, as investors favored the technology-heavy NASDAQ 100 names over other major indexes.
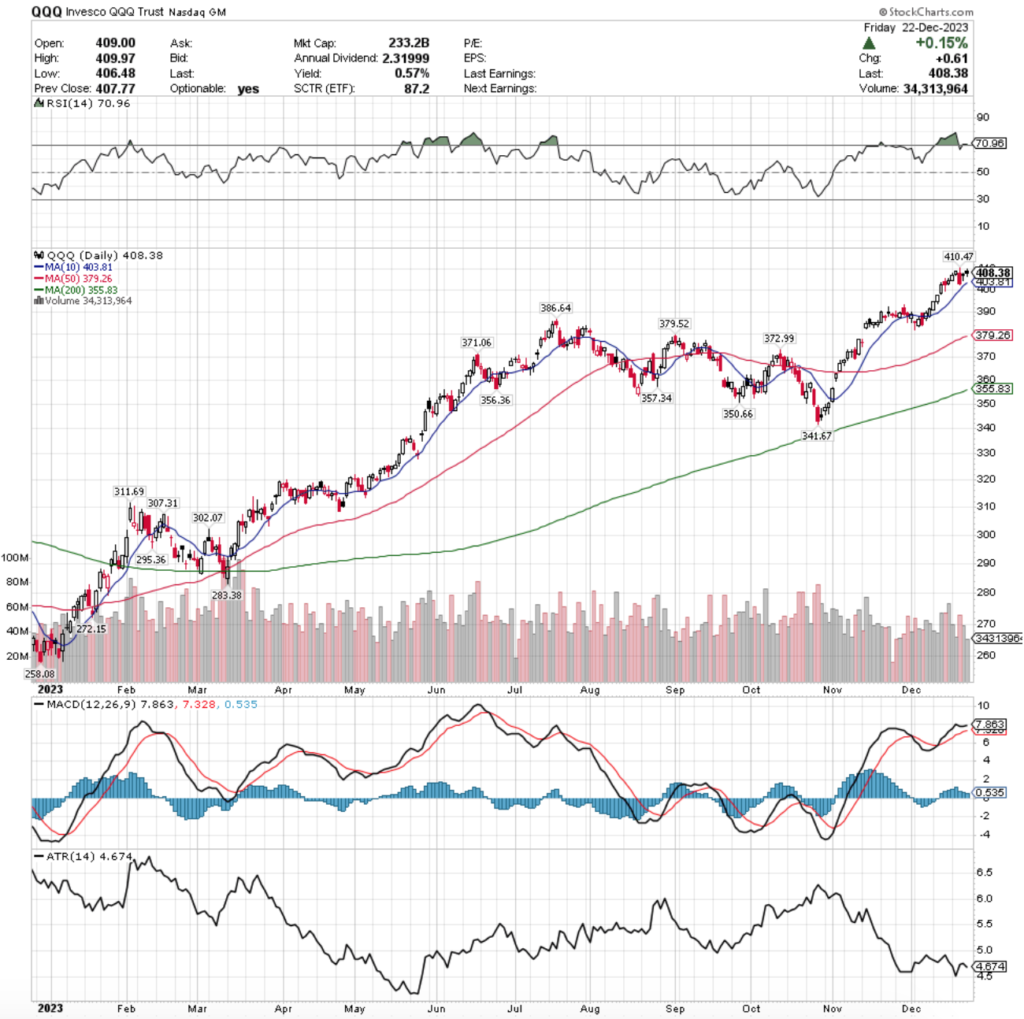
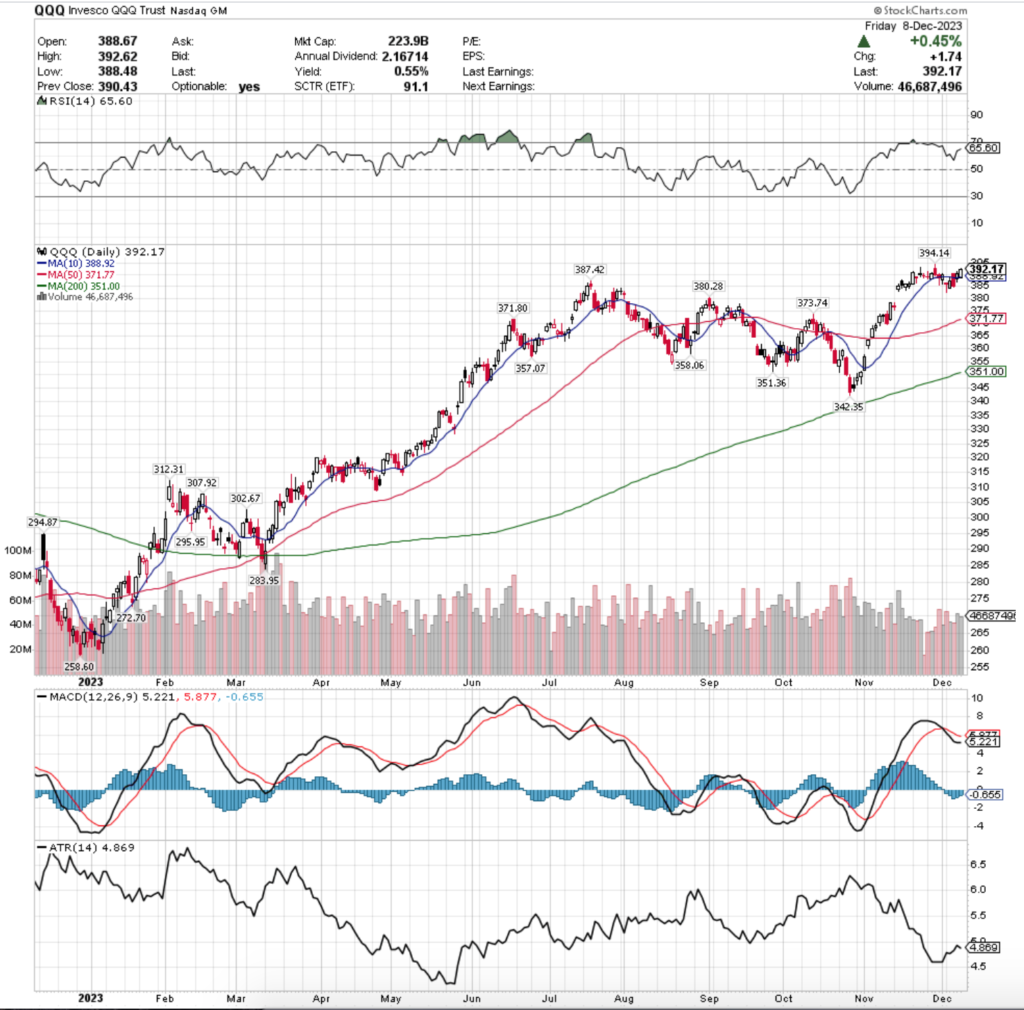
QQQ ETF – Invesco QQQ Trust ETF’s Technical Performance Over The Past Year
Their RSI is overbought at 72.09 following Thursday & Friday’s back-to-back gap up sessions.
Volumes were +8.45% above average last week compared to the year prior (56,881,446 vs. 52,450,027), like SPY most of which occurred on Thursday & Friday, although the risk off Wednesday session also saw volumes that were notably higher than Monday & Tuesday.
Monday set the stage for the declines into midweek, opening above Friday’s candle’s body, but declining to about Friday’s open, resulting in a hanging man candle, signaling further declines on the horizon.
Tuesday’s spinning top candle indicated that there was uncertainty, but the movement was to the downside, setting up Wednesday’s hammer candle, where the price temporarily broke below the 10 day moving average’s support, but ultimately closed higher than it opened, despite the open being a gap down.
This set the stage for the two following days’ gap up sessions, as price action was primarily focused higher & there was a good deal of volume.
All eyes this week will be on how the $412.92/share support level holds up, as well as how the gaps of last week hold up as well, which will receive some aid from the 10 DMA’s support.
Much like SPY, QQQ has also been signaling that a bearish head & shoulders pattern may be emerging in the medium-term, with Friday’s session currently primed to be the head & the left shoulder being the $412.92/share support level that occurred about one month ago (12/28/2023).
The 50 day moving average’s support would also aid in this, as it currently is creating a support zone in the $395-396 price level.
Should it test lower though, all eyes will be on whether or not a consolidation range is established in the $386.44-341.49/share level, like the one that QQQ traded in from June of 2023 until a mid-November gap up session that led to the most recent run up.
Due to QQQ being at an all-time high, there is too little data to assess the historic strength & weakness of buyers:sellers at their current support levels.
Their Average True Range is advancing higher, signaling that there has been a recent increase in volatility, which is expected to continue moving into this week.
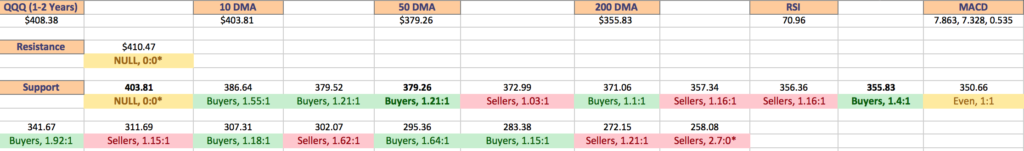
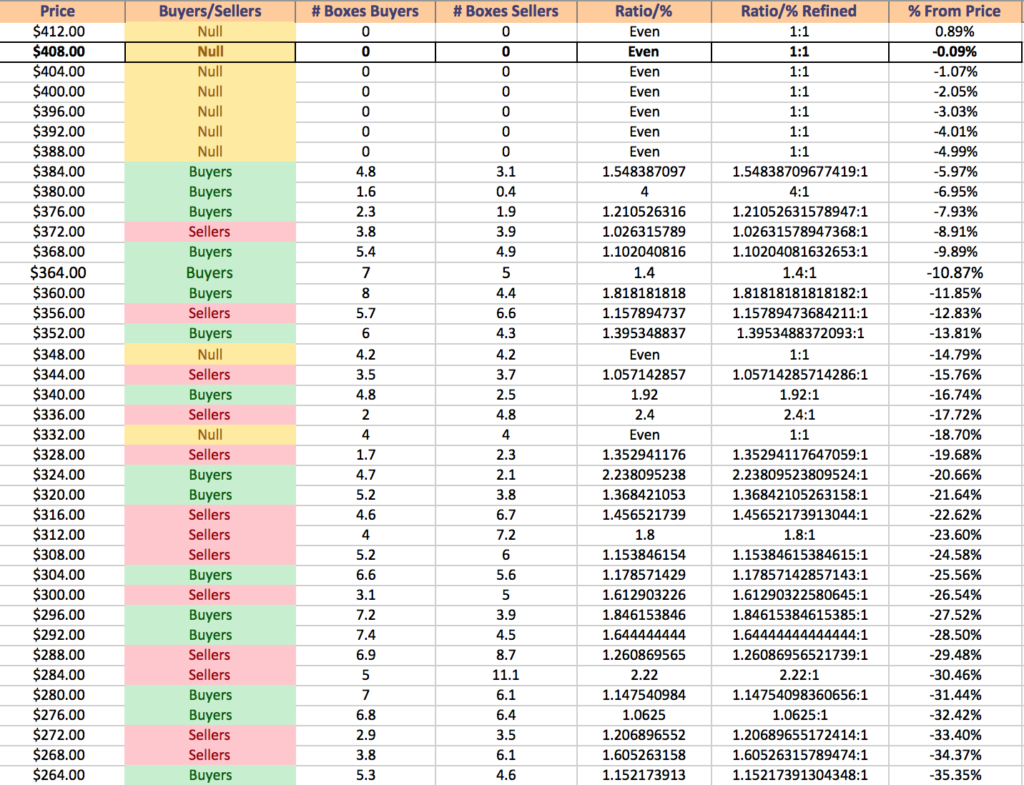
QQQ has support at the $412.92 (Volume Sentiment: NULL, 0:0*), $408.58 (10 Day Moving Average; Volume Sentiment: NULL, 0:0*), $396.04 (50 Day Moving Average; Volume Sentiment: NULL, 0:0*) & $395.34/share (Volume Sentiment: NULL, 0:0*) price levels, with no resistance levels for the past year after reaching a new 52-week high on Friday.
QQQ ETF’s Price Level:Volume Sentiment Over The Past 1-2 Years
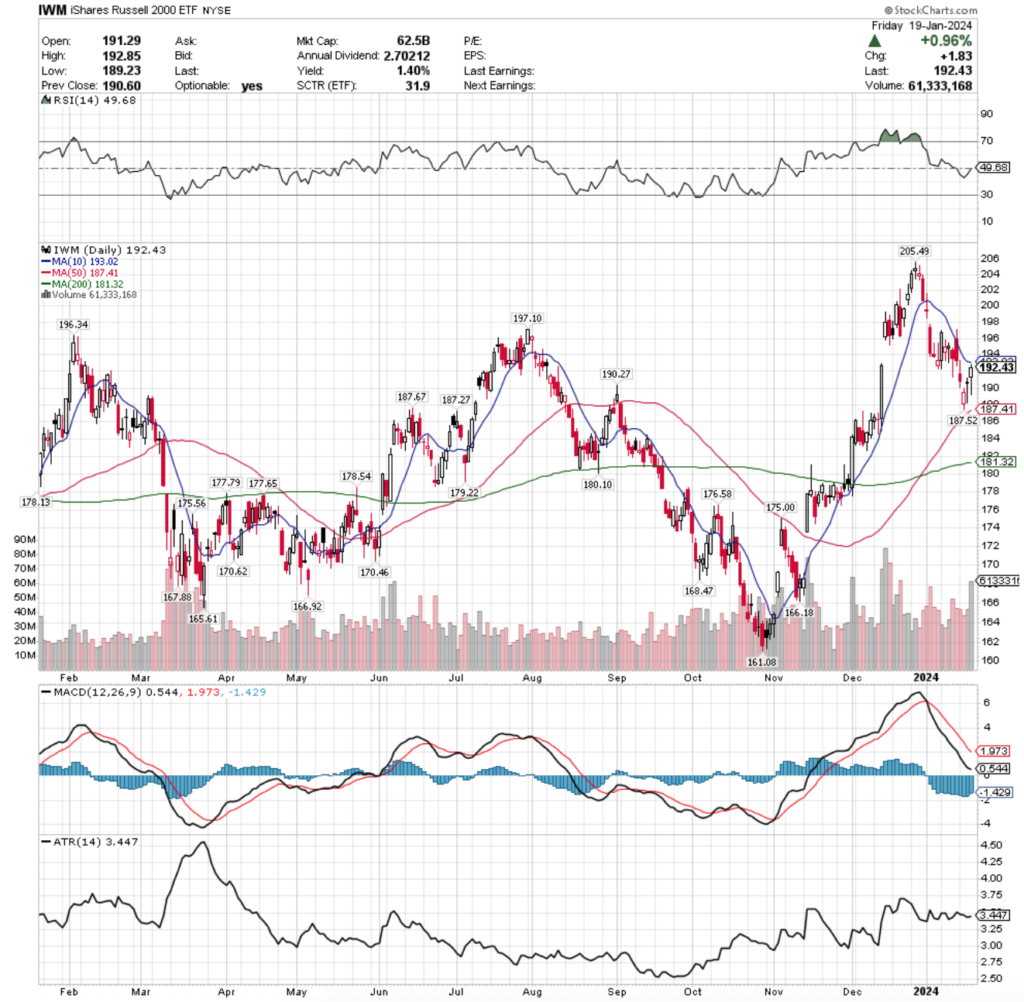
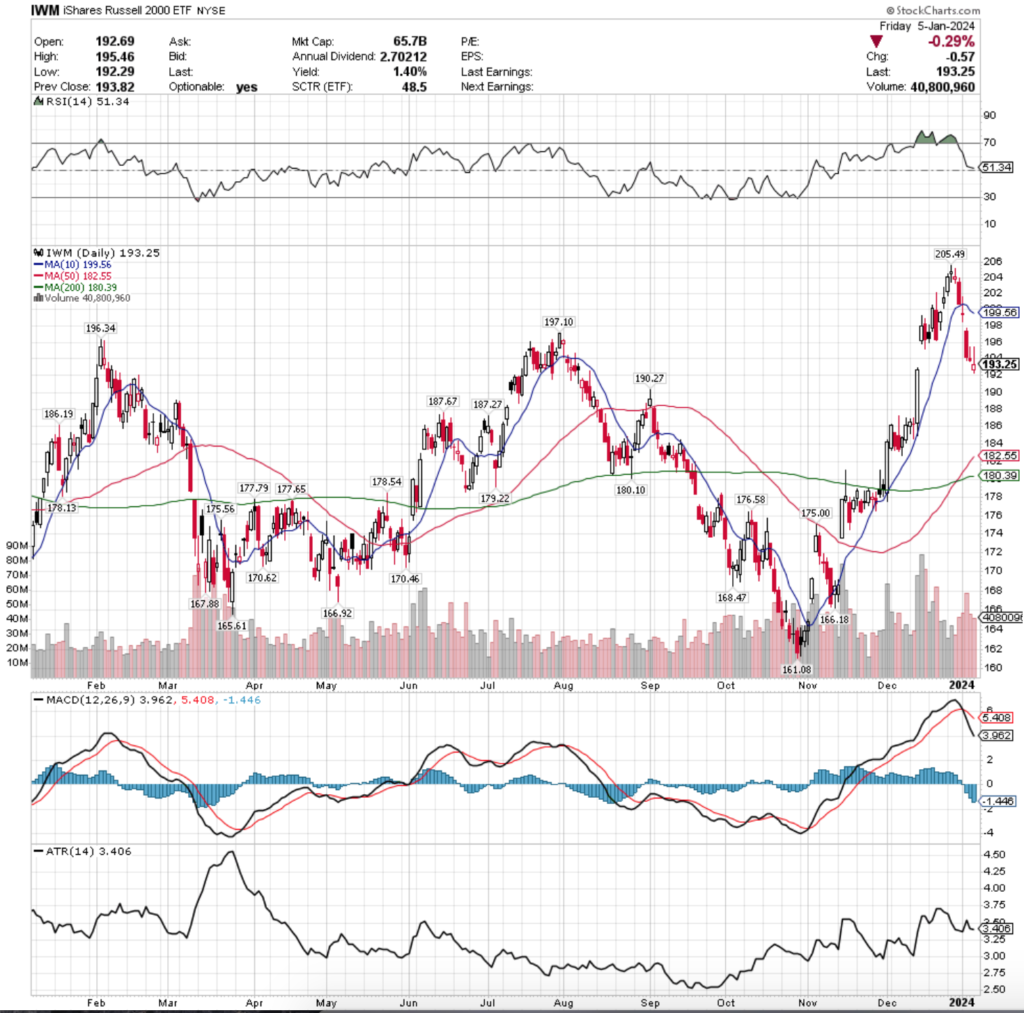
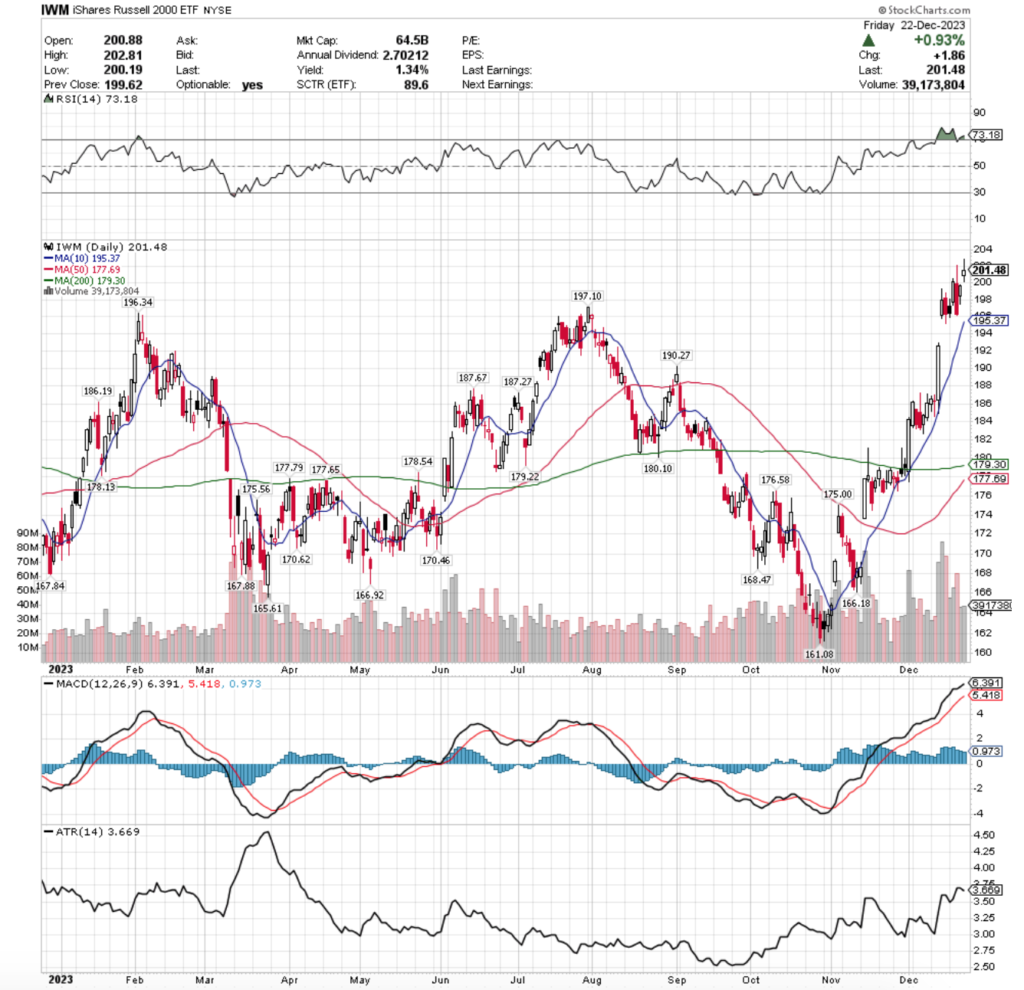
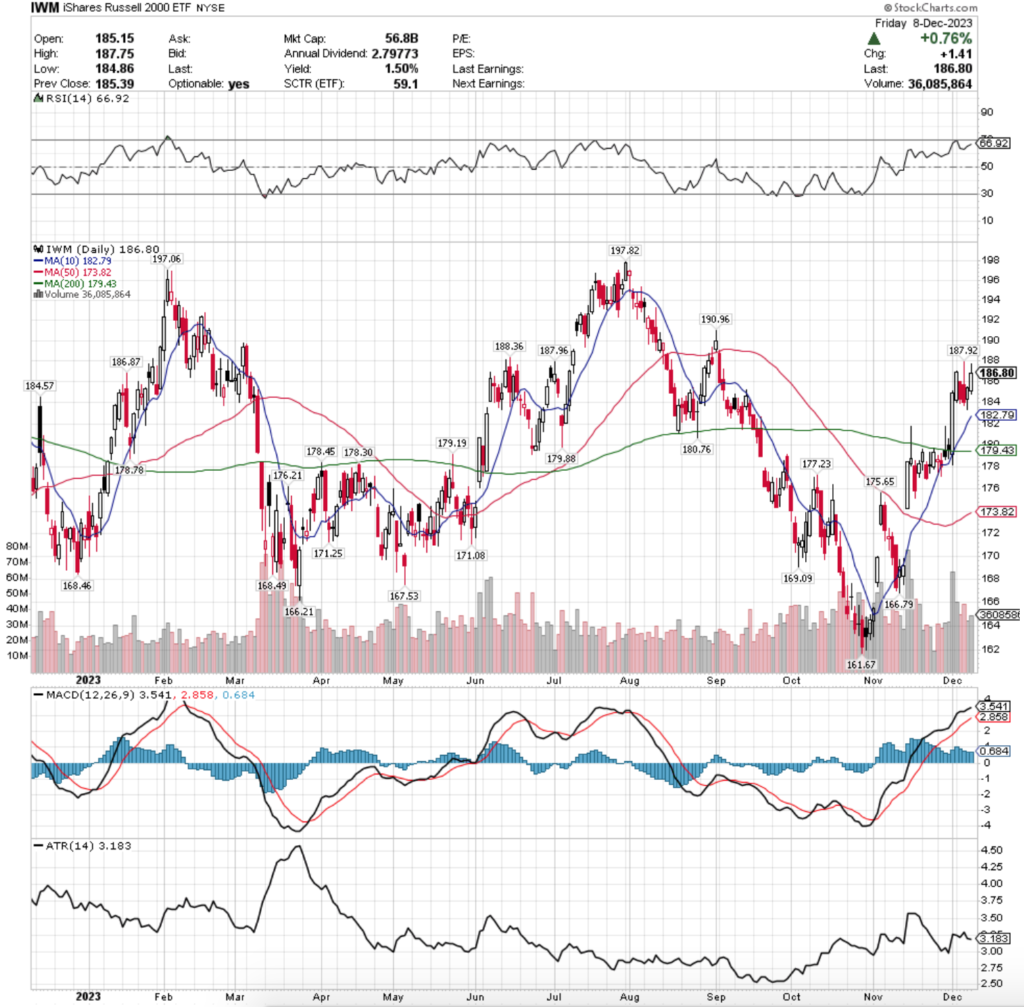
IWM ETF – iShares Russell 2000 ETF’s Technical Performance Over The Past Year
Their RSI is trending back to neutral & currently sits at 49.68, while their MACD is bearish still in the wake of the declines that they suffered since mid-December 2023.
Volumes were +38.71% above average last week compared to the year prior (45,336,017 vs. 32,683,625), driven primarily from Friday’s squeeze rally & some early week declining sessions, which is not an indicator of strength.
Monday’s session kicked off the bearish week opening at the 10 day moving average, testing higher, but ultimately diving beneath the support of the 10 DMA & testing lower on the second strongest volume of the week.
The weakness continued Tuesday, as the session gapped down, tried to recover, but could not even make it up to the 10 DMA’s resistance & continued its bearish descent, with the lower shadow signaling that there was appetite for IWM to move even lower.
Wednesday it gapped down again, almost testing the 50 day moving average’s support level, but pushed higher & wound up closing higher than it opened, but still nowhere near the day prior’s close.
Thursday opened on a gap up in the wake of Wednesday’s price recovery & movement higher & despite testing much lower (almost down to Wednesday’s opening price) resulted in a dragonfly doji, which led to Friday’s gap up.
While there was heavy volume on Friday & average volume Thursday, the 10 day moving average’s resistance will be a key area to watch this week, particularly as the lower shadows on the past two bullish day’s candles show that there was still a great deal of bearish sentiment at these price levels.
There have been a number of consolidation ranges in the past year that may act as support zones should IWM continue its slide downward, but it will be interesting to see how historic volume sentiments hold up for this name, as IWM has many gaps on their chart, leading to skewed data.
Their Average True Range is at the midway level & flat, indicating that there is some volatility.
The price’s interactions with the constricting 10 DMA (resistance applying downward pressure) & 50 DMAs (support applying upward pressure) will prove important in the coming week, as it will dictate which way IWM moves in the near-term.
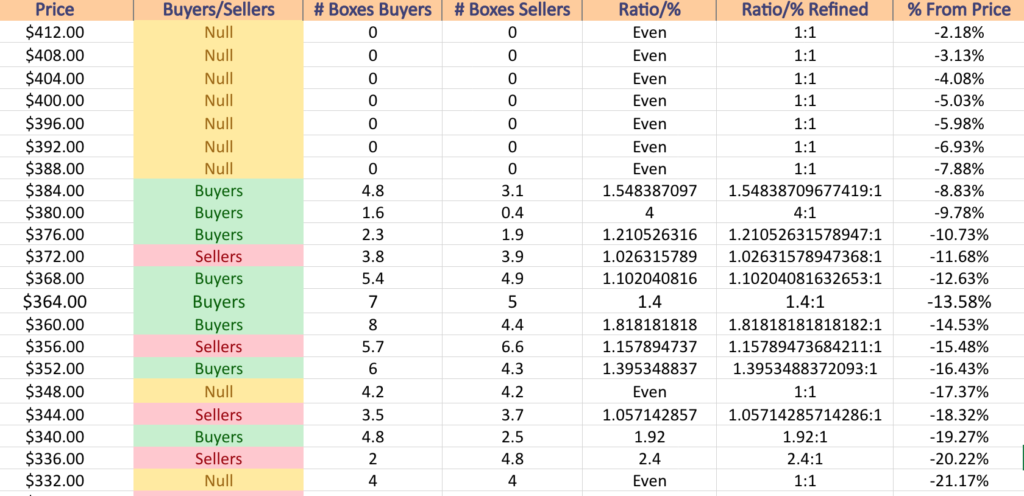
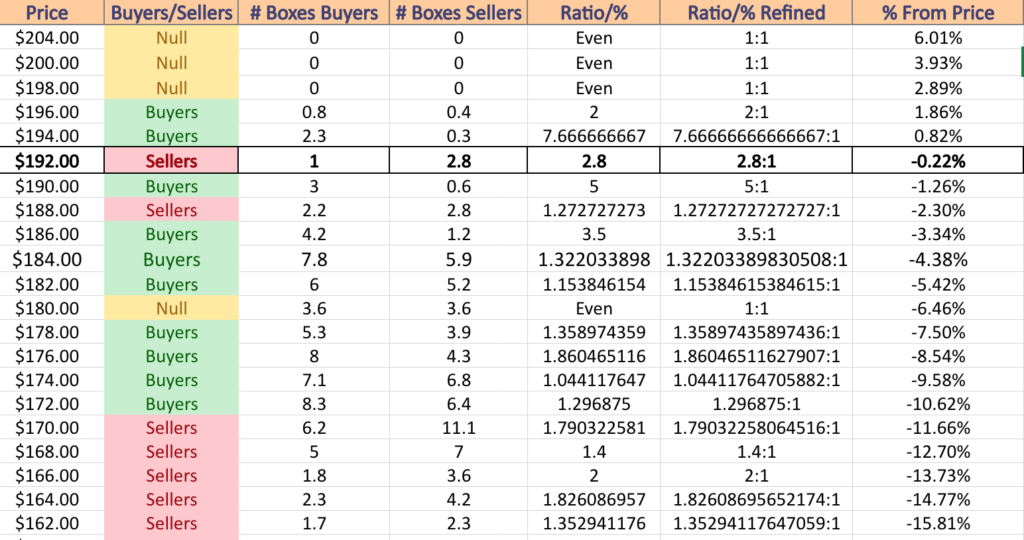
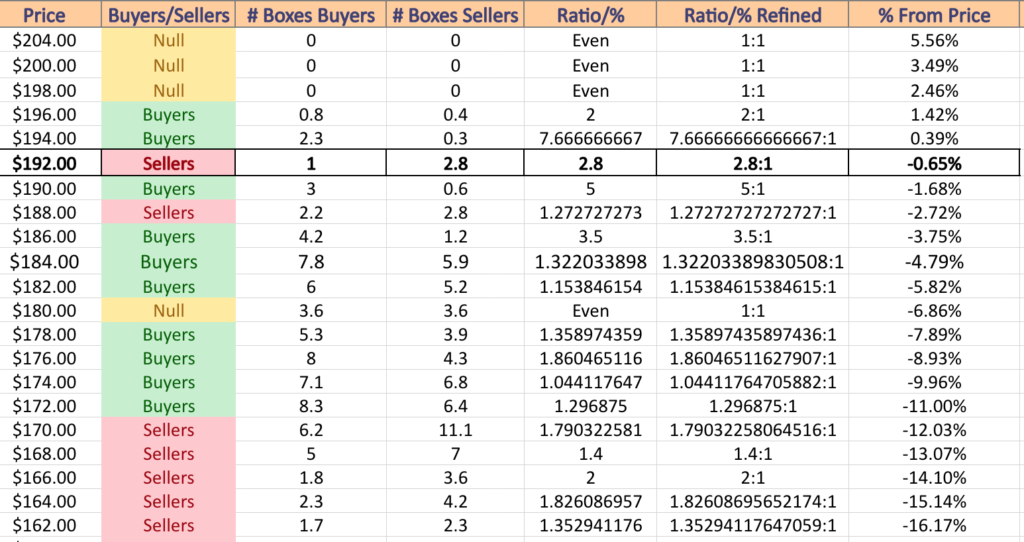
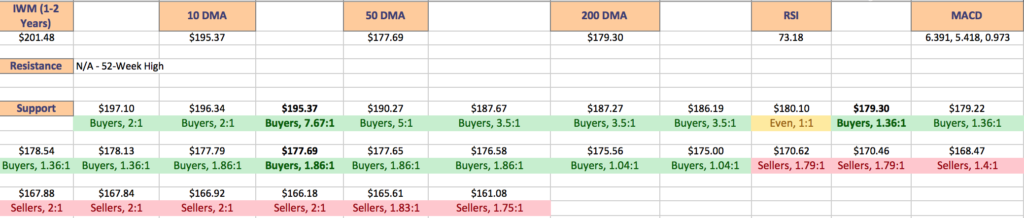
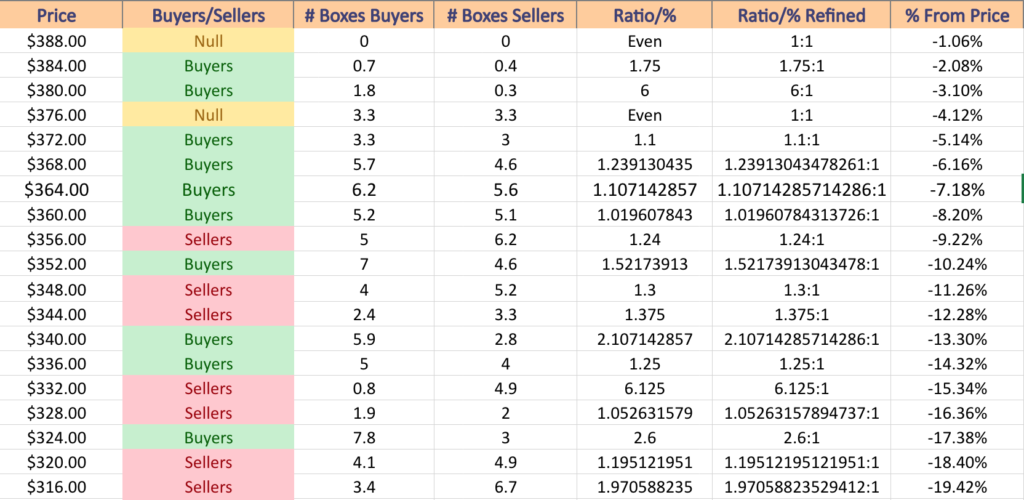
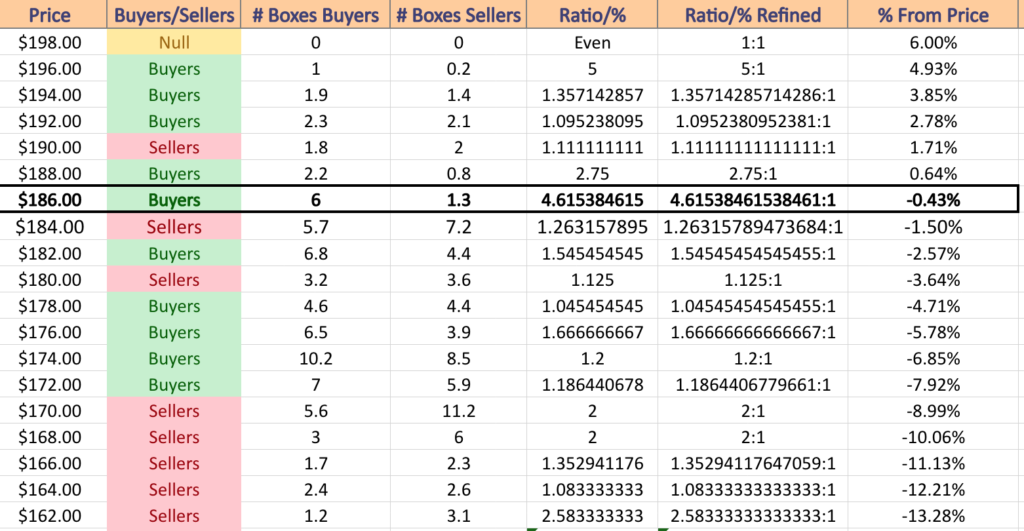
IWM has support at the $190.27 (Volume Sentiment: Buyers, 5:1), $187.67 (Volume Sentiment: Buyers, 3.5:1), $187.52 (Volume Sentiment: Buyers, 3.5:1) & $187.41/share (50 Day Moving Average; Volume Sentiment: Buyers, 3.5:1) price levels, with resistance at the $193.02 (10 Day Moving Average; Volume Sentiment: Sellers, 2.8:1), $196.34 (Volume Sentiment: Buyers, 2:1), $197.10 (Volume Sentiment: Buyers, 2:1) & $205.49/share (52-Week High; Volume Sentiment: NULL, 0:0*) price levels.
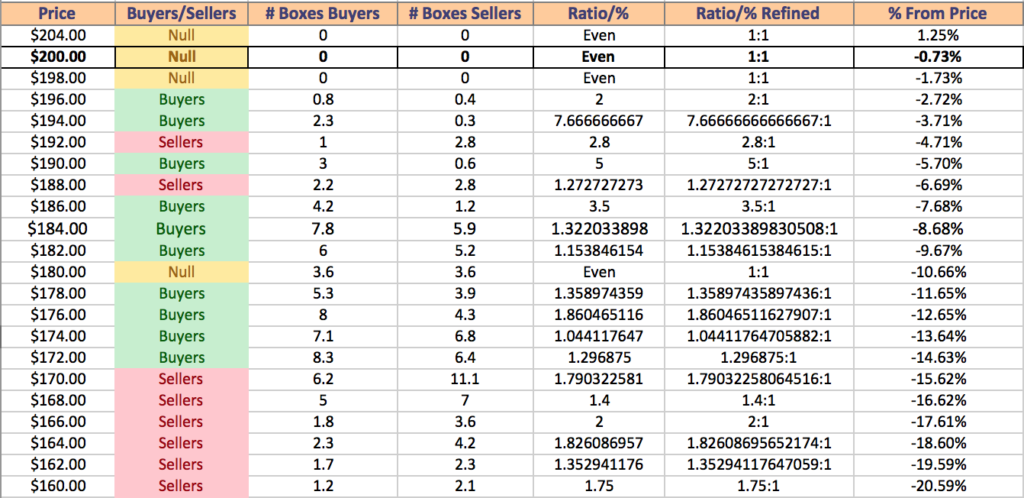
IWM ETF’s Price Level:Volume Sentiment Over The Past 1-2 Years
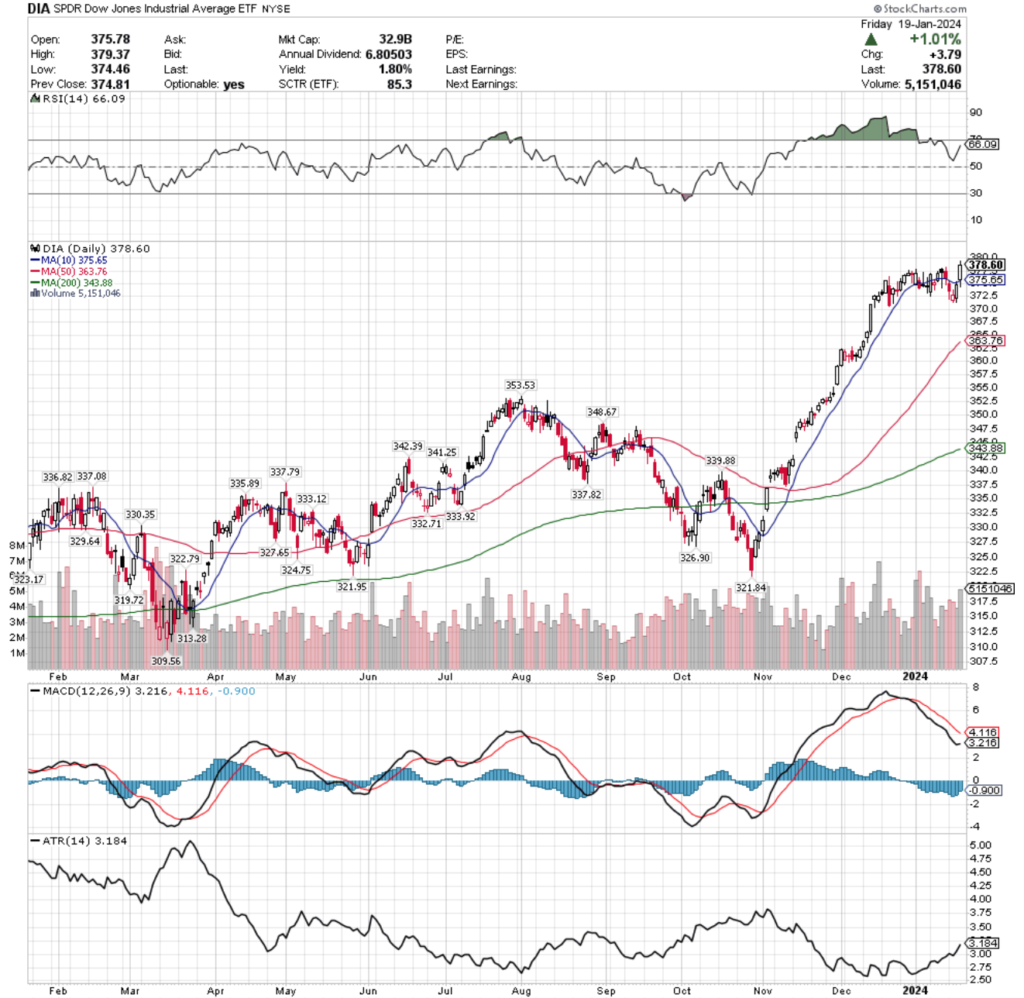
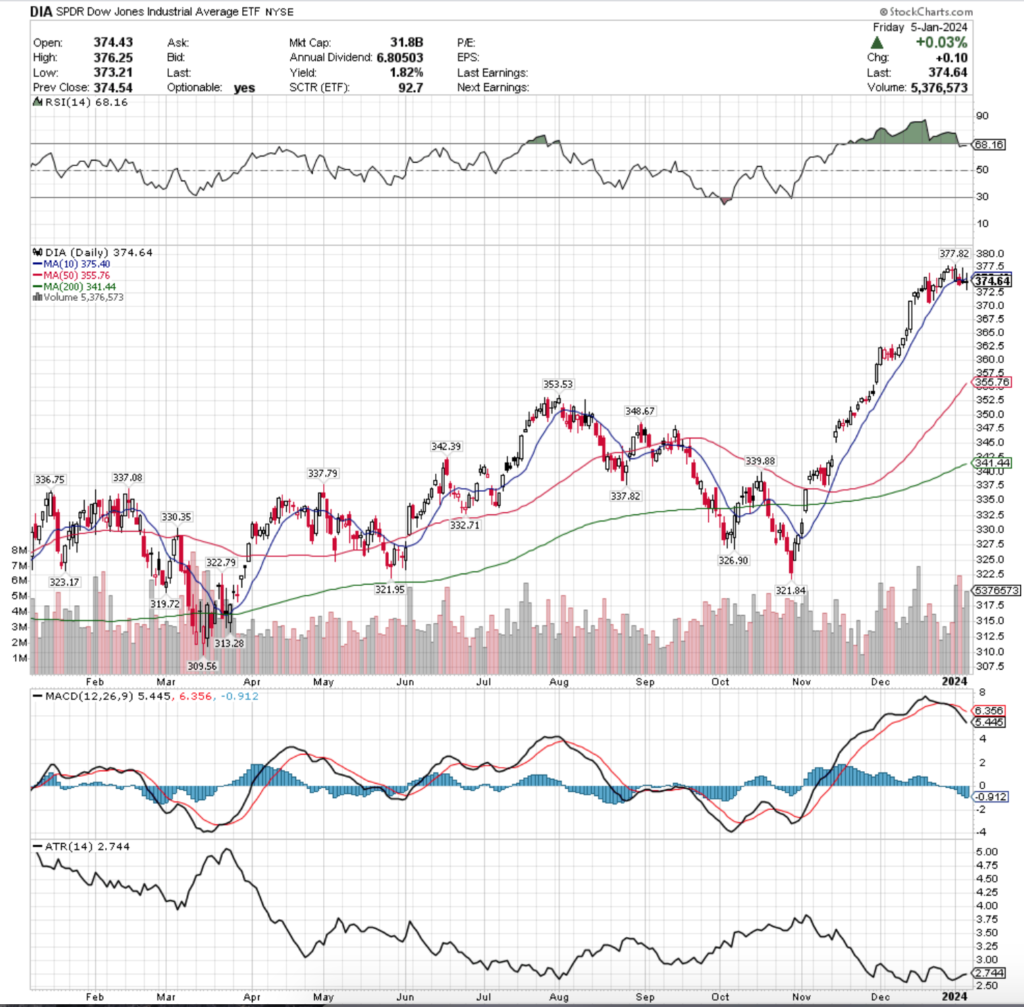
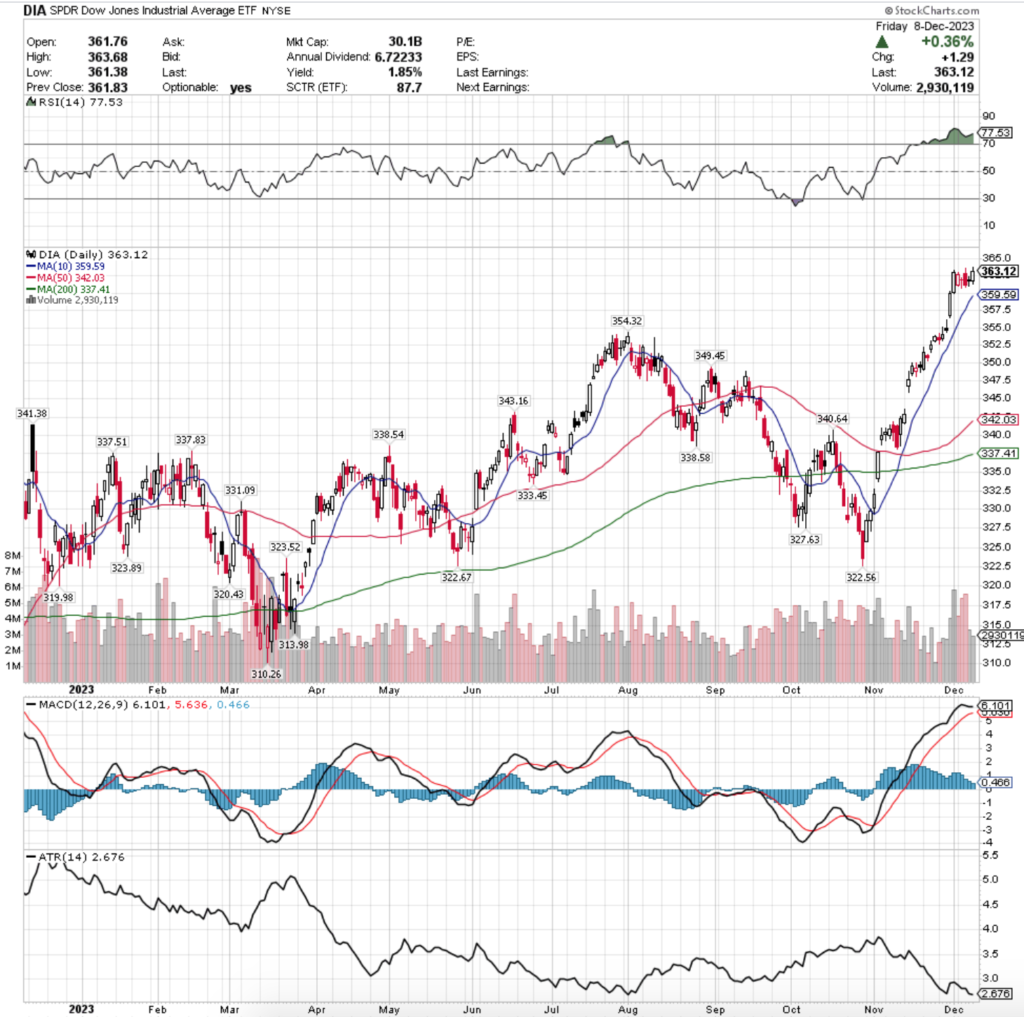
DIA, the SPDR Dow Jones Industrial Average ETF inched forward +0.72% this past week, as investor sentiment for the large cap components of the index seem to have halted after a months-long run up in price.
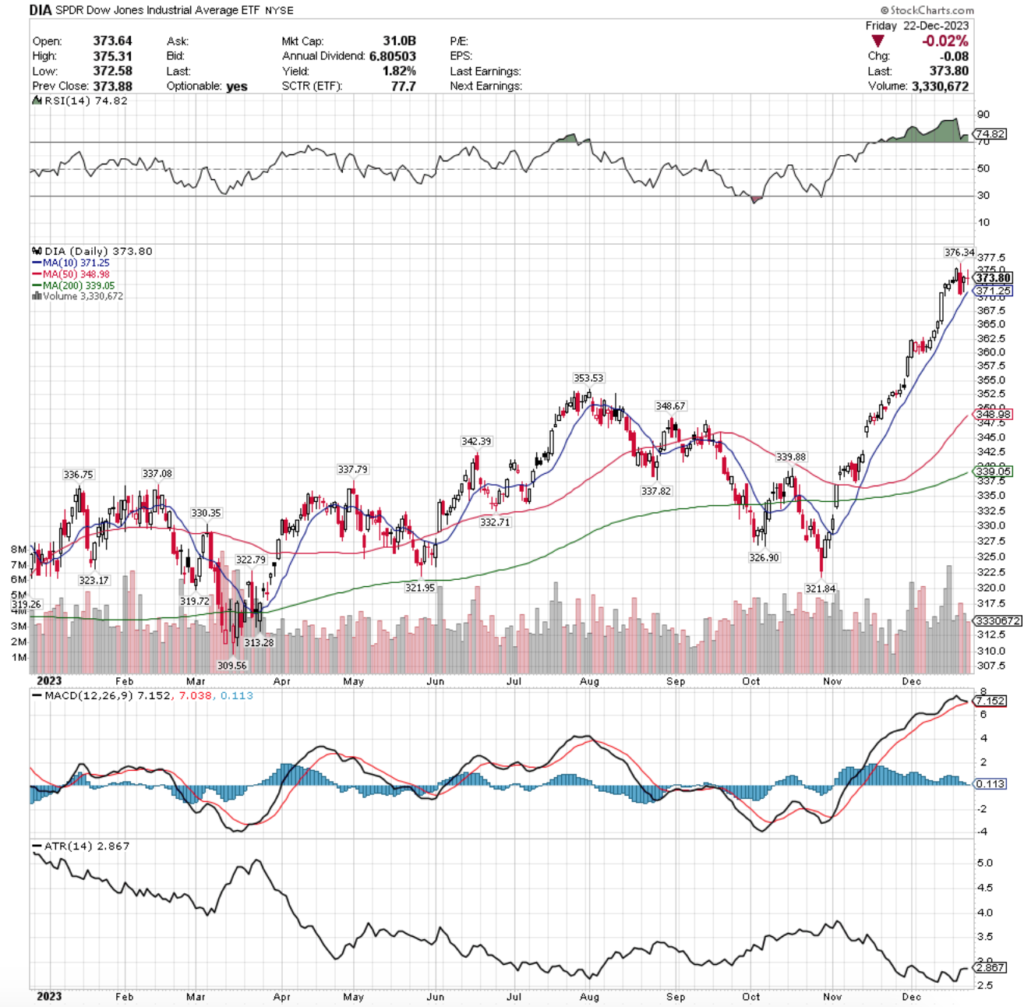
DIA ETF – SPDR Dow Jones Industrial Average ETF’s Technical Performance Over The Past Year
Their RSI is trending towards overbought & currently is at 66.09, while their MACD line is currently bearish, but moving closer to the signal line for a potential crossover.
Volumes were +27.69% above average this past week compared to the year prior (4,476,521 vs. 3,505,776), which like IWM, were mostly on account of Friday’s squeeze session & some selling pressure early on in the week.
Monday opened just below Friday’s close, tested much lower, but retreated back to the support of the 10 day moving average in time for the close.
Tuesday followed in the bearish sentiment, not being able to break the 10 DMAs resistance & trudged lower, with the candle’s lower shadow indicating more moves to the downside were coming.
Wednesday’s inverse hammer candle signaled that there would be near-term moves higher, particularly after it opened on a gap down, tested higher & closed above the open.
Thursday was a wide range session that was unable to beat the strength of the seller sentiment at the 10 DMAs resistance level, but Friday gapped up to open above it, briefly tested below it, before charging onwards higher to reach the new 52-week high.
Much like SPY & QQQ, DIA forming a bearish head & shoulders has also been a topic of discussion in previous articles & we will be watching to see if the head was established during Friday’s session.
Another area to watch will be the 10 DMA’s ability to remain a support level after last week’s falling apart, and once it does break down how the downwards pressure moves DIA in the coming weeks.
Should the downward pressure be applied & the 10 DMA be broken downward, the 50 DMA will become a critical support level, as it is the only support between the current price & the next support level which is a -6.6% decline from the current price.
Their Average True Range is moving higher, indicating that volatility is picking up after a month & a half of relative calm trading for DIA.
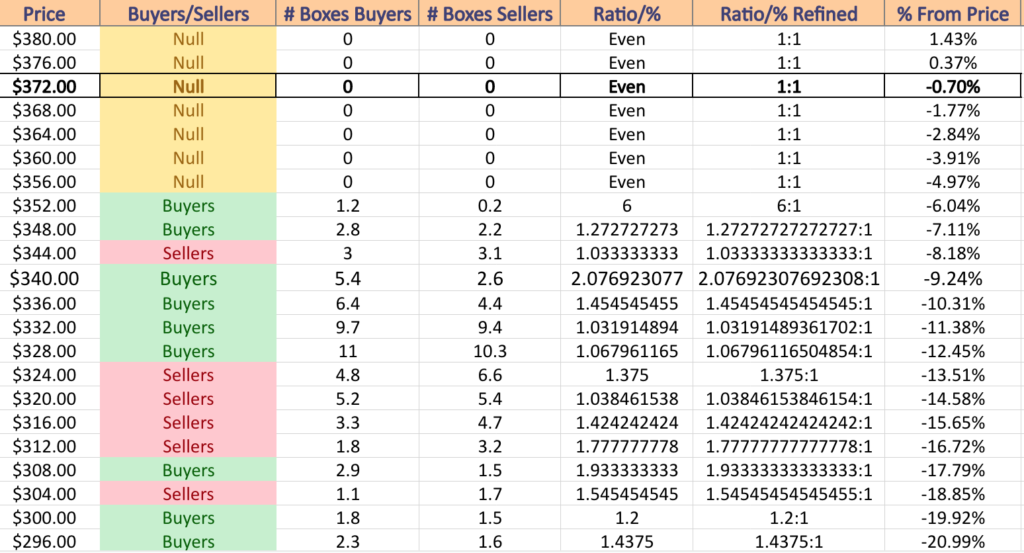
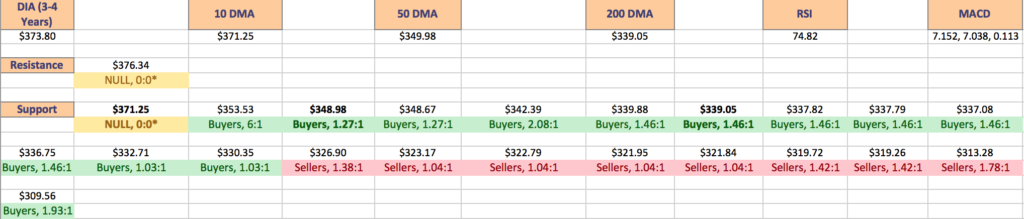
DIA has support at the $375.65 (10 Day Moving Average; Volume Sentiment: NULL, 0:0*), $363.76 (50 Day Moving Average; Volume Sentiment: NULL, 0:0*), $353.53 (Volume Sentiment: Buyers, 6:1) & $348.67/share (Volume Sentiment: Buyers, 1.27:1) price levels, with no resistance levels in the past year after reaching a new 52-week high on Friday.
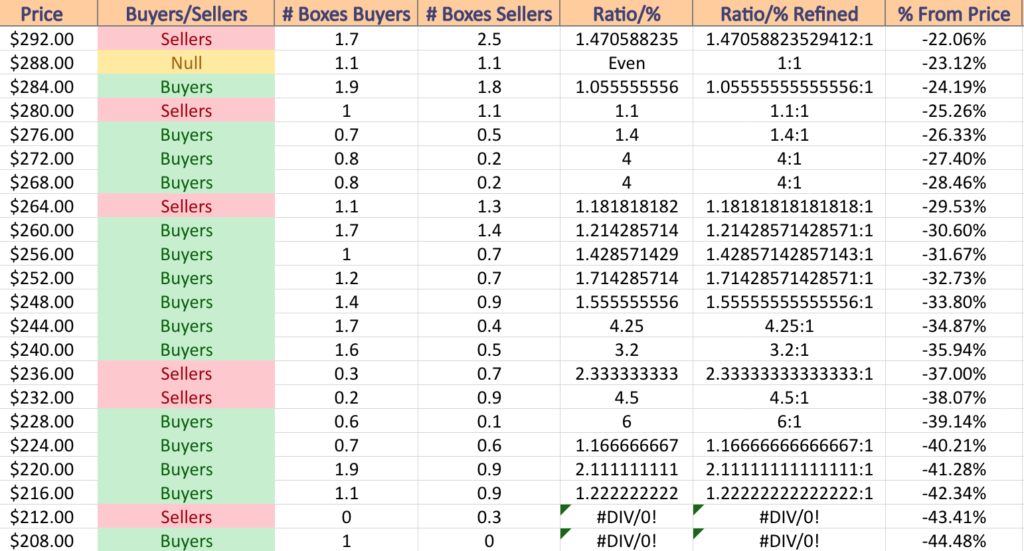
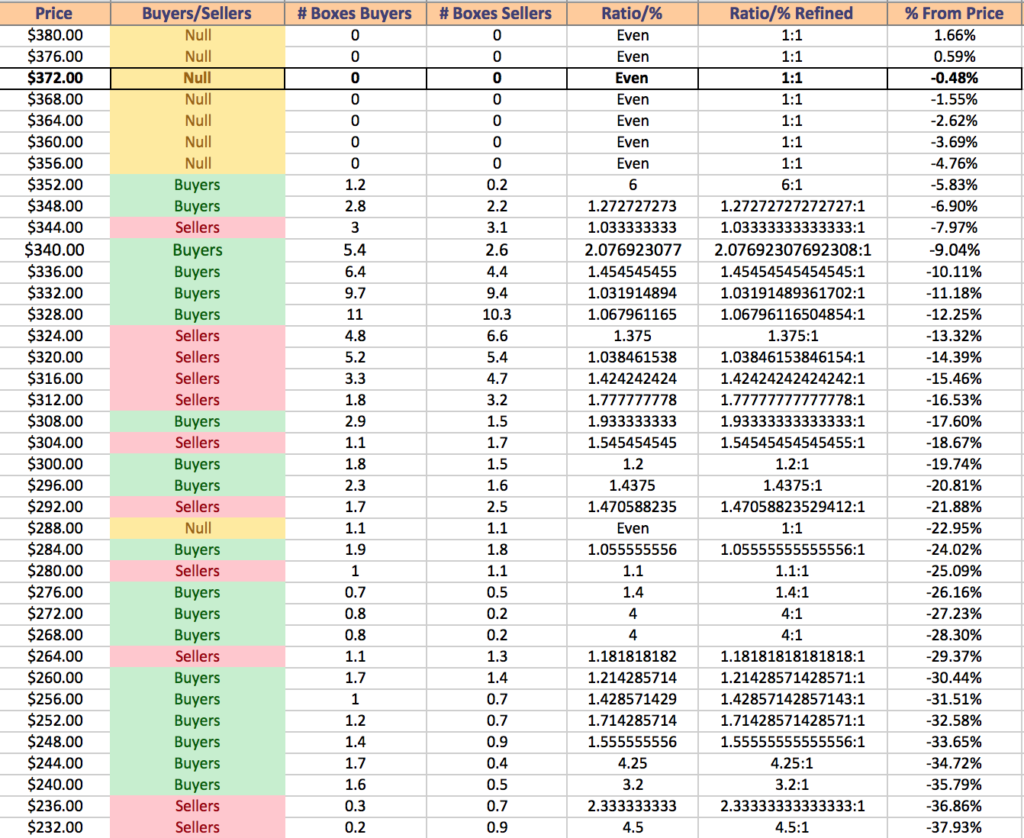
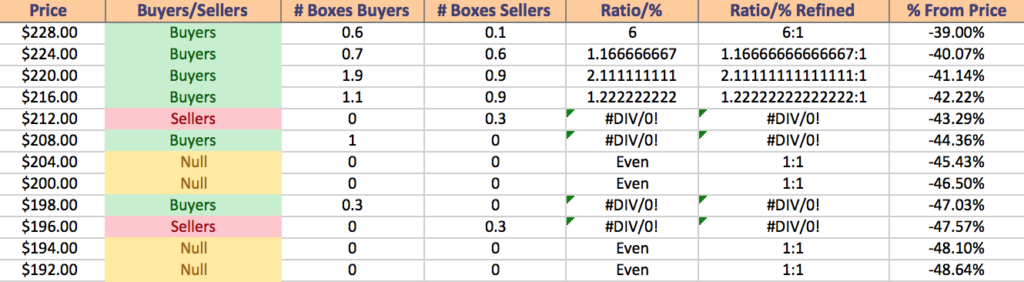
DIA ETF’s Price Level:Volume Sentiment Over The Past 3-4 Years
The Week Ahead
The week ahead will be relatively quiet in terms of economic reports & data, but promises to be busy on the earnings report front.
Both Monday & Tuesday there are no major economic reports scheduled.
Agilysys, AGNC Investment, Brown & Brown, Independent Bank Group, TFI International (TFII), United Airlines & Zions Bancorp are all scheduled to report earnings on Monday.
On Tuesday Netflix, 3M, Baker Hughes, Canadian National Railway, D.R. Horton, General Electric, Halliburton, Intuitive Surgical, Invesco, Johnson & Johnson, Lockheed Martin, Old National Bancorp, PACCAR, Procter & Gamble, RTX, Synchrony Financial, Steel Dynamics, Stride, Teck Resources, Texas Instruments, Trustmark, Veritex Holdings, Verizon Communications & WesBanco all report earnings.
Wednesday brings us S&P Flash Services PMI & S&P Flash U.S. Manufacturing PMI data at 9:45 am.
Tesla, Abbott Labs, Agnico-Eagle Mines, Alamos, Ameriprise Financial, Amphenol, ASML, AT&T, Canadian Pacific, Cohen & Steers, Columbia Banking, Crown Castle, CSX, Elevance Health, Ethan Allen, Freeport-McMoRan, General Dynamics, International Business Machines, Kimberly-Clark, Knight-Swift, Lam Research, Monro Muffler, Packaging Corp, Plexus, Raymond James, ResMed, Sallie Mae, SAP, Seagate Technology, ServiceNow, SL Green Realty, TE Connectivity, Teledyne Tech, Textron, United Rentals, W.R. Berkley & West Fraser all are scheduled to report earnings data on Wednesday.
Q4 GDP (prelim), Initial Jobless Claims, Durable-Goods Orders, Durable-Goods Minus Transportaton, Advanced U.S. Trade Balance In Goods, Advanced Retail Inventories & Advanced Wholesale Inventories data will all be announced on Thursday at 8:30 am.
Thursday’s earnings reports include Intel, Alaska Air, American Airlines, Arthur J. Gallagher, Blackstone, Capital One, CNX Resources, Comcast, Cullen/Frost, Dow, Eagle Materials, Fair Isaac, Federated Hermes, KLA Corp, L3Harris, Marsh & McLennan, McCormick, Mobileye Global, Murphy Oil, NextEra Energy, NextEra Energy Partners, Northrop Grumman, Olin, Precision Drilling, RPC, Sherwin-Williams, STMicroelectronics, T-Mobile US, Union Pacific, Valero Energy, Virtu Financial, Visa, Western Alliance Bancorp, Western Digital, Weyerhaeuser & Xcel Energy.
All eyes will be on the American consumer to wind the week down on Friday, with Personal Income, Personal Spending, PCE Index, Core PCE Index, PCE (Year-over-Year) & Core PCE (Year-over-Year) all being reported at 8:30 am.
American Express, Autoliv, Badger Meter, Booz Allen Hamilton, Colgate-Palmolive, First Hawaiian, Fortis, Gentex, Imperial Oil, Norfolk Southern, Southside Banc & Stellar Bank wind the week down on the earnings report front on Friday.
See you back here next week!
*** I DO NOT OWN SHARES OR OPTIONS CONTRACT POSITIONS IN SPY, QQQ, IWM OR DIA AT THE TIME OF PUBLISHING THIS ARTICLE ***
SPY, the SPDR S&P 500 ETF gained +1.87% over the past week, having the second strongest week out of the major indexes.
SPY ETF – SPDR S&P 500 ETF’s Technical Performance Over The Past Year
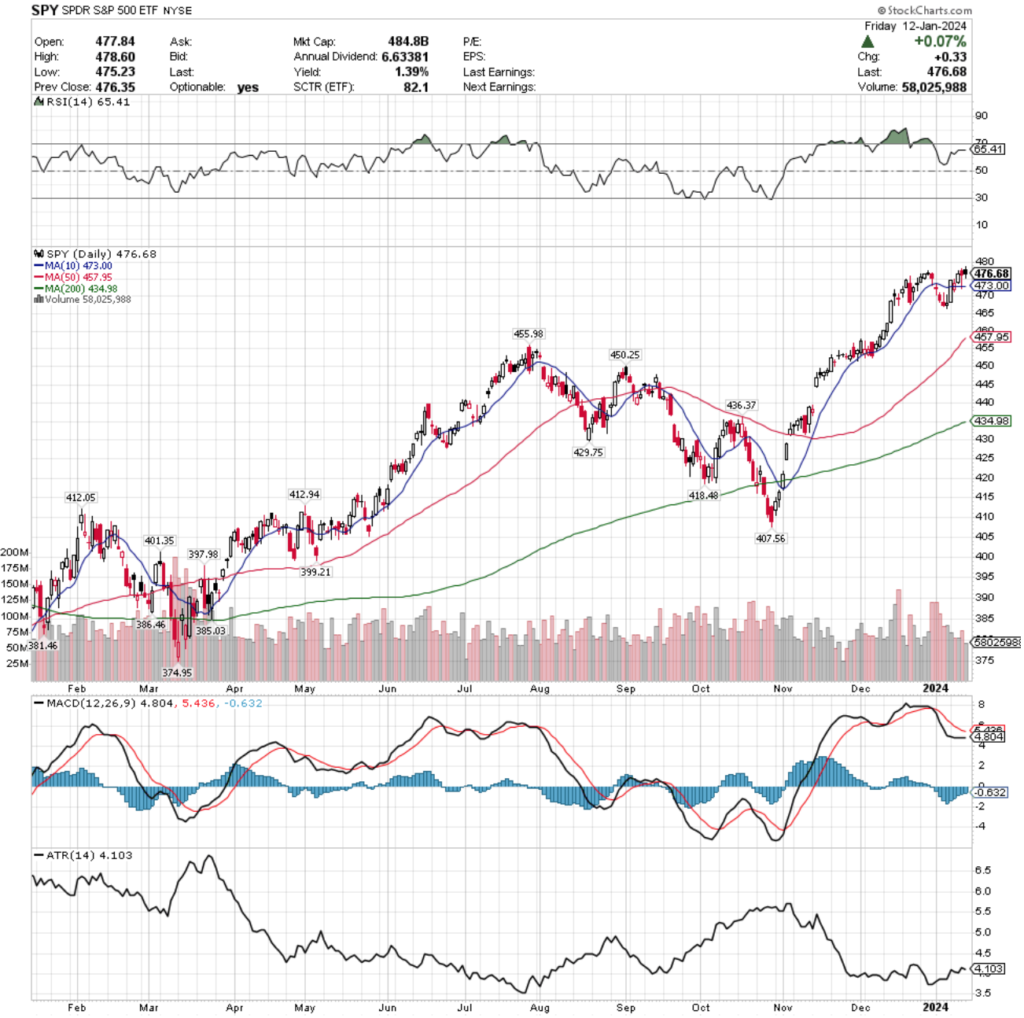
Their RSI is currently moving flatly near the overbought mark of 70 & currently sits at 65.41, while their MACD is bearish but also moving relatively flat towards the signal line, which often is an indication that there are further declines on the near-term horizon.
Volumes were -16.1% below average this week compared to the year prior (68,801,160 vs. 82,000,643), which signals a lack of enthusiasm among investors as they take a “wait & see” approach heading deeper into earnings season.
This lack of volume supporting the upwards price movement of last week confirms that there RSI & MACD “flattening” trends of the past year are likely to occur again & seem to think that next week will provide SPY with a downward catalyst.
SPY’s week began with a bullish crossover of the resistance level from the 10 day moving average, gaining back what was lost in a week of declines the week prior on a wide-range candle session.
The following day signaled further uncertainty & weakness at these levels with a bearish candle that opened above the 10 DMA, but there was appetite for slightly higher prices as it tested higher than Monday’s high, but ultimately fell through the 10 DMA’s support, as investors took some profits from the day prior’s gains.
Wednesday continued the theme of caution, as the candle’s real body lacks much of a lower shadow but does have an upper shadow, indicating that there could be room for slight advances, but market participants are still on the fence.
Thursday’s session produced a hanging man candle, an ominous signal, particularly as it tested & broke through the 10 day moving average’s support temporarily, despite opening & closing above it.
Friday the week closed out on an uncertain, but not overly bright note, as the session ended in a spinning top candle, that while bullish day-over-day, had a bearish twist to it given that the day closed lower than it opened.
SPY’s Average True Range is also trending downwards after the past week, indicating that there has been a lack of volatility & no strong trend, which typically precedes an uptick at these low levels.
Something that will be worth continuing to keep an eye on is the 50 day moving average, which is now the second support touch-point.
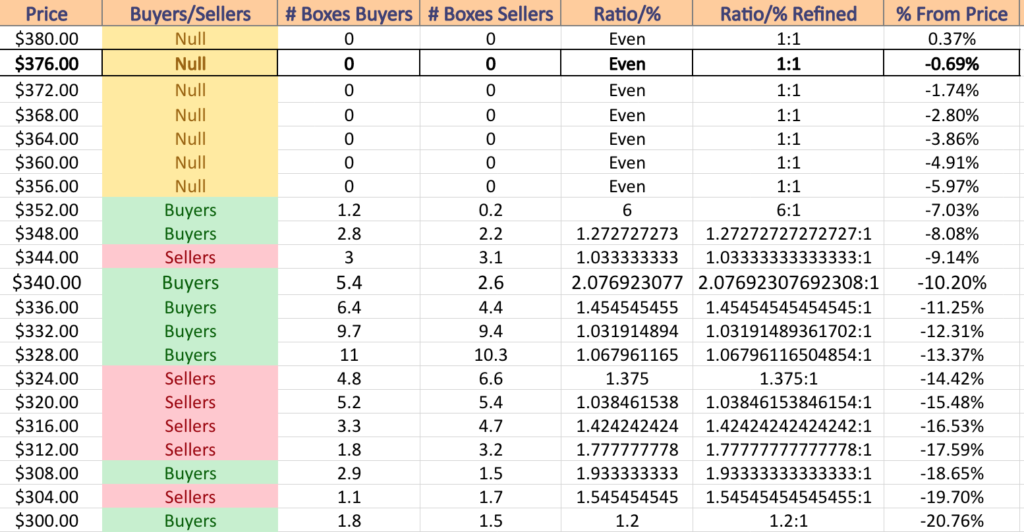
Given that we are at a new 52-week high, there is limited insight into how strong the 10 & 50 DMA support levels will be, which often means that sellers will be itching to take profits off of the table at these levels.
If true, that would mean that there is a risk of a -4.34% move for SPY to the downside before it reaches a support level that has past tendencies to be Buyer oriented ($455.98/share has been 2.33 Buyers to each Seller over the past 1-2 years).
Should that level be tested, it may pave the way for further consolidation, as aside from the $436-439.99/share price zone (-7.62% from current price), the Buyer dominance dilutes until a -9.3% drop in price, at which point a seller dominated price zone is entered at $431.99/share, where the seller influence stays strong until a decline of -12.65% from the current price.
That’s not to say that this will be the case, but based on past buyer & seller behavior it is something to keep an eye on should SPY find itself needing to find support.
SPY has support at the $473 (10 Day Moving Average; Volume Sentiment: NULL, 0:0*), $457.95 (50 Day Moving Average; Volume Sentiment: NULL, 0:0*), $455.98 (Volume Sentiment: Buyers, 2.33:1) & $450.25/share (Volume Sentiment: Buyers, 2.13:1) price levels, with no past year resistance levels as they are at their 52-week high.
SPY ETF’s Price Level:Volume Sentiment From The Past 1-2 Years
QQQ, the Invesco QQQ Trust ETF advanced +3.23% over the past week, having the strongest weekly performance of the major indexes.
QQQ ETF – Invesco QQQ Trust ETF’s Technical Performance Over The Past Year
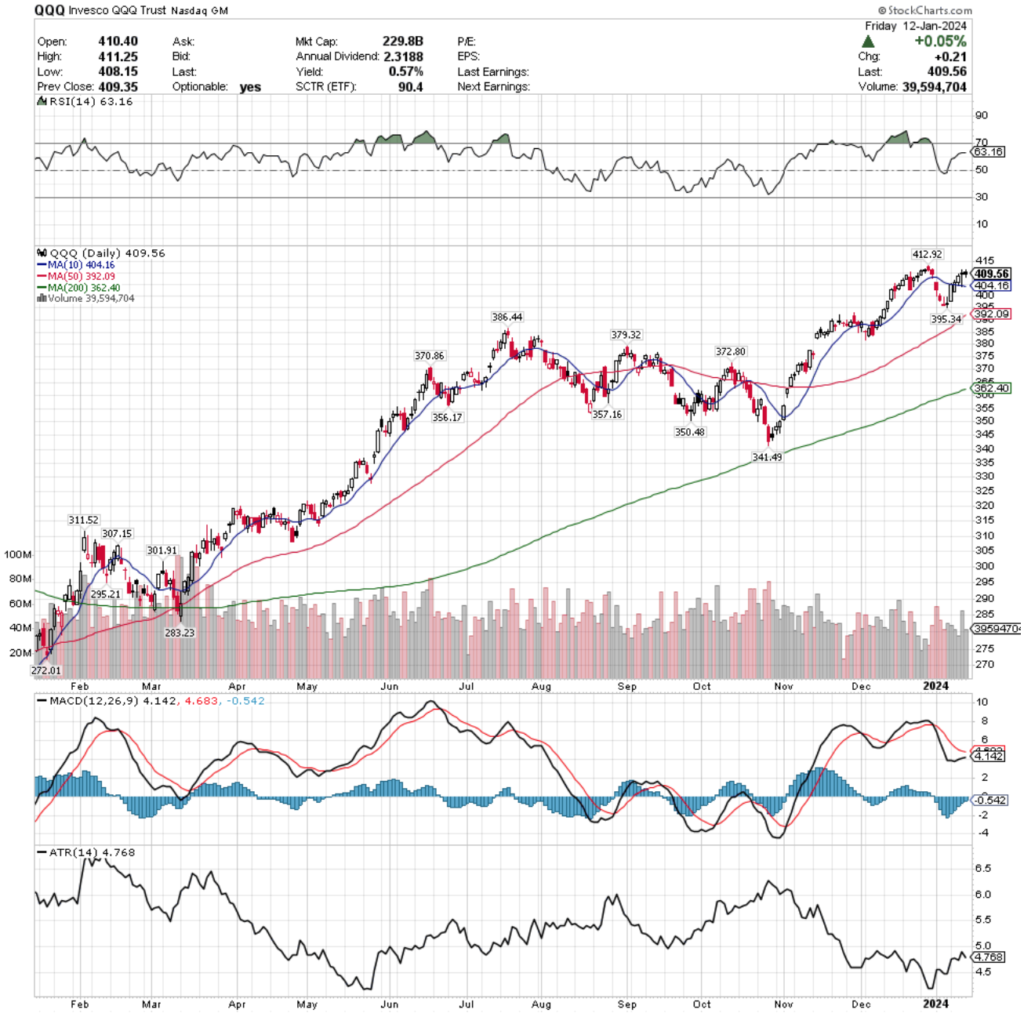
Like SPY, QQQ’s RSI is also relatively flat & currently sits closer to overbought than neutral at 63.16, while their MACD line is also relatively flat, but approaching the signal line.
Volumes were -19.76% lower than average last week compared to the year prior (41,937,420 vs. 52,265,769), which is not a signal of strength following the +3.23% advance of last week.
The previous week & a half had been steady declines, which notably featured the breakdown of the support of the 10 day moving average, so this weak level of volumes on a week of only advancing sessions indicates extreme caution & that folks aren’t eager to jump back into the pool just yet.
Monday opened the week up with a wide range candle that was unable to break the resistance of the 10 day moving average.
Tuesday opened midway through Monday’s candle’s real body & marched higher to close narrowly above the 10 DMA, with a slight upper shadow indicating that there was some slight risk on apetite.
Wednesday the support of the 10 day moving average was maintained as the session moved QQQ higher.
Thursday is when things began to get a bit more dicey & cracks began to show for QQQ’s near-term outlook.
The highest volume session of the week looks to have contained a bit of profit taking by market participants, who ultimately decided that they were uncertain of QQQ’s valuation at its current price level.
The dragonfly doji candle marked the session, but the test to the downside did temporarily break the support of the 10 day moving average, signaling that there is not much conviction behind its strength at these price levels (also indicates the profit taking from the prior sessions of the week).
Friday’s session also resulted in a doji that only budged forward +0.05% from Thursday, which is not a strong indicator of confidence.
Much like SPY, QQQ’s Average True Range is also trending downward, but the price action of the past few sessions looks to have formed an inverse head & shoulders pattern in the ATR line, which would indicate there is volatility on the horizon.
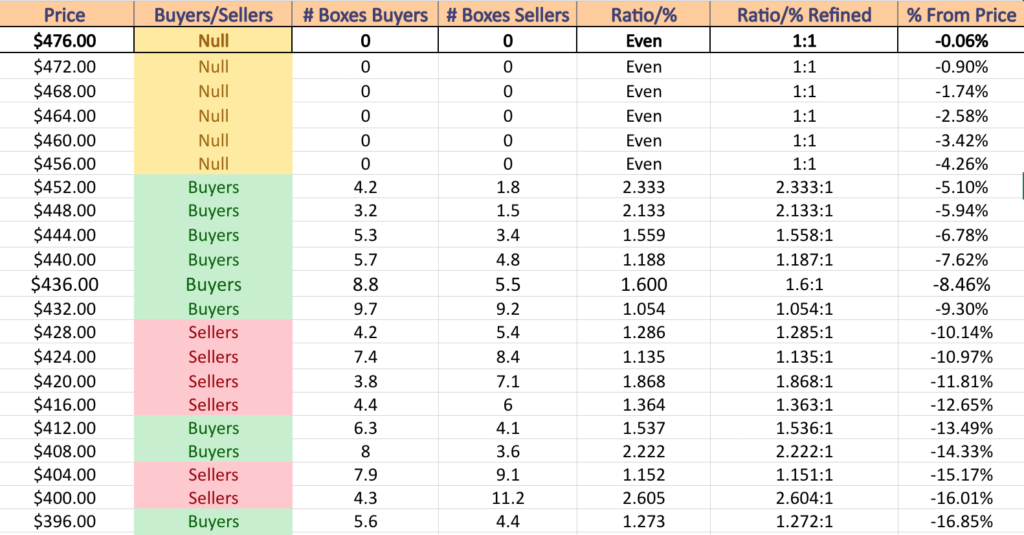
QQQ has more support near the current price than SPY does, which will help some of the near-term volatility, however a -5.65% decline is facilitated by the fact that there is limited volume data for these levels before a support level that is historically 1.55 Buyers to every Seller occurs.
Due to the five & a half month floundering around in the consolidation range of $386.44-341.49 there may be some strength here for support, but sellers will still be coming out at these levels.
There is a -13.96% potential decline that currently has mostly buyer dominated sentiment over the past 1-2 years, but it seems most likely that if there is a downside test that breaks that $386.44 price level that the Buyer zones below will either become more diluted, or become Seller dominated in the near-to-mid term.
QQQ has support at the $404.09 (10 Day Moving Average; Volume Sentiment: NULL, 0:0*), $395.34 (Volume Sentiment: NULL, 0:0*)$392.08 (50 Day Moving Average; Volume Sentiment: NULL, 0:0*) & $386.44/share (Volume Sentiment: Buyers, 1.55:1) price levels, with resistance at the $412.92/share (Volume Sentiment: NULL, 0:0*) price level.
QQQ ETF’s Price Level:Volume Sentiment From The Past 1-2 Years
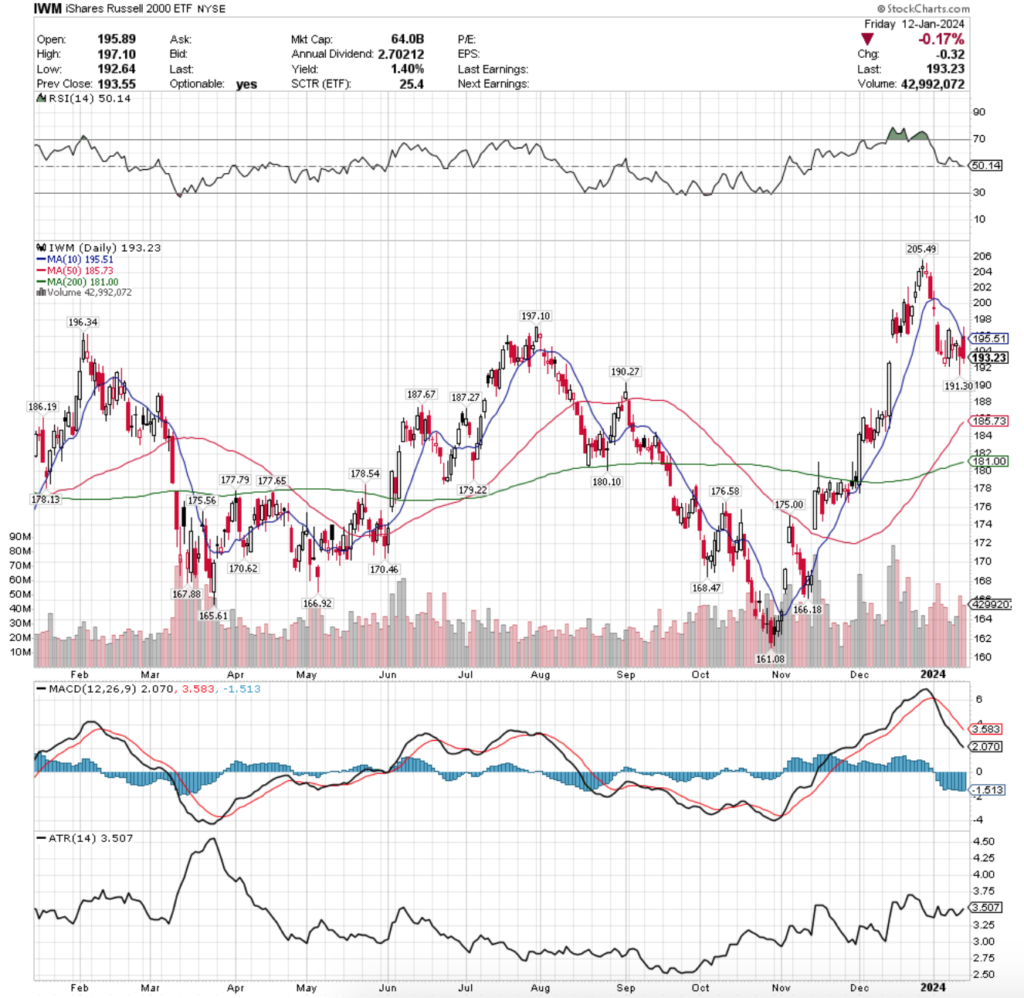
IWM ETF – iShares Russell 2000 ETF’s Technical Performance Over The Past Year
Their RSI is neutral at 50.14, while their MACD is in bearish decline following the declines of the new year.
Volumes were +15.74% above average last week compared to the year prior (37,456,920 vs. 32,362,470), which casts a bearish picture given that the two strongest sessions by volume were Thursday & Friday’s declines.
Monday’s session stopped the bleeding from last week with a wide range candle, however the lower shadow is longer than the upper shadow meaning that there was still a test for more downside & Monday’s session also had the lowest volume of the week, despite having the widest real body (also bearish).
The rest of the week became a consolidation range that filled in the window left by a gap up from early-to-mid December.
Tuesday’s session produced a bearish harami pattern, while Wednesday’s candle was a hanging man, signaling indecision & a probable reversal to the downside.
Thursday confirmed this & gave us a test to the downside, with the very long lower shadow hitting -1.94% lower than the session prior’s close.
Friday opened markedly higher as investors wanted to test the resistance of the very bearish looking 10 day moving average.
While IWM temporarily broke out above it, it was short lived & the day closed lower & tested even lower than where it closed.
Given the high volume of these sessions & their continuance to test to the downside, it appears that the near-term outlook for IWM is also bleak & will feature further consolidation/declines.
Their ATR is currently trending upwards, meaning that we may begin to see some even larger, more volatile moves in the coming week.
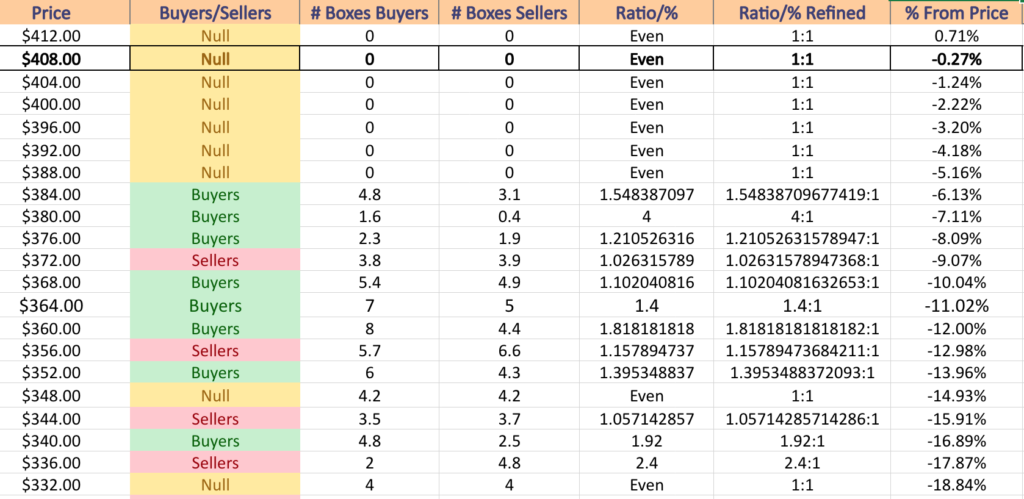
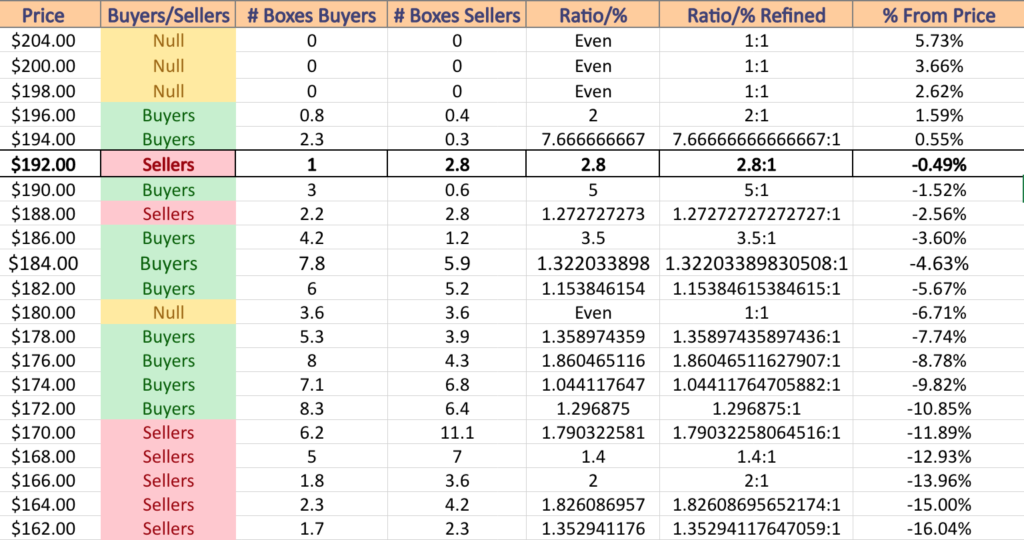
There is a lot of historic Buyer sentiment for IWM at their next support levels from the past 1-2 years, which is mostly all Buyer dominated for the next -10.85% minus the $188-189.99 zone that the sellers dominated & the $180-181.99/share zone which has been even Buyers:Sellers 1:1.
Given the way IWM tends to oscillate around a more centralized zone of prices compared to the aggressive growth of other indexes this may hold up, but if it breaks down there is nothing but Seller sentiment all the way down to their 52-week low.
IWM has support at the $191.30 (Volume Sentiment: Buyers, 5:1), $190.27 (Volume Sentiment: Buyers, 5:1), $187.67 (Volume Sentiment: Buyers, 3.5:1) & $187.27/share (Volume Sentiment: Buyers, 3.5:1) price levels, with resistance at the $195.49 (10 Day Moving Average; Volume Sentiment: Buyers, 7.67:1), $196.34 (Volume Sentiment: Buyers, 2:1), $197.10 (Volume Sentiment: Buyers, 2:1) & $205.49/share (Volume Sentiment: NULL, 0:0*) price levels.
IWM ETF’s Price Level:Volume Sentiment From The Past 1-2 Years
DIA, the SPDR Dow Jones Industrial Average ETF edged forward +0.34% last week, as they have slowed down over the past two weeks after a couple of months of explosive growth & being an investor favorite.
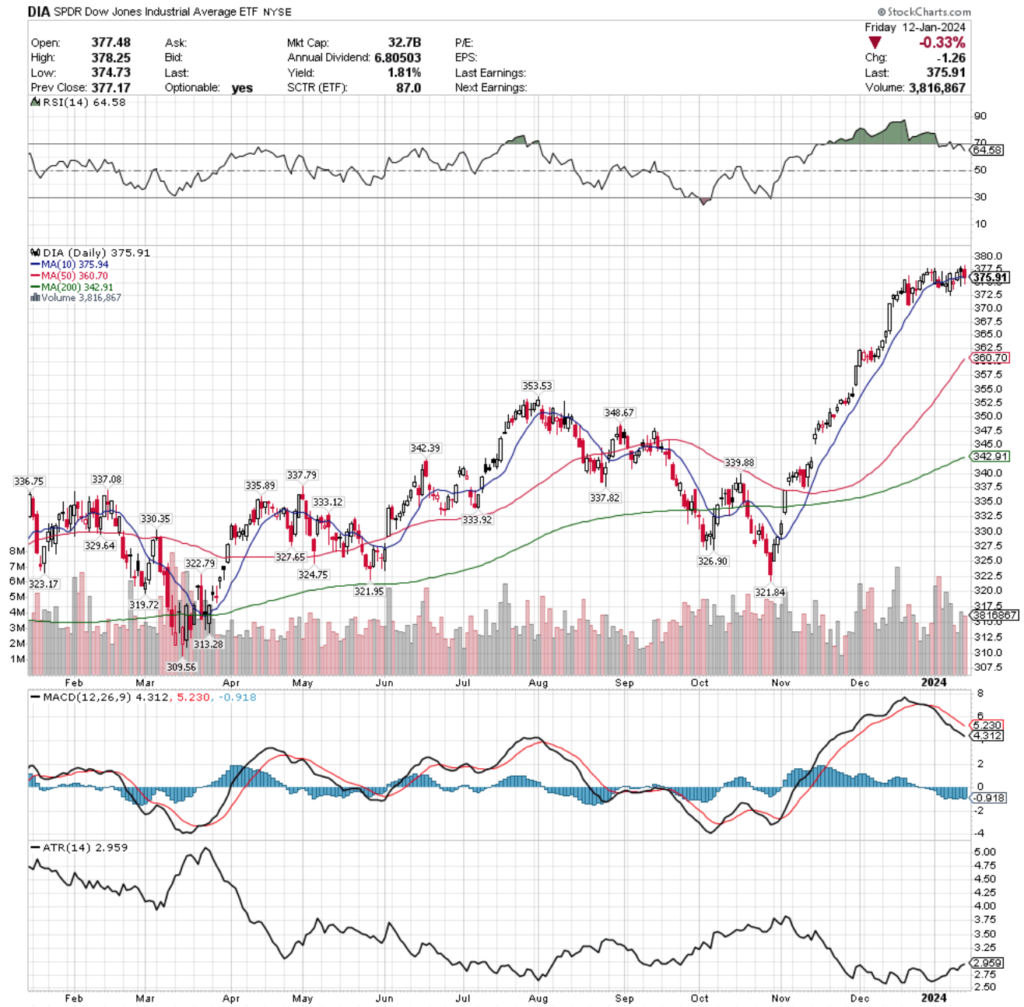
DIA ETF – SPDR Dow Jones Industrial Average ETF’s Technical Performance Over The Past Year
Their RSI is trending back towards neutral from overbought, but still sits high at 64.58, while their MACD is declining.
Volumes were +5.57% above average last week compared to the year prior (3,693,380 vs. 3,498,473), indicating that there is a great deal of indecision among investors at this price level, given how small their week’s advance was.
Monday kicked the week off on a bullish note, with a wide range session that briefly tested lower before powering through the resistance of the 10 day moving average.
Tuesday thought began to indicate that there is weakness in the current price sentiment, as the day closed with a spinning top candle that completed a bearish harami that opened & closed below the 10 DMA & was unable to break through it to the upside during the day’s session.
Wednesday opened below the 10 DMA, but was able to break through the resistance, but it should be noted that this move was done on the weakest volume of the week, which is not a signal of confidence.
Thursday confirmed this, when a hanging man candle closed the session indicating that there is far more interest in prices being lower than their current mark (as noted by the lower shadow, which broke deep below the 10 DMA’s support) & the candle itself’s real body closed lower than it opened, indicating weakness & uncertainty.
The risk-off theme continued on Friday, with a declining session that broke through the support of the 10 day moving average, tested much lower, before closing just beneath it.
The 10 DMA is also beginning to curl over bearishly, which would mean that its resistance level would be applying downward pressure on DIA’s share price.
This is troubling, as like SPY & QQQ, DIA’s 50 DMA is the next highest level of support, but currently does not have meaningful enough data to gauge whether it is a buyer or seller dominated zone over the past 3-4 years.
The next support level is -5.95% below the current price, which while it is Buyer dominated 6:1, it has not faced any downside pressure over the past 3-4 years, so it will likely not hold up particularly strongly (at least as strongly as the 6:1 ratio implies).
The $319-321 support zone will be an interesting area to keep an eye on should prices decline towards there, as it is seller dominated, but has not been tested much to the upside.
In the event that it does not hold up, there is likely going to be a re-test of the 52-week low based on the Seller Sentiment at those price levels.
Their ATR is beginning to perk higher, indicating that there is slightly more volatility in DIA’s trading, which will likely continue into earnings season as investors begin to take chips off of the table in the beginning of the new year.
DIA has support at the $360.70 (50 Day Moving Average; Volume Sentiment: NULL, 0:0*), $353.53 (Volume Sentiment: Buyers, 6:1), $348.67 (Volume Sentiment: Buyers, 1.27:1) & $342.91/share (200 Day Moving Average; Volume Sentiment: Buyers, 2.08:1) price levels, with resistance at the $375.91/share (10 Day Moving Average; Volume Sentiment: NULL, 0:0*) price level.
DIA ETF’s Price Level:Volume Sentiment From The Past 3-4 Years
The Week Ahead
Monday there are no major data announcements or earnings reports as the markets will be closed for Martin Luther King day.
Tuesday Fed Governor Christopher Waller is scheduled to speak at 11 am.
Goldman Sachs, Calavo Growers, Fulton Financial, Hancock Whitney, Interactive Brokers, Morgan Stanley, Pinnacle Financial Partners, PNC & Progress Software are all scheduled to report earnings on Tuesday.
Wednesday kicks off with Import Price Index, Import Price Index minus Fuel, U.S. Retail Sales & Retail Sales minus Autos at 8:30 am, Fed Vice Chair for Supervision Michael Barr & Fed Governor Michelle Bowman speak at 9 am, before Industrial Production & Capacity Utilization data are released at 9:15 am.
After that on Wednesday, the Fed’s Beige Book is released at 2pm, followed by New York Fed President John Williams speaking at 3pm.
Kinder Morgan, Alcoa, Charles Schwab, Citizens Financial Group, Discover Financial Services, H.B. Fuller, Prologis, Synovus, U.S. Bancorp & Wintrust Financial all report earnings on Wednesday.
Atlanta Fed President Raphael Bostic speaks at 7:30 am & 12:05 pm on Thursday, in addition to Initial Jobless Claims, the Philadelphia Fed Manufacturing Survey, Housing Starts & Building Permits data being released at 8:30 am.
Bank OZK, F.N.B. Corp, Fastenal, First Horizon, Home Bancshares, J.B. Hunt Transport, KeyCorp, M&T Bank, Northern Trust, PPG Industries, Texas Capital Bancshares & WNS are all reporting earnings on Thursday.
Friday the week winds down with Consumer Sentiment (prelim) & Existing Home Sales at 10 am, Fed Vice Chair for Supervision Michael Barr speaking at 1om & San Francisco Fed President Mary Daly speaking at 4:15pm.
Travelers, Ally Financial, Comerica, Fifth Third, Huntington Banc, Regions Financial, SLB & State Street are all scheduled to report earnings on Friday.
See you back here next week!
*** I DO NOT OWN SHARES OR OPTIONS CONTRACT POSITIONS IN SPY, QQQ, IWM OR DIA AT THE TIME OF PUBLISHING THIS ARTICLE ***
Viatris Inc. stock trades under the ticker VTRS & has advanced +7.82% over the past year (ex-dividends).
They’ve declined -3.12% from their 52-week high reached yesterday & they have recovered +38.44% (ex-dividends) from their 52-week low that was reached in October of 2023.
Technical Analysis Of Viatris Inc. VTRS Stock
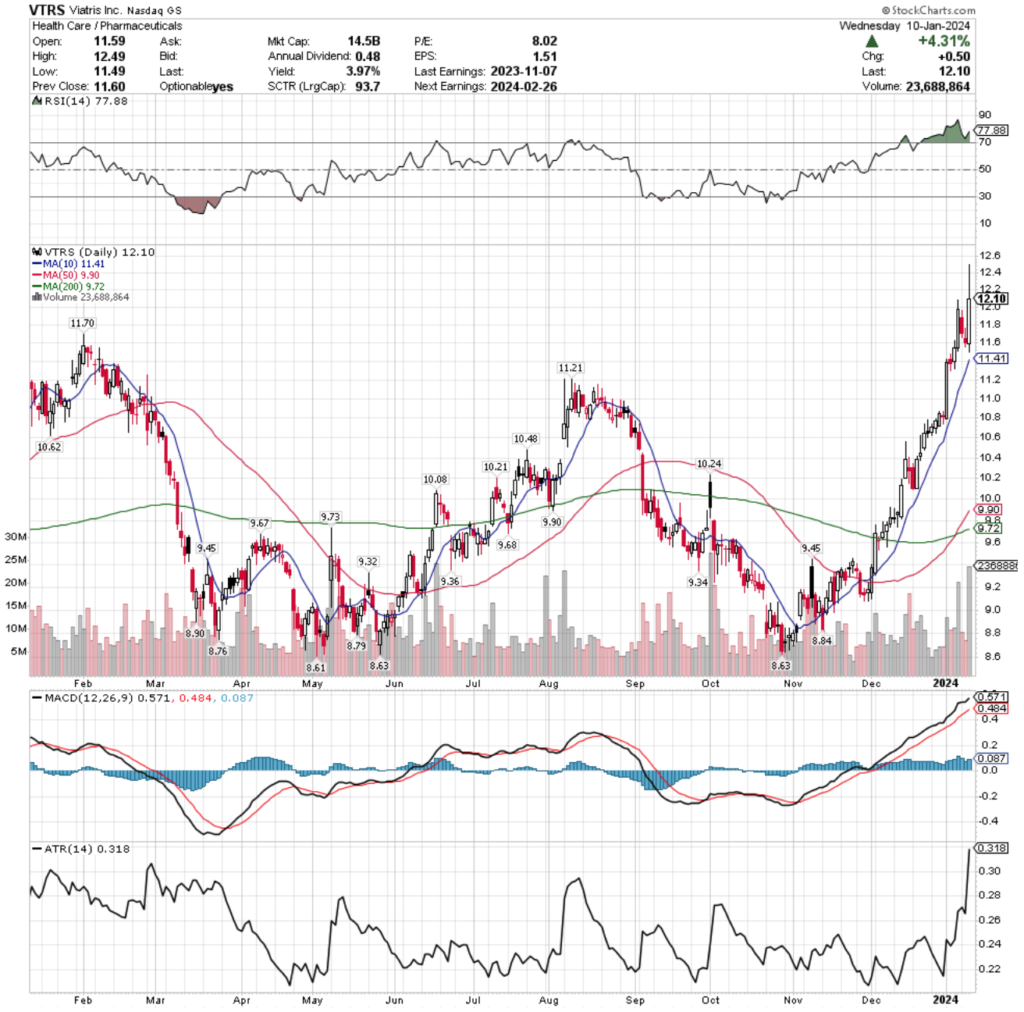
Viatris Inc. VTRS Stock’s Technical Performance Over The Past Year
Their RSI is currently overbought at 77.88 following their steady ascent that began in mid-November 2023, while their MACD is pushing higher bullishly in a diagonal line.
Volumes over the past week have been +54.19% above average compared to the year prior (14,186,620 vs. 9,200,682.47), as investors were eager to pile into the wide range sessions of last Friday & yesterday, leading to the fresh 52-week high.
The highest level volume came on yesterday’s session, followed by the bullish session on last Friday, with the two bearish sessions in between those days having below average volume, signaling investor confidence.
Last Tuesday the big lift took place on a wide range session that resulted in a daily gain of +5.17%, which was followed by a spinning top on Wednesday where market participants were unsure as to where the price should go next & some profit taking from the day prior took place.
The spinning top candle was on the upper part of Tuesday’s candle & above its upper shadow, signaling that there was still bullish sentiment, however.
Thursday the rally continued higher, although there was some second guessing based on the lower shadow of the session’s candle, but Friday was full on risk-on by market participants, pushing prices +3.72% higher.
This week began with two cool down sessions, but Tuesday’s spinning top candle indicated that there was uncertainty back in the market, leading into yesterday’s bullish wide range session.
There appears to be a head & shoulders appearing since the start of next week, which will be an important thing to keep an eye on as we move into next week.
This is particularly important now as they set a new 52-week high yesterday & market participants will be sure to want to take some profits off of the table in the near-term.
Their Average True Range is indicating that they are in a strong trend with wide-ranging price days.
There are only three support touch-points for the next -13.39%, which include $11.70, $11.41 (10 Day Moving Average) & $11.21/share.
Given that the 10 DMA is continuing to march higher, once that has been broken as a support level there looks to be a lot of area for sellers to step in.
This makes it important to have an understanding of how investors have behaved previously when VTRS stock has been at the price levels it is currently at.
The price level:volume sentiment analysis below provides 4-5 years of price data & how investors have behaved at each level based on the volume levels.
It is not investment advice, but rather an additional tool to add into your due diligence process.
Price Level:Volume Sentiment Analysis For Viatris Inc. VTRS Stock
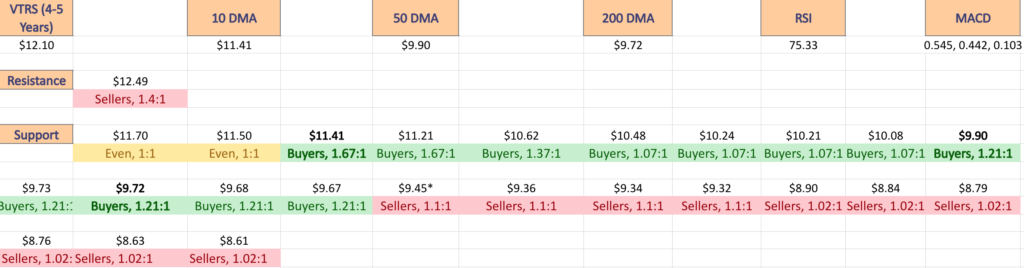
Due to prices being at an extreme as VTRX is at a 52-week high, the next support levels are currently even, where buyers & sellers have participated at a 1:1 ratio.
Buyers step in at the $11-11.50/share price box at a rate of 1.67:1, but that support grows weaker as it gets closer to the $10-10.50/share box, where Buyers have edged out sellers at a rate of 1.07:1 over the past 4-5 years.
Buyers continue to be in control until $9.49/share, which is where Sellers step in & have dominated all of the other 1 year support levels.
This is a -21.5% move down to reach that price level, highlighting the importance of the $10.62/share support level, as should that be broken there is not much strength in the consolidation areas that have the other support levels in terms of Buyers:Sellers strength.
In the event of declines, the table below can be referenced to get an idea as to how the market has previously valued VTRS stock & how they might again as it approaches different support levels.
Again, always do your own due diligence when making investing/trading decisions.
Viatris Inc. VTRS Stock’s Price Level:Volume Sentiment For The Past 4-5 Years, Including Support & Resistance Levels
Viatris Inc. VTRS Stock’s Price Level:Volume Sentiment For The Past 4-5 Years
Viatris Inc. VTRS Stock’s Price Level:Volume Sentiment For The Past 4-5 Years
Viatris Inc. VTRS Stock’s Price Level:Volume Sentiment For The Past 4-5 Years
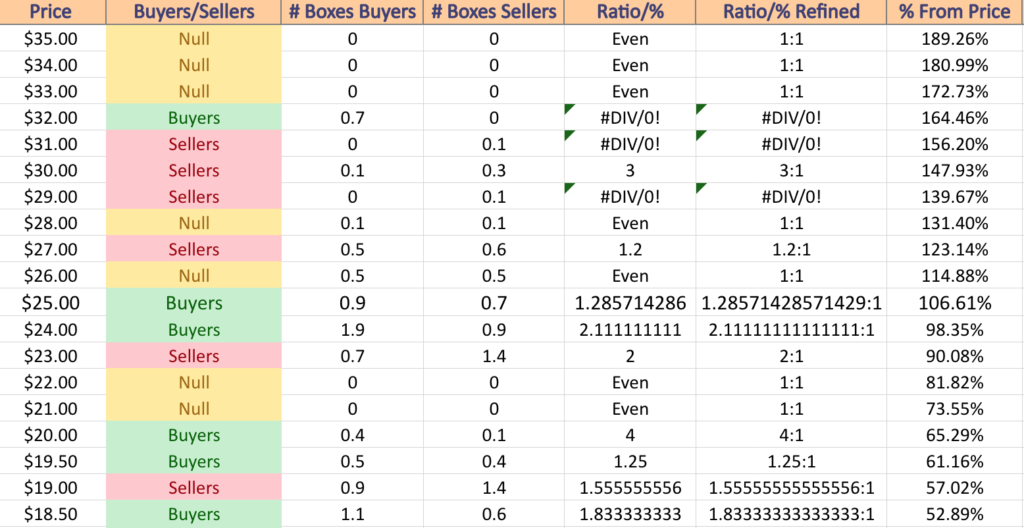
$35 – NULL – 0:0*; +189.26% From Current Price Level
$34 – NULL – 0:0*; +180.99% From Current Price Level
$33 – NULL – 0:0*; +172.73% From Current Price Level
$32 – Buyers – 0.7:0*; +164.46% From Current Price Level
$31 – Sellers – 0.1:0*; +156.2% From Current Price Level
$30 – Sellers – 3:1; +147.93% From Current Price Level
$29 – Sellers – 0.1:0*; +139.67% From Current Price Level
$28 – Even – 1:1; +131.4% From Current Price Level
$27 – Sellers – 1.2:1; +123.14% From Current Price Level
$26 – Even – 1:1; +114.88% From Current Price Level
$25 – Buyers – 1.29:1; +106.61% From Current Price Level
$24 – Buyers – 2.11:1; +98.35% From Current Price Level
$23 – Sellers – 2:1; +90.08% From Current Price Level
$22 – NULL – 0:0*; +81.82% From Current Price Level
$21 – NULL – 0:0*; +73.55% From Current Price Level
$20 – Buyers – 4:1; +65.29% From Current Price Level
$19.50 – Buyers – 1.25:1; +61.16% From Current Price Level
$19 – Sellers – 1.56:1; +57.02% From Current Price Level
$18.50 – Buyers – 1.83:1; +52.89% From Current Price Level
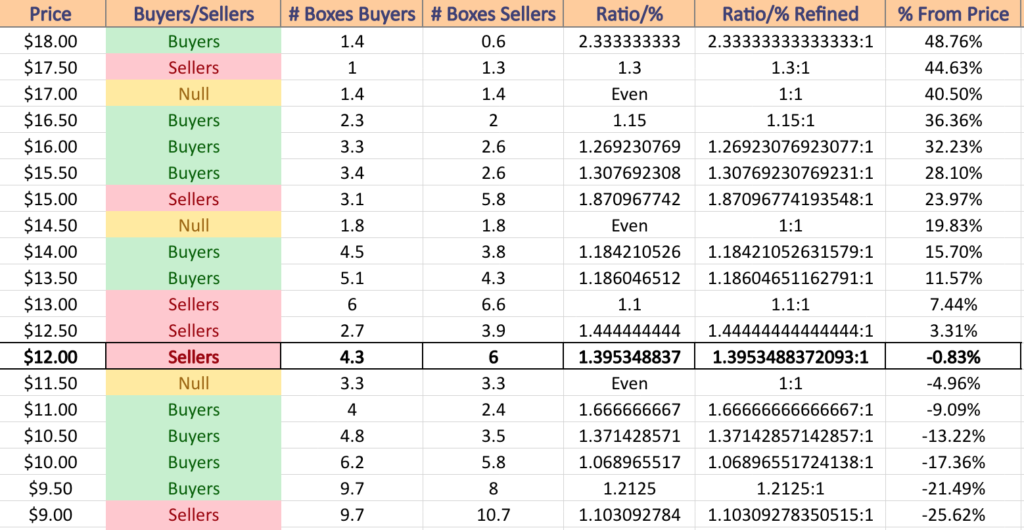
$18 – Buyers – 2.33:1; +48.76% From Current Price Level
$17.50 – Sellers – 1.3:1; +44.63% From Current Price Level
$17 – Even – 1:1; +40.5% From Current Price Level
$16.50 – Buyers – 1.15:1; +36.36% From Current Price Level
$16 – Buyers- 1.27:1; +32.23% From Current Price Level
$15.50 -Buyers – 1.31:1; +28.1% From Current Price Level
$15 – Sellers – 1.87:1; +23.97% From Current Price Level
$14.50 – Even – 1:1; +19.83% From Current Price Level
$14 – Buyers – 1.18:1; +15.7% From Current Price Level
$13.50 – Buyers – 1.19:1; +11.57% From Current Price Level
$13 – Sellers – 1.1:1; +7.44% From Current Price Level
$12.50 – Sellers – 1.44:1; +3.31% From Current Price Level
$12 – Sellers – 1.4:1; -0.83% From Current Price Level – Current Price Box*
$11.50 – Even – 1:1; -4.96% From Current Price Level
$11 – Buyers – 1.67:1 – -9.09% From Current Price Level – 10 Day Moving Average*
$10.50 – Buyers – 1.37:1; -13.22% From Current Price Level
$10 – Buyers – 1.07:1; -17.36% From Current Price Level
$9.50 – Buyers – 1.21:1; -21.49% From Current Price Level – 50 & 200 Day Moving Averages**
$9 – Sellers – 1.1:1; -25.62% From Current Price Level
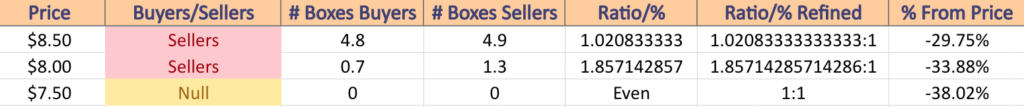
$8.50 – Sellers – 1.02:1; -29.75% From Current Price Level
$8 – Sellers – 1.86:1; -33.88% From Current Price Level
$7.50 – NULL – 0:0*; -38.02% From Current Price Level
*** I DO NOT OWN SHARES OR OPTIONS CONTRACT POSITIONS IN VTRS STOCK AT THE TIME OF PUBLISHING THIS ARTICLE ***
SPY, the SPDR S&P 500 ETF declined -1.54% this past week, faring second best of the major indexes only to the Dow Jones Industrial Average, as market participants sought the safety of larger cap names.
SPY ETF – SPDR S&P 500 ETF’s Technical Performance Over The Past Year
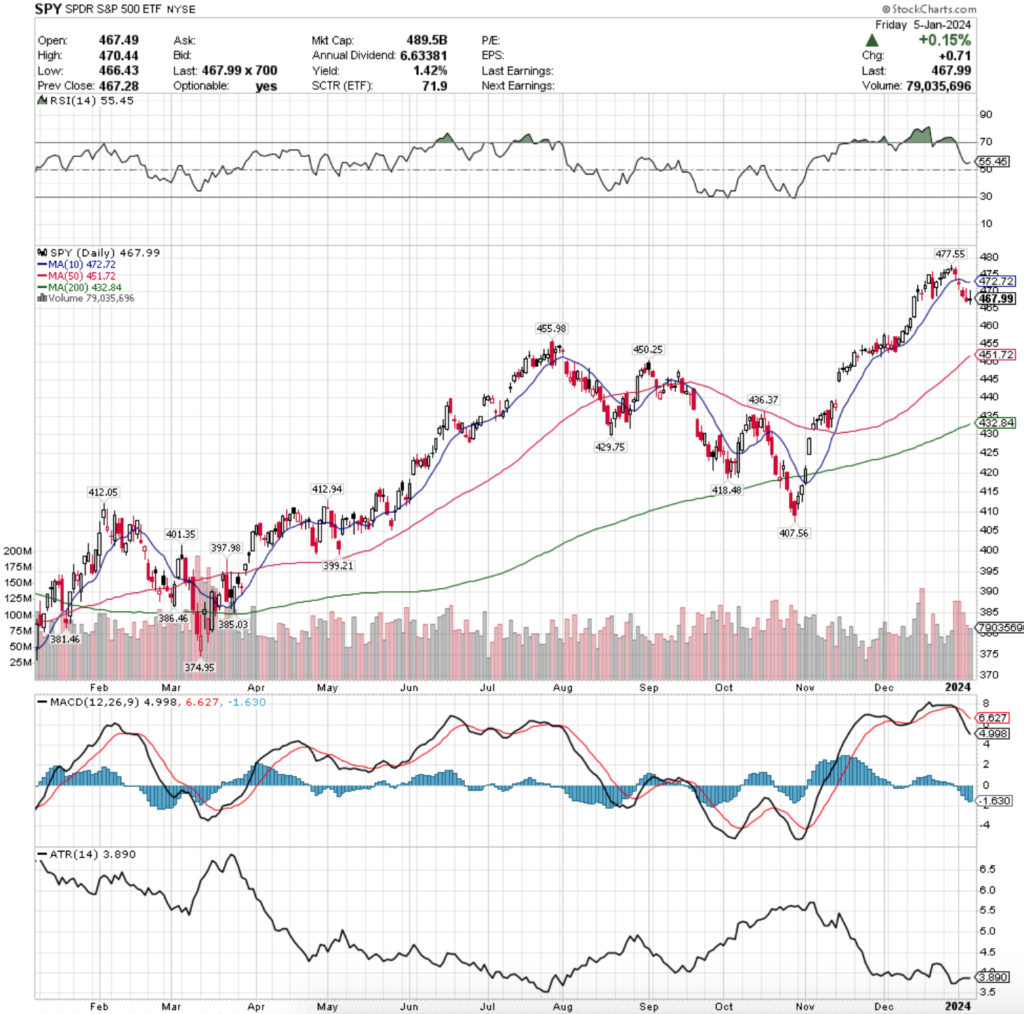
Their RSI has trended back towards neutral after spending most of December in overbought territory & currently sits at 55.25, while their MACD is currently in bearish decline following the declines of the past week & a half.
Volumes were 20.73% above average compared to the year prior (99,250,522 vs. 82,211,072), with the first two sessions of the week’s declines being the heaviest, following last Friday’s footsteps as market participants were eager to take chips off of the table following the new 52-week high set the week prior.
This will be something to keep an eye on, given how weak the inflow volume has been the couple of weeks before that, especially now that the support of the 10 day moving average has been broken.
Another key area to be watching is the wide range candle from 12/13/2023, whose high & low for the session were $468.86 & $462.25.
While that range is only 1.4%, when compared to the other candles of the past 2 months it is one of the largest, and is currently keeping the gate before prices would decline into a range that would begin the creation of the right hand shoulder, with the 52-week high as the head.
The 50 day moving average is currently set up in a manner that would be able to provide support & an easing into said shoulder, which would likely be caused by a weaker than anticipated earnings season on the horizon.
The 10 DMA was able to support last Friday’s spinning top session, but Tuesday’s session opened below the 10 DMA, tested it & ultimately closed below the open, resulting in a spinning top candle.
While the real body is concentrated towards the top of the candle, the close being below the open on an already down session set a bearish tone for the week.
Wednesday the declines continued, although seller volume slightly dipped from the higher levels of Friday & Tuesday.
Another sign of uncertainty came Thursday when a spinning top candle was the result of the day’s session, but the real body of the candle was confined to the bottom 30% of the candle, which signaled that the ice may be starting to crack.
Friday continued the theme of uncertainty, with a +0.14% gain on a doji candle; which isn’t exactly risk off, but showed that there was hardly any appetite for more risk either.
Friday did see a little participation than Thursday, but given the resulting candle was a doji that was on the lower half of the day’s range it does not signal much confidence moving into the coming week.
The candle from 12/13 is not a support level, but the open of that day’s range will be something worth looking at now, as Friday’s candle entered into the range of it.
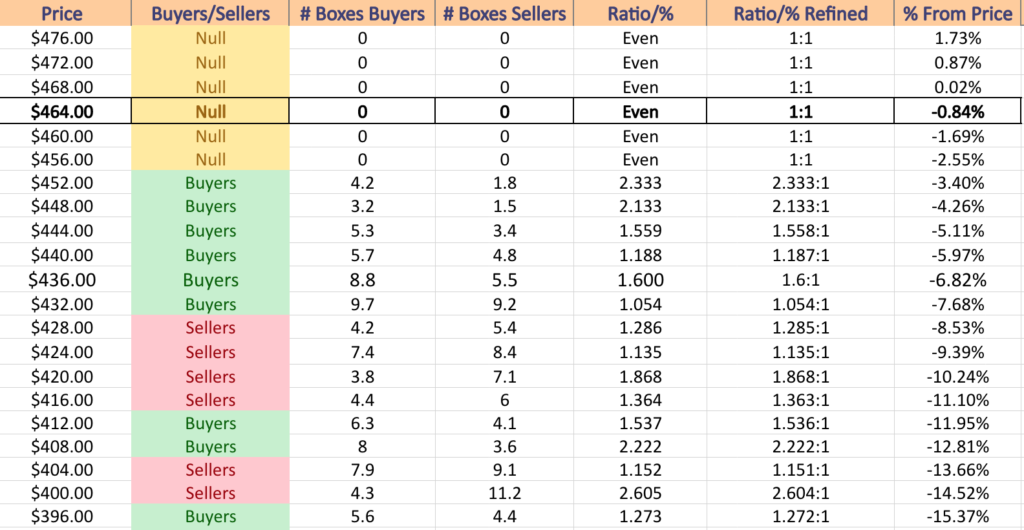
The next support level is ~2.5% below the current price where buyers have historically dominated the sellers 2.33:1 over the past 1-2 years, however given that we are near the 52-week high these numbers are skewed towards the advancing volume.
Looking at the chart below you can see that the buyer volume sentiment is currently winning the battle for the next -7.68%, but that the sentiment wanes the further down the prices go.
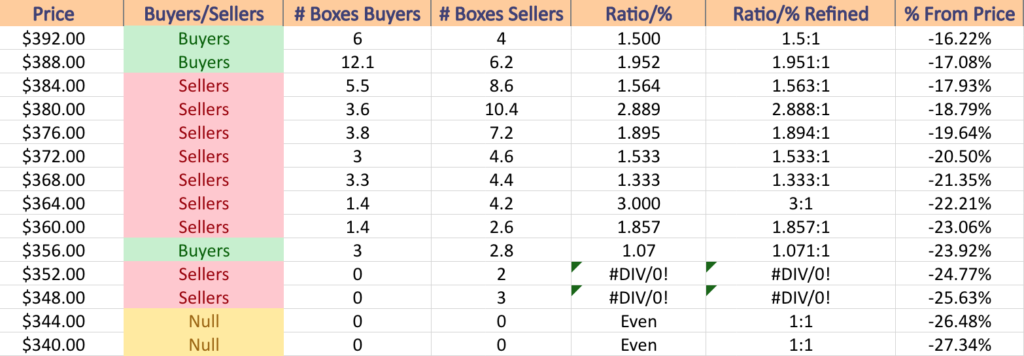
Sellers step in from there historically until a -11.1% decline, which would bring us to the $415.99-412/share range, where buyers have historically stepped back in 1.54:1.
Their Average True Range is still very low, due to the low volatility & tight trading ranges of the past couple of weeks, which will likely be increasing by the end of the coming week.
SPY has support at the $455.98 (Volume Sentiment: Buyers, 2.33:1), $451.72 (50 Day Moving Average; Volume Sentiment: Buyers, 2.13:1), $450.25 (Volume Sentiment: Buyers, 2.13:1) & $439.84/share (Volume Sentiment: Buyers, 1.6:1) price levels, with resistance at the $472.71 (10 Day Moving Average; Volume Sentiment: NULL, 0:0*) & $477.55/share (52-Week High; Volume Sentiment: NULL, 0:0*) price levels.
SPY ETF’s Price Level:Volume Sentiment Over The Past 1-2 Years
SPY ETF’s Price Level:Volume Sentiment Over The Past 1-2 Years
QQQ, the Invesco QQQ Trust ETF fell -3.12% this past week, as the tech heavy index was the second least favorite of market participants.
QQQ ETF – Invesco QQQ Trust ETF’s Technical Performance Over The Past Year
Their RSI has dipped below the neutral mark of 50 & sits at 48.19 following being in overbought territory for most of December, while their MACD is bearish & signaling further declines.
Volumes were -9.78% below average this week compared to the year prior (47,239,585 vs. 52,357,932), as market participants were skeptical following Tuesday’s declines that were steeper than last Friday’s risk off price action.
Last Friday the support of the 10 day moving average held up, but Tuesday opened, closed & tested further below the 10 DMA’s resistance, before the rest of the week was riddled with indecisive candles.
Wednesday featured a spinning top that’s real body was concentrated on the lower end of the day’s range, while Thursday & Friday’s sessions each resulted in gravestone dojis, signaling uncertainty, but with market participants favoring the bearish end of the days’ ranges.
The $400/share mark will be where to keep an eye on now, as the past two days’ sessions upper shadows tested the level, but the bodies of the candles closed ~1% below (near where they opened).
In terms of support, there are two touch-points ~2.5% below the current price of QQQ, one being the 50 day moving average at $386.03 & the other being at $386.44/share, which is a candidate for being the left shoulder in the event a head & shoulders pattern emerges, using the 52-week high as the head.
Something to keep an eye on it the 10 day moving average, as it looks identical to a head & shoulders pattern & has begun to descend into the right hand shoulder, which from where we stand today looks like it would form by the end of January.
Given that the 50 DMA is moving up at the price level though this may become interesting, as if the price breaks through its support it would then become an added layer of resistance & force QQQ’s price lower.
The 200 DMA also is something to keep watch on over the next month, as it currently is -9% below the price of QQQ & is moving higher day by day (slowly).
Given the below average volumes it does appear that there is waning sentiment towards the NASDAQ names, particularly after some of its largest components led the entire market higher on their own for the past handful of months while other companies did not perform nearly as well.
This will likely give way as market participants take some chips off of the table earlier into the year to secure profits before a year that is sure to be marred with uncertainty.
Like SPY, their Average True Range is also on the lower end of its range, due to the small price range declining sessions that we’ve seen over the past week & a half, but once earnings season begins there should be more volatility & the ATR will march higher.
This may not occur until next week as the earlier names reporting earnings may have little impact on the NASDAQ.
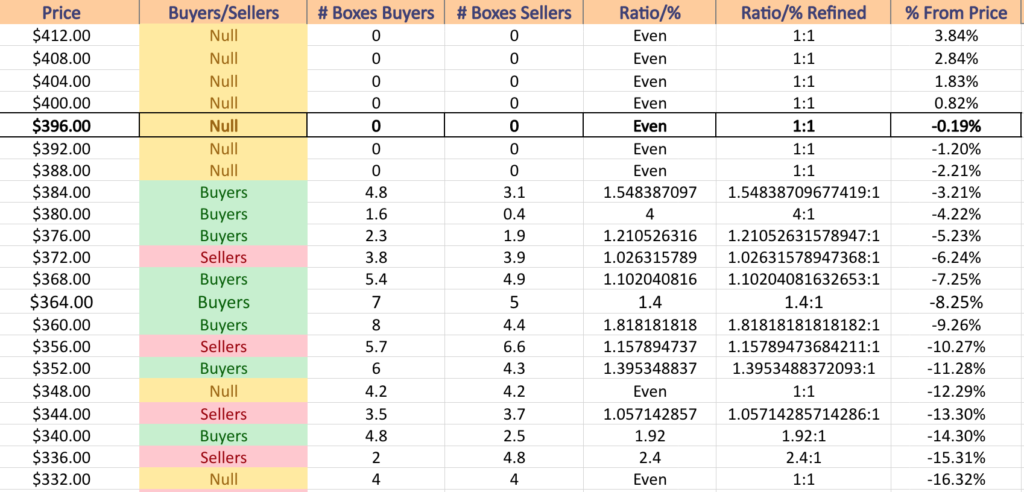
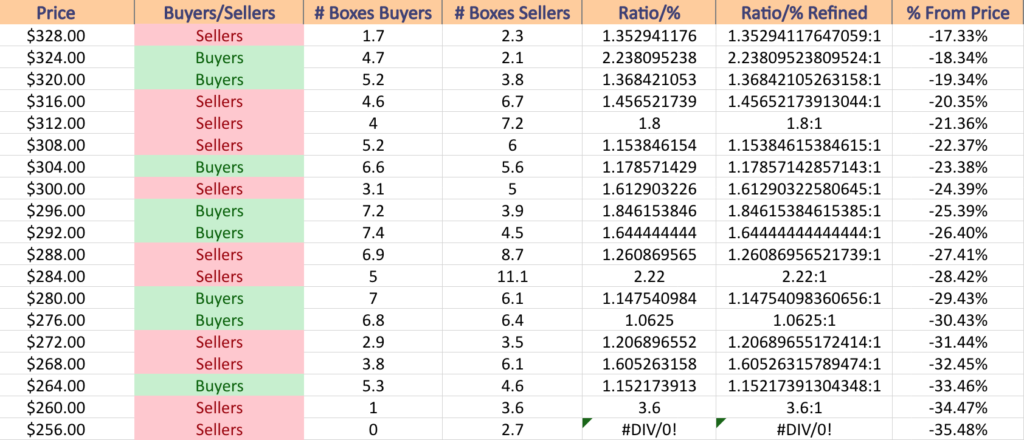
The $380-383.99/share mark will be a critical area to watch, as that is the strongest buyer dominated price zone over the past 1-2 years at 4:1 Buyers:Sellers (-4.22% from current price), with the $360-363.99/share level being next (-9.26% from current price) in terms of buyer strength.
While the other price zones are relatively buyer oriented or even, this looks primed to even out in the course of the coming few months & will be something to watch.
QQQ has support at the $393.15 (Volume Sentiment: NULL, 0:0*), $386.44 (Volume Sentiment: Buyers, 1.55:1), $386.03 (50 Day Moving Average; Volume Sentiment: Buyers, 1.55:1) & $383.35/share (Volume Sentiment: Buyers, 4:1) price levels, with resistance at the $405.27 (10 Day Moving Average; Volume Sentiment: NULL, 0:0*) & $412.92/share (52-Week High; Volume Sentiment: NULL, 0:0*) price levels.
QQQ ETF’s Price Level:Volume Sentiment Analysis Over The Past 1-2 Years
QQQ ETF’s Price Level:Volume Sentiment Analysis Over The Past 1-2 Years
IWM, the iShares Russell 2000 ETF has the worst week of the major indexes, dipping -3.69% as investors were weary of small cap names that had been enjoying a solid run up from a 52-week low in October of 2023 to a new 52-week high in December.
IWM ETF – iShares Russell 2000 ETF’s Technical Performance Over The Past Year
Their RSI has just retreated to the near neutral level & sits at 51.34, after spending most of December in overbought territory following a +27.57% run from a new 52-week low to 52-week high that began at the end of October & ended mid-December 2023.
Their MACD is also currently in bearish decline due to the declines from the 52-week high.
Volumes were 44.12% above average compared to the year prior (46,084,180 vs. 31,976,621), as market participants were eager to take their winnings off of the table, signaling that the “January Effect” may not be taking place this year.
All of this week’s bearish volumes eclipsed the volumes of the week & a half prior, signaling that there looks to be blood in the water.
Much like SPY & QQQ, last Friday’s session was held up by the support of the 10 day moving average for IWM.
However, Tuesday opened, tested & broke above the 10 DMA, before closing well below it on a doji candle, signaling uncertainty, but also a risk off attitude.
Wednesday kicked off with a gap down, which tried briefly to break higher but left a large window, before declining ~1.7% in a wide range session to the downside.
Thursday the painful outlook continued, as IWM opened near the close of the day prior, tested higher but couldn’t reach the $196/share mark, before closing lower on a spinning top candle.
Friday’s session offered a glimmer of hope that was still tainted with uncertainty, as the session opened below Thursday’s close, tested to Thursday’s high but ultimately closed lower thant he day’s open on volume that was not much weaker than Tuesday & Thursday’s.
It will be interesting to see how support levels for IWM hold up in the coming weeks, as they have been the most apt to fluctuate back & forth index compared to the others that mostly have just continued to climb before oscillating around a range near the tops.
While the next 11% decline is mostly buyer dominated levels by volume, it will be worth consulting this price level:volume sentiment analysis to see the breakdown of their support levels & prior volume sentiments at each level.
Should an 11% decline be on the cards, that hits the $172/share mark, which will test support zones created by prior consolidation ranges, however the sellers takeover there all the way down to the 52-week low, which will make it interesting to see if that low level is tested again & if it holds up or not.
Their Average True Range is near its mean & will be another area of interest to watch in the coming weeks to see whether we get more volatility & a strong trend to one side or the other, or if there is more of a weak ranged consolidation period on the cards for us.
The small cap IWM index has shown on average wider range sessions than the other indexes this past year though & will likely continue this trend.
IWM has support at the $190.27 (Volume Sentiment: Buyers, 5:1), $187.67 (Volume Sentiment: Buyers, 3.5:1), $187.27 (volume Sentiment: Buyers, 3.5:1) & $186.19/share (Volume Sentiment: Buyers, 3.5:1) price levels, with resistance at the $196.34 (Volume Sentiment: Buyers, 2:1), $197.10 (Volume Sentiment: Buyers, 2:1), $199.56 (10 Day Moving Average; Volume Sentiment: NULL, 0:0*) & $205.49/share (Volume Sentiment: NULL, 0:0*) price levels.
IWM ETF’s Price Level:Volume Sentiment Over The Past 1-2 Years
IWM ETF’s Price Level:Volume Sentiment Over The Past 1-2 Years
DIA ETF – SPDR Dow Jones Industrial Average ETF’s Technical Performance Over The Past Year
Their RSI is slightly under overbought territory & currently sits at 68.16, after spending most of the prior two months above 70 (overbought).
It is worth noting that a head & shoulders pattern in their RSI developed during that time, signaling that there should be a reversion towards the neutral level in the near-term, particularly after the ascent they took over the past 2 months.
Their MACD is bearish & continuing lower since around the time that they set a new 52-week high at the end of 2023.
Volumes were 55.6% above average this week compared to the year prior (5,449,479 vs. 3,502,129), which is a source of confusion, as it shows investors are still flocking to the larger cap stocks in times of shakeup & 3 of the past 4 sessions were bullish.
However, it is worth noting that the highest volume session of last week was Wednesday’s bearish declining session, which is the second highest volume session of the past 9-10 months.
Their 10 day moving average will also be an area of interest to keep an eye on, as it is now acting as resistance just above Friday’s close.
Last week kicked off on Tuesday with a move up that was supported by the 10 DMA, setting the 52-week high to $337.82/share.
Wednesday saw declines that closed beneath the support of the 10 DMA on the highest volumes of the week.
Thursday resulted in a gravestone doji that opened & closed just beneath the 10 DMA on weak volume, but was an advancing session, indicating that there is extreme uncertainty at these levels.
Friday the indecision continued, with a doji candle that’s real body was also contained by the resistance of the 10 day moving average, which is now curled over & applying more downwards pressure on the share price than it had been earlier in the week.
While Friday’s session had more volume than Thursday’s, it still signals that there is great uncertainty & a lack of confidence in prices at these levels.
12/13’s candle will also be an area to keep an eye on, as the opening level, while not a formal support point, is the gateway to what would be the right hand shoulder should a head & shoulders pattern emerge using the 52-week high as a head.
The $336-340 zone will also be a place to keep an eye on should prices dip that low.
Those are the strongest current buyer dominated zones within -12.5% of the current price & the sellers come out in droves for an additional 4-5% below that, which would pose a challenge to the support of the 52-week low from March of 2023.
Given that this is ~18% below their current price there is time to see how things may go should declines venture that far south, but given the space between the current price & support levels it may come sooner than we think.
DIA has support at the $355.76 (50 Day Moving Average; Volume Sentiment: Buyers, 6:1), $353.53 (Volume Sentiment: Buyers, 6:1), $348.67 (Volume Sentiment: Buyers, 1.27:1) & $342.39/share (Volume Sentiment: Buyers, 2.08:1) price levels, with resistance at the $375.40 (10 Day Moving Average; Volume Sentiment: NULL, 0:0*) & $377.82/share (52-Week High; Volume Sentiment: NULL, 0:0*) price levels.
DIA ETF’s Price Level:Volume Sentiment Over The Past 3-4 Years
DIA ETF’s Price Level:Volume Sentiment Over The Past 3-4 Years
DIA ETF’s Price Level:Volume Sentiment Over The Past 3-4 Years
The Week Ahead
Monday the week kicks off with Consumer Credit data reported at 3pm.
Accolade, Helen of Troy & Jefferies are all scheduled to report earnings on Monday.
Trade Deficit data is scheduled to be released at 8:30 am on Tuesday.
Acuity Brands, Albertsons, AZZ, Neogen, PriceSmart, SMART Global, TD Synnex, Tilray & WD-40 are all scheduled to report earnings on Tuesday.
Wednesday brings us Wholesale Inventories data at 10 am & at 3:15 pm New York Fed President John Williams is scheduled to speak.
KB Home is set to report earnings on Wednesday.
Things heat up on Thursday with Initial Jobless Claims, CPI & Core CPI Year-over-Year data released at 8:30 am, followed by the Budget Statement at 2pm.
Friday the week winds down with PPI & Core PPI Year-over-Year data at 8:30 am.
Delta Airlines, Wells Fargo, Bank of America, BlackRock, BNY Mellon, Citigroup, JPMorgan Chase & United Health are all due to report earnings on Friday.
See you back here next week!
*** I DO NOT OWN SHARES OR OPTIONS CONTRACT POSITIONS IN SPY, QQQ, IWM OR DIA AT THE TIME OF PUBLISHING THIS ARTICLE ***
AMD has fallen -9.96% from their 52-week high in December of 2023, while gaining +126.49% from their 52-week low in January of 2023.
After a great run this past year & a new 52-week high set last week it’s a good time to do a technical breakdown of AMD’s past year’s performance, as well as review their price level:volume sentiment from recent history to gain clues into how market participants may behave around key support & resistance levels again in the future.
As always, this is not intended as investing advice, but rather as an additional resource to use in addition to your existing due diligence process.
Technical Analysis Of AMD Advanced Micro Devices Inc. Stock
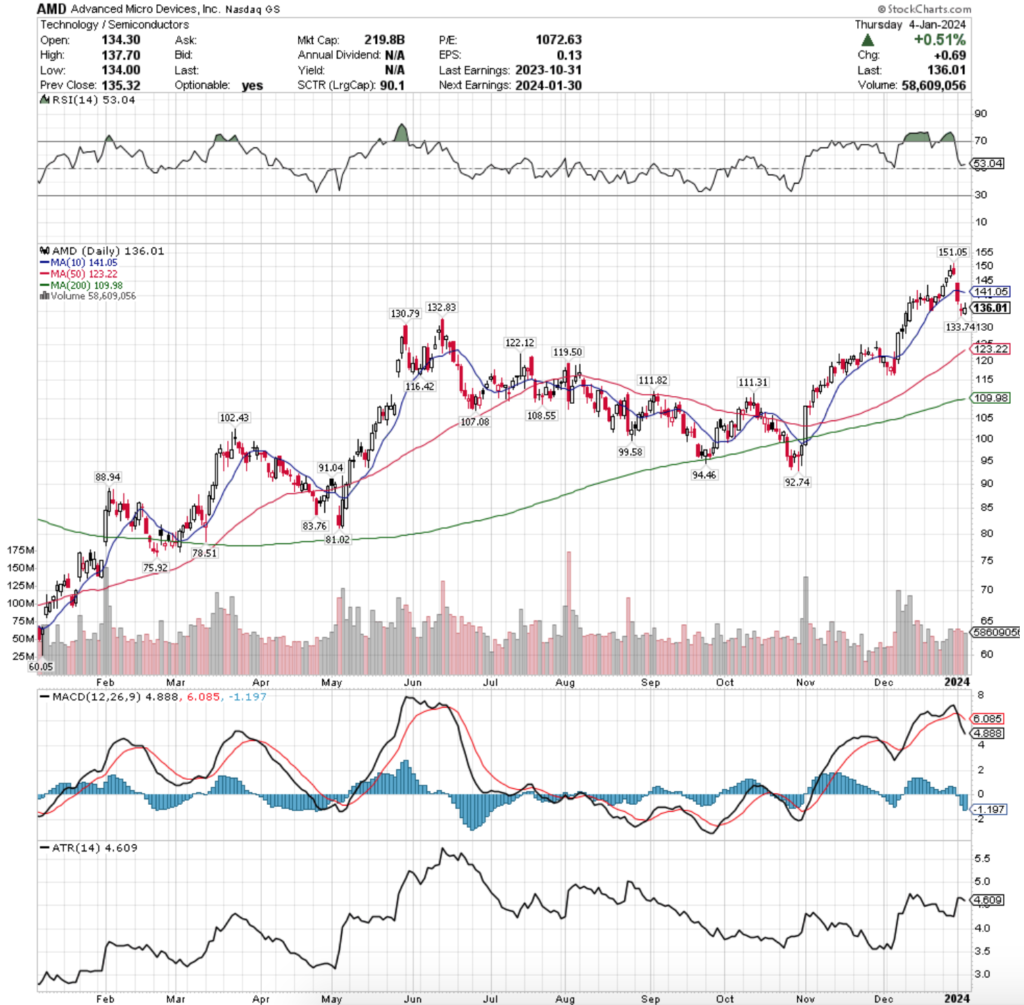
Advanced Micro Devices Inc. AMD Stock’s Technical Performance Over The Past Year
Their RSI has returned to near the neutral level after being at overbought levels for much of December & is currently at 53.04, while their MACD is in steep bearish decline following the declines of 3 of the past 4 sessions.
The volumes of the past week were +0.87% above average compared to the year prior (62,249,360 vs. 61,714,841), indicating that this is still normal profit taking after reaching a new 52-week high at the end of December 2023.
It will be interesting to watch their moving averages in the coming weeks, particularly as the 10 day moving average gave up support on Tuesday & is now curling over bearishly & the 50 DMA is -9.4% below their current share price.
While there are three additional support levels between the current price & 50 DMA, the data for the past 1-2 years does not indicate that there is strength in favor of the buyers or the sellers at the support levels mentioned ($133.74, $132.83 & $130.79/share).
In the lead up to their new 52-week high, last week kicked off with the support of the 10 day moving average forcing AMD’s share price higher, followed Wednesday with a hanging man candle, indicating that sellers were stepping in & there was uncertainty about the price moving much higher.
Thursday nudged higher, but confirmation was given based on the real body of the session’s candle being focused more on the lower end of the day’s trading range, despite the session marking a temporary new 52-week high.
Friday, the last trading session of the year is when the party stopped, as prices advanced slightly & set a new 52-week high, before closing midway down the real body of the session prior’s candle.
Tuesday kicked this week off with a gap down session that opened with support from the 10 day moving average, which quickly faded & prices tested lower & resulted in closing below the 10 DMA, with a small lower shadow indicating that there was more seller pressure to come.
Confirmation arrived Wednesday when prices continued lower & a hint of uncertainty was in the air as the day resulted in a doji candle.
Thursday’s session did not inspire much confidence, opening lower than Wednesday’s close, but closing slightly above it.
Although Thursday tested higher with their upper shadow, the average volume does not indicate conviction in the slight movement higher.
The strength of the $130-133 support zone will be tested to see if prices can consolidate & establish a new range following the -9.96% dip from their 52-week high.
Price Level:Volume Sentiment Analysis For AMD Advanced Micro Devices Inc. Stock
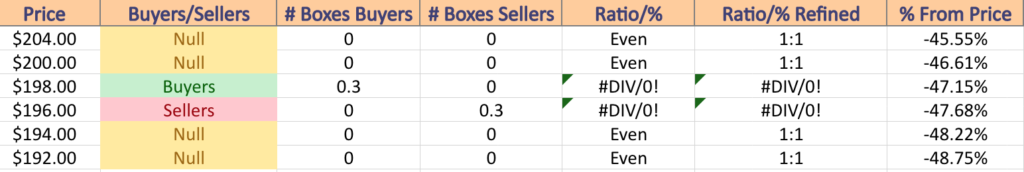
Given that we are near a price extreme (52-week high) it is typical to see some price levels have Buyer:Seller values that are either lacking in data (NULL), or are heavily skewed to one side or the other.
The charts below indicate that there is no clear winner in the battle of buyers & sellers at the $130-133.99/share support zone & that the $126-129.99/share blocks are heavily skewed towards buyers, which makes sense when the number of advancing sessions in those price zones is broken down.
The $124-125.99/share price level should it be tested is historically 1.96:1 Sellers:Buyers, which would walk ADM’s share price down ~-9%, where support picks back up in the $120-123.99/share price levels, which respectively have been Buyer dominated ($122 = 2.75:1, $120 = 2.27:1).
If footing is unable to be found at this zone, the $118-119.99/share block has very weak historical buyers sentiment, which would pave the way into another seller dominated zone.
In the event that this were to happen, the next three support levels are dominated historically by Sellers, 1.66:1 & 1.68:1, before the support of the 200 DMA & the $108.55/share support level look to have historic strength, with Buyers outdoing the sellers 2.4:1.
While this extreme scenario would demonstrate a decline of -19-20%, it would not be out of the question given how much semiconductor stocks advanced over the past year & how crowded they have become.
The charts below will be something for market participants to keep an eye on in the coming months as support/resistance levels are tested.
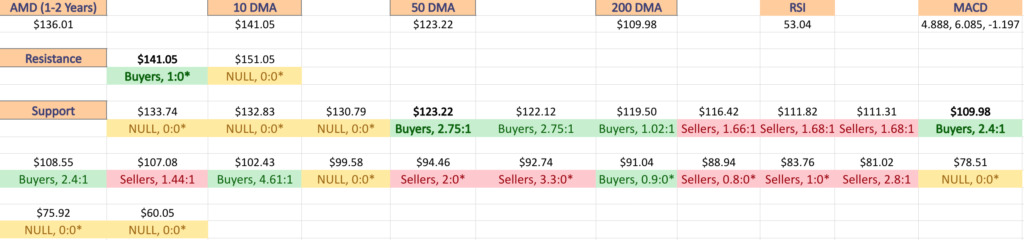
Advanced Micro Devices Inc. AMD Stock’s Price Level:Volume Sentiment Over The Past 1-2 Years At Support & Resistance Levels
Advanced Micro Devices Inc. AMD Stock’s Price Level:Volume Sentiment Over The Past 1-2 Years
Advanced Micro Devices Inc. AMD Stock’s Price Level:Volume Sentiment Over The Past 1-2 Years
Advanced Micro Devices Inc. AMD Stock’s Price Level:Volume Sentiment Over The Past 1-2 Years
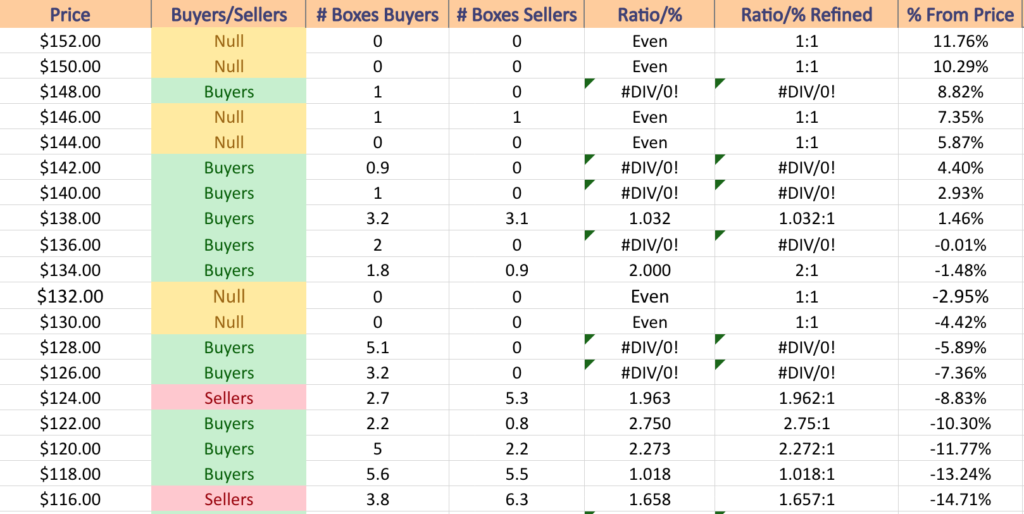
$152 – NULL – 0:0*; +11.28% From Current Price Level
$150 – NULL – 0:0*; +9.82% From Current Price Level
$148 – Buyers – 1:0*; +8.35% From Current Price Level
$146 – Even – 1:1; +6.89% From Current Price Level
$144 – NULL – 0:0*; +5.42% From Current Price Level
$142 – Buyers – 0.9:0*; +3.96% From Current Price Level
$140 – Buyers – 1:0*; +2.5% From Current Price Level – 10 Day Moving Average*
$138 – Buyers – 1.03:1; +1.03% From Current Price Level
$136 – Buyers – 2:0*; -0.43% From Current Price Level – Current Price Box*
$134 – Buyers – 2:1; -1.9% From Current Price Level
$132 – NULL – 0:0*; -3.36% From Current Price Level
$130 – NULL – 0:0*; -4.82% From Current Price Level
$128 – Buyers – 5.1:0*; -6.29% From Current Price Level
$126 – Buyers – 3.2:0*; -7.75% From Current Price Level
$124 – Sellers – 1.96:1; -9.92% From Current Price Level
$122 – Buyers – 2.75:1; -10.68% From Current Price Level – 50 Day Moving Average*
$120 – Buyers – 2.27:1; -12.15% From Current Price Level
$118 – Buyers – 1.02:1; -13.61% From Current Price Level
$116 – Sellers – 1.66:1; -15.07% From Current Price Level
$114 – Buyers – 6.3:0*; -16.54% From Current Price Level
$112 – Buyers – 1.44:1; -18% From Current Price Level
$110 – Sellers – 1.68:1; -19.47% From Current Price Level
$108 – Buyers – 2.4:1; -20.93% From Current Price Level – 200 Day Moving Average*
$106 – Sellers – 1.44:1; -22.4% From Current Price Level
$104 – Sellers – 2.64:1; -23.86% From Current Price Level
$102 – Buyer s- 4.61:1; -25.32% From Current Price Level
$100 – Sellers – 1.88:1; -26.79% From Current Price Level
$99 – NULL – 0:0*; -27.52% From Current Price Level
$98 – Buyers – 3.2:0*; -28.25% From Current Price Level
$97 – Buyers – 9:1; -28.98% From Current Price Level
$96 – Sellers – 1.24:1; -29.72% From Current Price Level
$95 – Even – 1:1; -30.45% From Current Price Level
$94 – Sellers – 2:0*; -31.18% From Current Price Level
$93 – Sellers – 1:0*; -31.91% From Current Price Level
$92 – Sellers – 3.3:0*; -32.65% From Current Price Level
$91 – Sellers – 0.8:0*; -33.38% From Current Price Level
$90 – Buyers – 0.9:0*; -34.11% From Current Price Level
$89 – Buyers – 4.47:1; -34.84% From Current Price Level
$88 – Sellers – 0.8:0*; -35.57% From Current Price Level
$87 – Buyers – 2.5:1; -36.31% From Current Price Level
$86 – Buyers 2:0*; -37.04% From Current Price Level
$85 – Buyers – 2:0*; -37.77% From Current Price Level
$84 – Sellers – 1.2:0*; -38.5% From Current Price Level
$83 – Sellers – 1:0*; -39.32% From Current Price Level
$82 – Sellers – 2:1; -39.97% From Current Price Level
$81 – Sellers – 2.8:1; -40.7% From Current Price Level
$80 – NULL – 0:0*; -41.43% From Current Price Level
$79 – NULL – 0:0*; -42.16% From Current Price Level
$78 – NULL – 0:0*; -42.89% From Current Price Level
$77 – NULL – 0:0*; -43.63% From Current Price Level
*** I DO NOT OWN SHARES OR OPTIONS CONTRACT POSITIONS IN AMD STOCK AT THE TIME OF PUBLISHING THIS ARTICLE ***
UCO, the ProShares Ultra Bloomberg Crude Oil ETF has declined -9.85% over the past year, falling -31.2% from its 52-week high in September of 2023, while advancing +23.1% from its 52-week low in March of 2023 (using 1/2/2024’s closing price data).
After a volatile week last week, it is worth taking a look at how their shares have traded at different price levels in terms of volume from recent history.
This is particularly important at a time such as now, when prices are stuck between a support zone created by the price consolidation of mid 2023 & the downward resistance pressure of their 10, 50 & 200 day moving averages.
Below is a brief technical analysis of UCO’s recent performance, as well as a review of Buyer:Seller volume at each price level that they’ve traded at over the past 2-3 years.
It is not intended as investment advice, but rather as an additional tool that can be looked at in addition to your normal due diligence process to assess the strength (or weakness) of support & resistance levels.
Technical Analysis Of UCO, The ProShares Ultra Bloomberg Crude Oil ETF
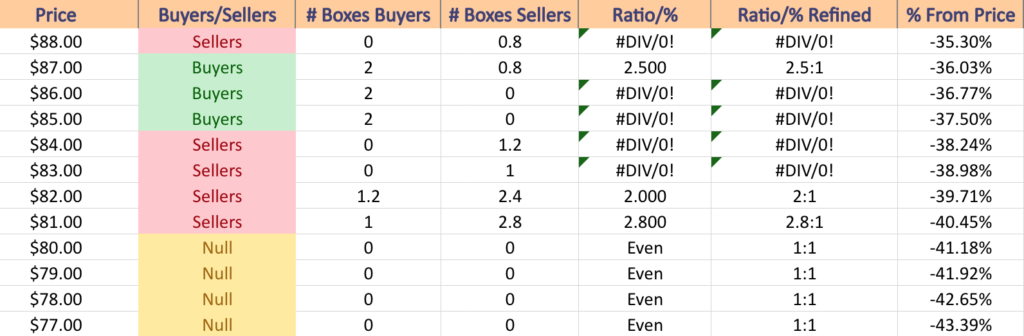
UCO ETF – ProShares Ultra Bloomberg Crude Oil ETF’s Technical Performance Over The Past Year
Their RSI is currently trending back towards neutral & sits at 45.75, while their MACD has recently flattened after being in bearish decline following the declines of the past week.
Volumes last week were +44.34% above average compared to the year prior (4,165,920 vs. 2,886,132.67) as market participants were eager to sell their shares of UCO.
Last week kicked off with a shooting star candlestick on Tuesday 12/26/2023, which was right in between the 50 & 200 day moving averages, setting the stage for the declines of the rest of the week.
The next day opened just below Tuesday’s close, tested higher but ultimately declined through the support of the 200 day moving average on light volume, which could be attributed to people taking time off for the holiday, or it could show indecision about the strength of the 200 DMA.
Thursday brought the sellers out in full force, with the session opening below the 10 day moving average, temporarily rising above its resistance, but ultimately falling back down & the day declined ~-5% from Wednesday’s close.
Friday the risk off sentiment continued, with the session opening above the day prior’s close, but ultimately it was risk-off sentiment going into the weekend & sellers forced the price lower.
This week kicked off on Tuesday with UCO opening near Friday’s opening price, but the sellers came back out in full force & drove the price down -2.18% on the day.
Their lows have been increasing since mid-December, but their moving averages are currently painting a bearish picture for the near-term, with the current price being below the 10, 50 & 200 day moving averages, all of which are moving bearishly.
The 50 DMA is set to make a death cross with the 200 DMA in the coming days which is also something that investors & traders will need to keep an eye on.
There are many support touch-points in the $25-26/share zone, as well as the $24-25/share zone which will be where all eyes focus in the event of further near-term declines.
The price level:volume sentiment analysis below can be used as an additional tool to identify the strength (or weakness) of support & resistance levels that UCO has traded at over the past 2-3 years.
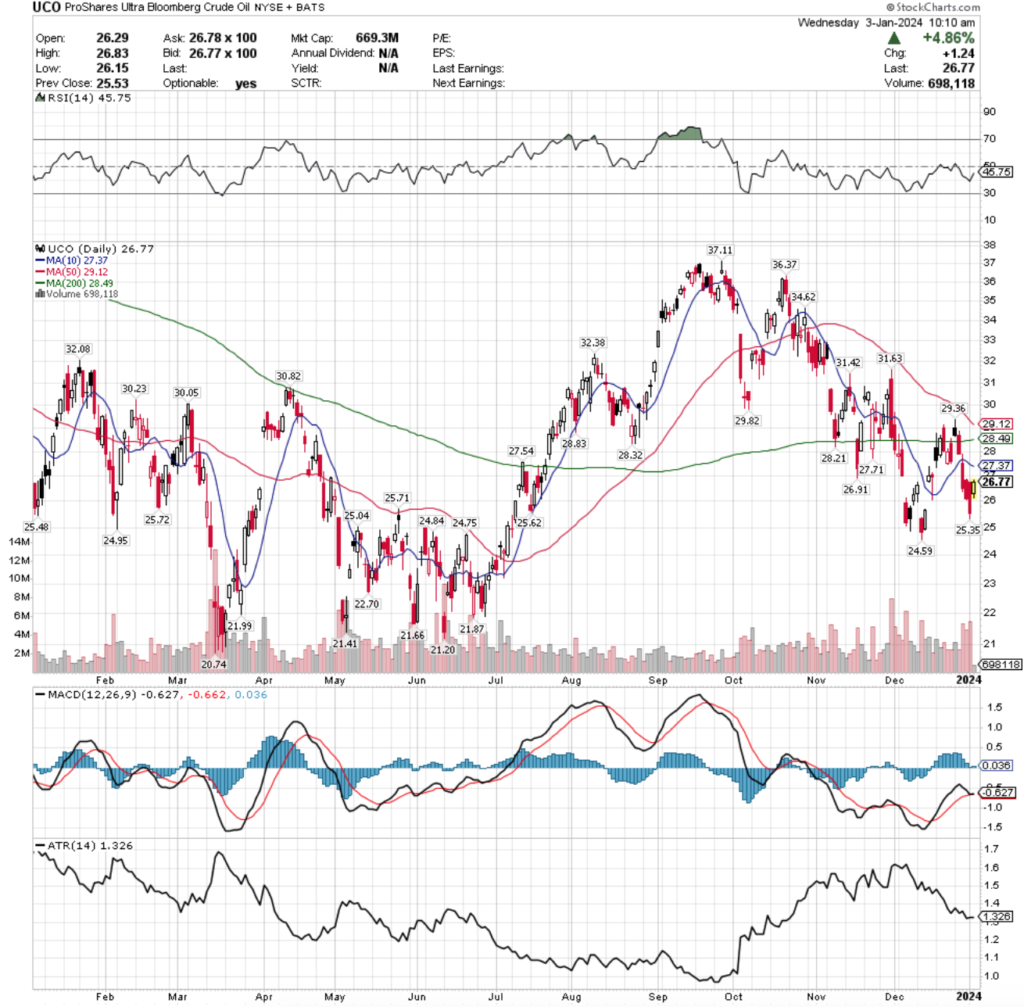
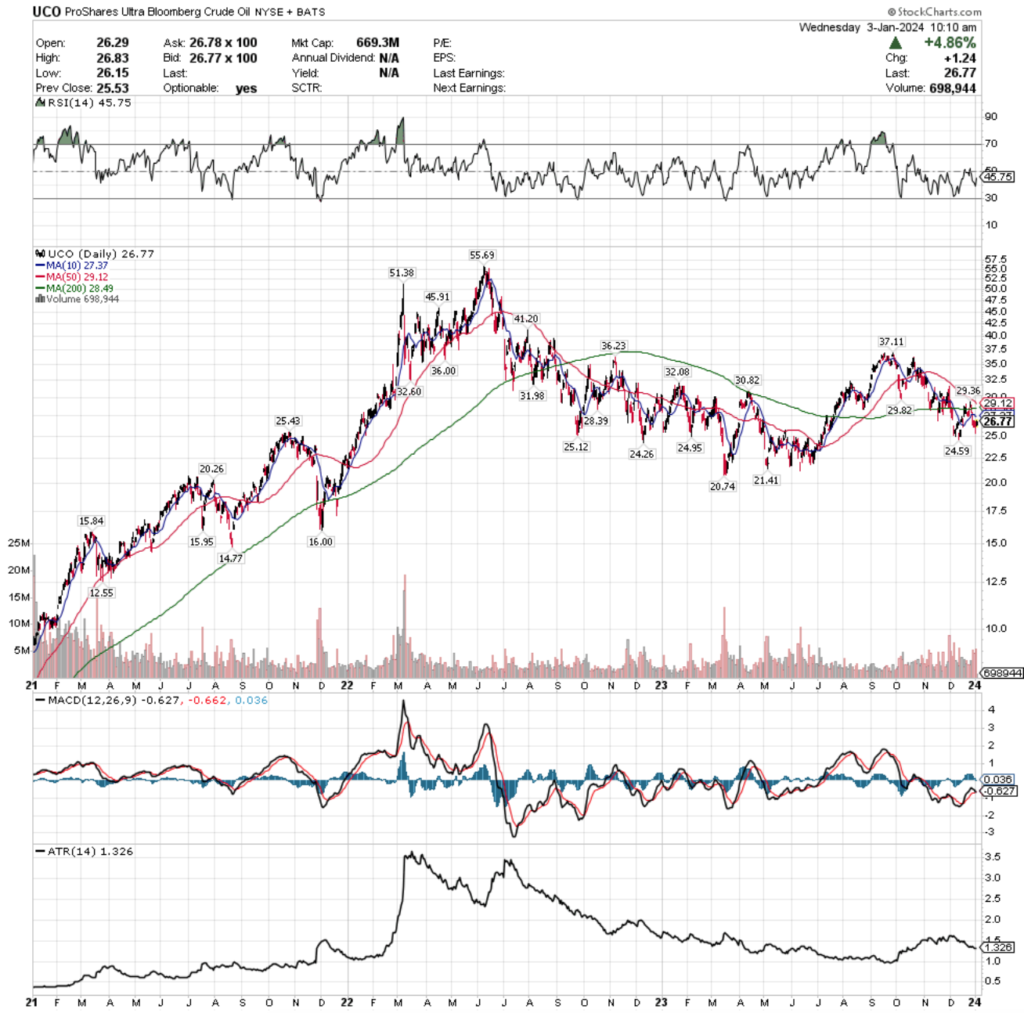
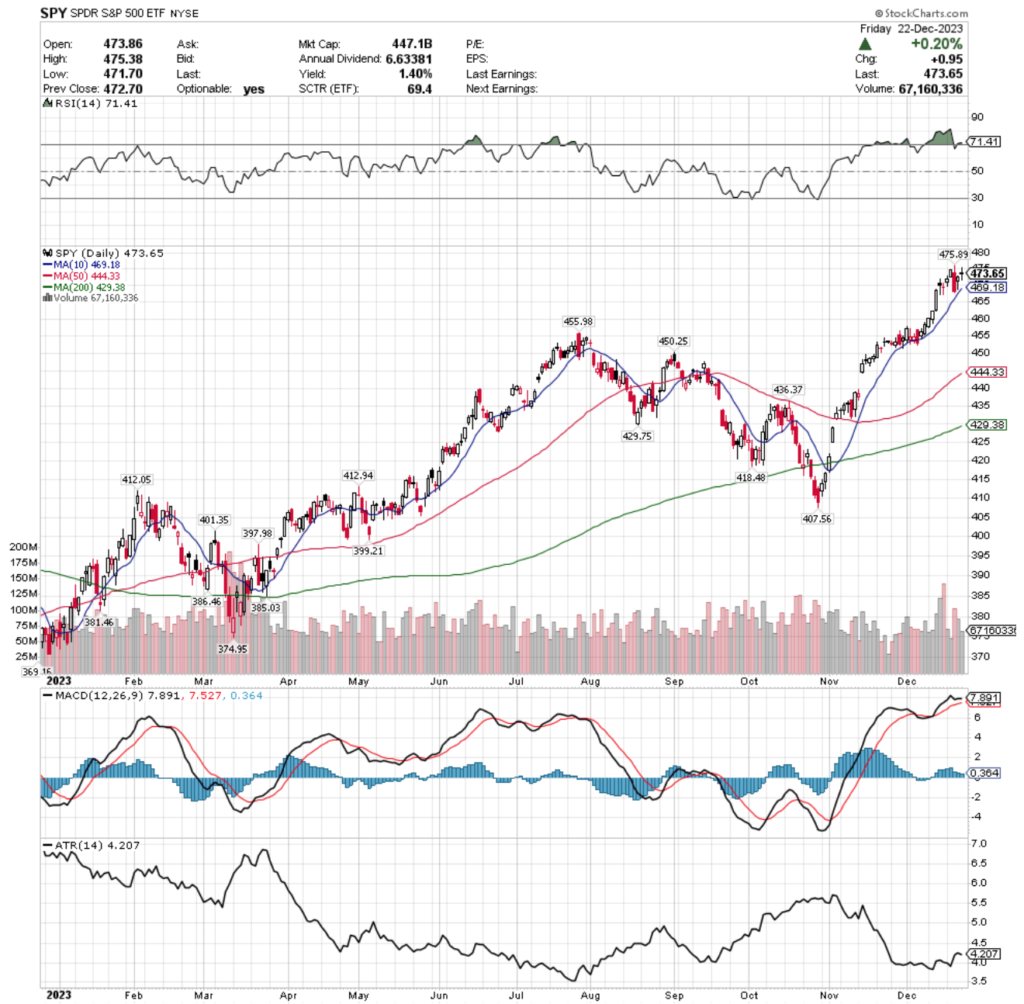
Given that the volume data goes back that far, the chart below is also included, covering the technical performance of UCO for the past 3 years.
UCO ETF – ProShares Ultra Bloomberg Crude Oil ETF’s Technical Performance Over The Past 3 Years
Price Level:Volume Sentiment Analysis For UCO, The ProShares Ultra Bloomberg Crude Oil ETF
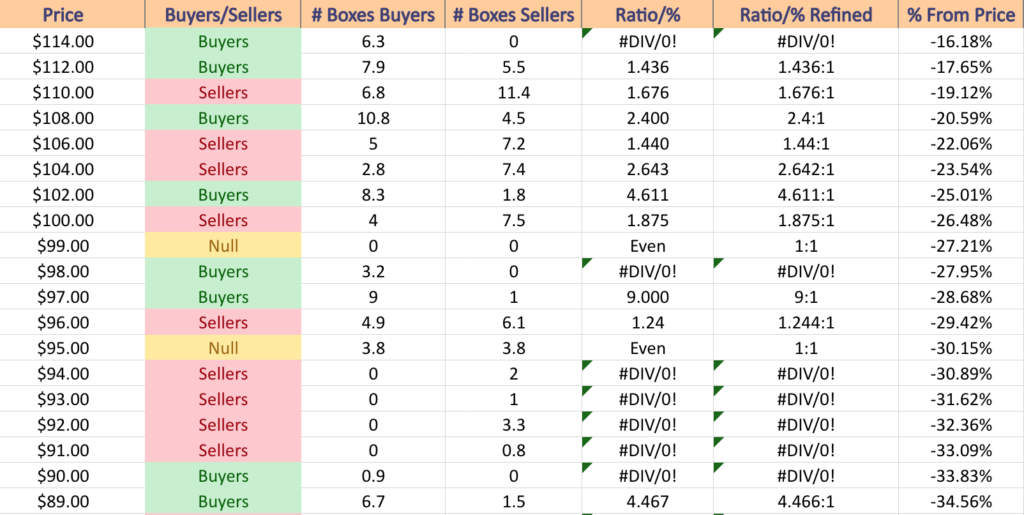
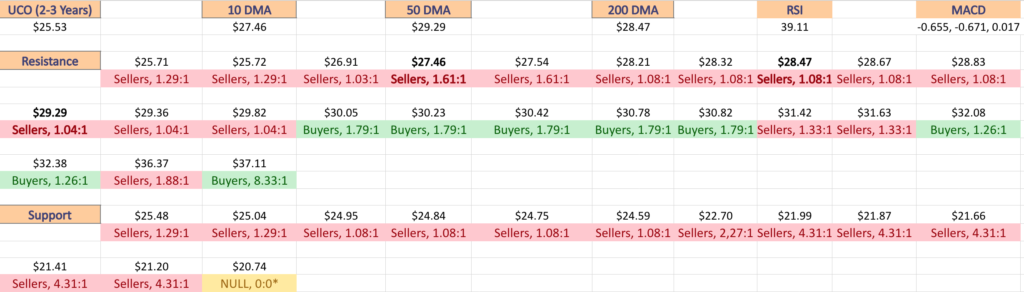
The first chart below shows the current 1-year support & resistance levels for UCO, as well as the price level:volume sentiment for each touch-point.
The ratio of buyers:sellers can be used in addition to your other due diligence tools to assess the strength or weakness of the support/resistance levels based on previous investor behavior at these levels.
This is not investment advice & is only meant to serve as an additional perspective to consider when looking at price charts.
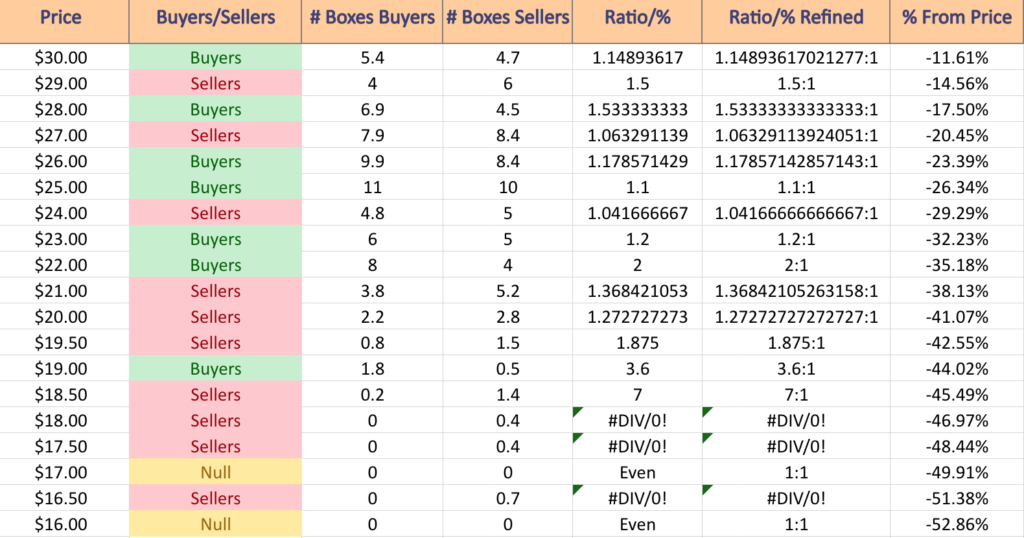
While most of the support levels seen below are dominated by sellers, the $24-25 price level historically has seen 1.08:1 Sellers:Buyers, which may indicate that there will be stronger support there than at the $25-26/share level (Sellers, 1.29:1) or the $21-22/share (Sellers, 4.31:1) price levels.
Another important consideration to take when reading the information below is that at price extremes there will tend to be more of a skew to one side or the other.
This is in part due to the extreme levels inciting more volatile, higher volume trading, and the appearance of gaps up or down from the extreme price levels when market participants finally run out of steam.
Price Level:Volume Sentiment Analysis For UCO ETF, The ProShares Ultra Bloomberg Crude Oil ETF With Support & Resistance Levels Over The Past 2-3 Years
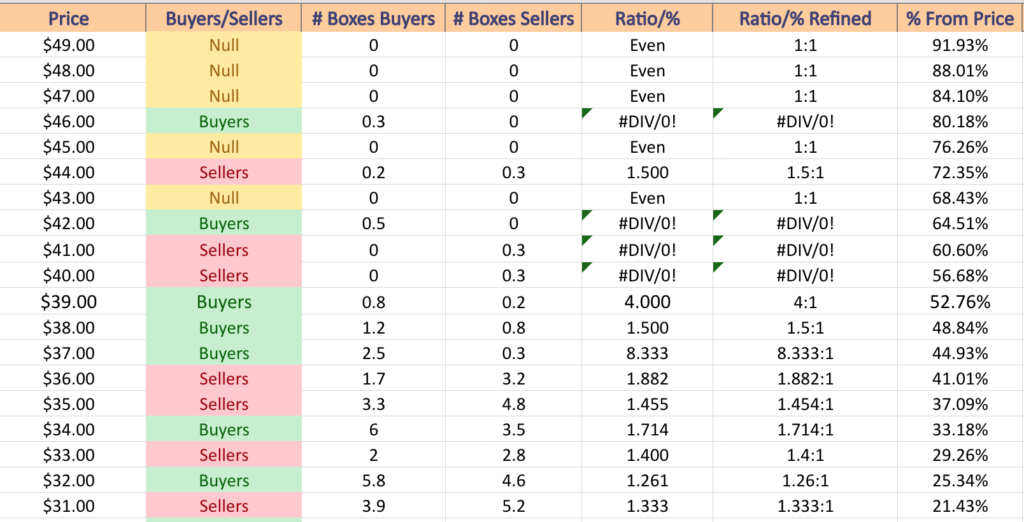
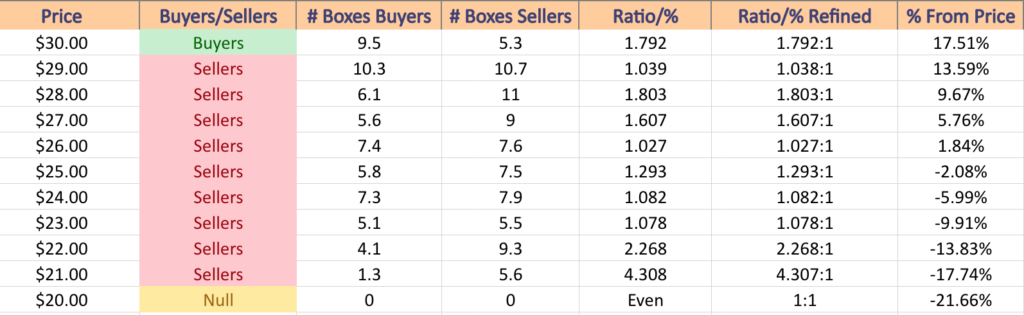
Price Level:Volume Sentiment Analysis For UCO ETF, The ProShares Ultra Bloomberg Crude Oil ETF Over The Past 2-3 Years
Price Level:Volume Sentiment Analysis For UCO ETF, The ProShares Ultra Bloomberg Crude Oil ETF Over The Past 2-3 Years
$49 – NULL – 0:0*; +91.93% From Current Price Level
$48 – NULL – 0:0*; +88.01% From Current Price Level
$47 – NULL – 0:0*; +84.1% From Current Price Level
$46 – Buyers – 0.3:0*; +80.18% From Current Price Level
$45 – NULL – 0:0*; +76.26% From Current Price Level
$44 – Sellers – 1.5:1; +72.35% From Current Price Level
$43 – NULL – 0:0*; +68.43% From Current Price Level
$42 – Buyers – 0.5:0*; +64.51% From Current Price Level
$41 – Sellers – 0.3:0*; +60.6% From Current Price Level
$40 – Sellers – 0.3:0*; +56.68% From Current Price Level
$39 – Buyers – 4:1; +52.76% From Current Price Level
$38 – Buyers – 1.5:1; +48.48% From Current Price Level
$37 – Buyers – 8.33:1; +44.93% From Current Price Level
$36 – Sellers – 1.88:1; +41.01% From Current Price Level
$35 – Sellers – 1.45:1; +37.09% From Current Price Level
$34 – Buyers – 1.71:1; +33.18% From Current Price Level
$33 – Sellers – 1.4:1; +29.26% From Current Price Level
$32 – Buyers – 1.26:1; +25.43% From Current Price Level
$31 – Sellers – 1.33:1; +21.43% From Current Price Level
$30 – Buyers – 1.79:1; +17.51% From Current Price Level
$29 – Sellers -1.04:1; +13.59% From Current Price Level – 50 Day Moving Average*
$28 – Sellers – 1.8:1; +9.67% From Current Price Level – 200 Day Moving Average*
$27 – Sellers – 1.61:1; +5.76% From Current Price Level – 10 Day Moving Average
$26 – Sellers – 1.03:1; +1.84% From Current Price Level
$25 – Sellers – 1.29:1; -2.08% From Current Price Level – Current Price Block*
$24 – Sellers – 1.08:1; -5.99% From Current Price Level
$23 – Sellers – 1.08:1; -9.91% From Current Price Level
$22 – Sellers – 2.27:1; -13.83% From Current Price Level
$21 – Sellers – 4.31:1; -17.74% From Current Price Level
$20 – NULL – 0:0*; -21.66% From Current Price Level
*** I DO NOT OWN SHARES OR OPTIONS CONTRACT POSITIONS IN UCO ETF AT THE TIME OF PUBLISHING THIS ARTICLE ***
Market indexes have found themselves hovering near new 52-week highs over the past week as we head into the year’s end; Santa delivered this Christmas season!
As it is the end of the year & we are at new price extremes on the upside, it is worth taking time to review how these buyers & sellers have behaved at different price levels for each of the indexes.
The article below outlines a brief technical analysis of recent performance for SPY, QQQ, IWM & DIA, as well as a price level:volume sentiment analysis for each index covering the past 1-2 years worth of data (3-4 years for DIA).
As always, this is not meant to serve as investing advice, but rather as a barometer to use as an additional tool when doing your own due diligence.
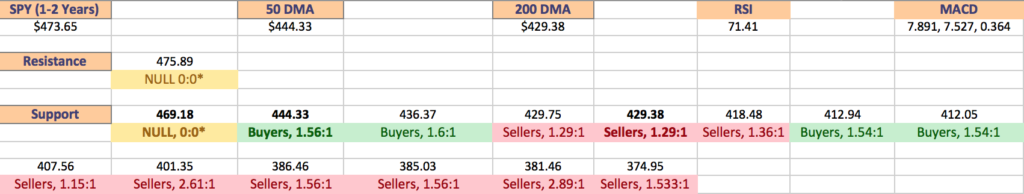
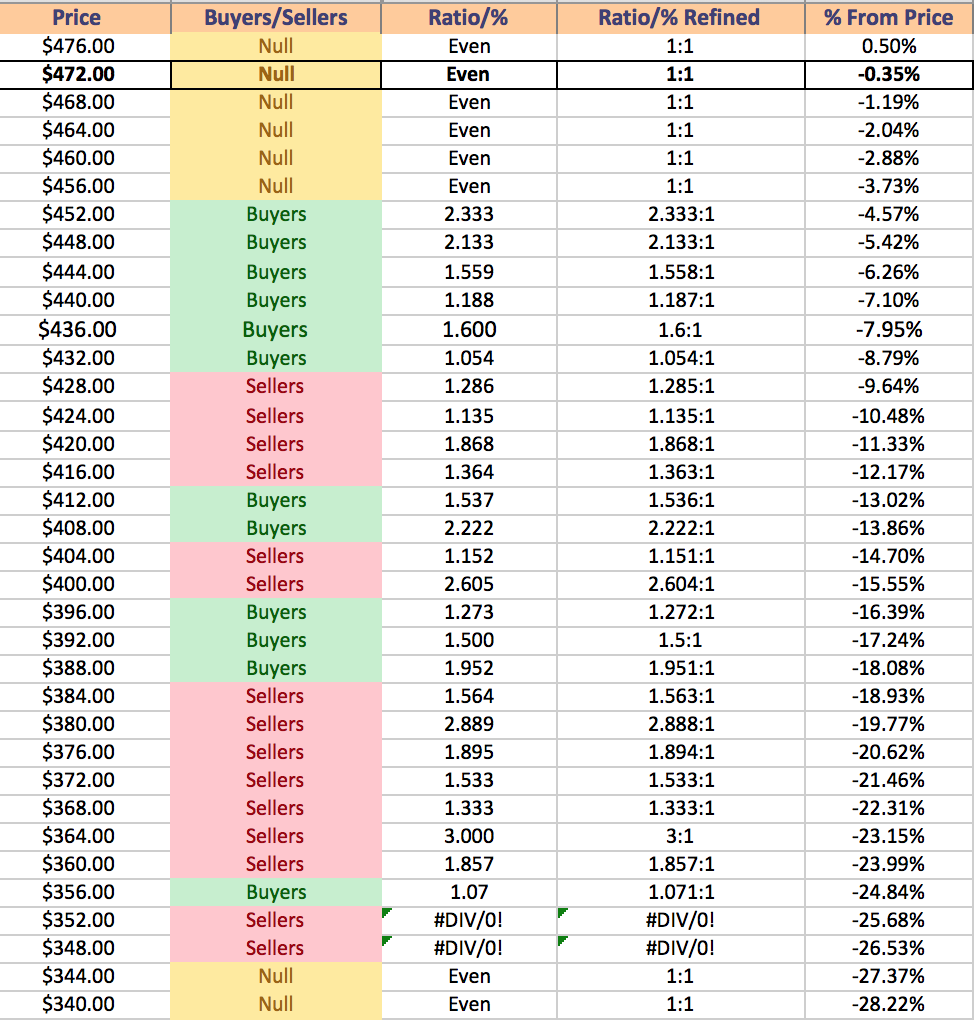
When reading the price level:volume sentiment portions below note that the top images show the price level:volume sentiment at the past year’s support & resistance levels for each index, the bottom image shows the individual price levels & their relationship to the current price level, and the lists below them include the same data as the second image where all of the support & resistance levels are marked in bold.
Technical Analysis Of SPY, The SPDR S&P 500 ETF
SPY, the SPDR S&P 500 ETF gained +0.92% last week, staying relatively range-bound just above the support of the ascending 10 day moving average.
SPY ETF – The SPDR S&P 500 ETF’s Technical Performance Over The Past Year
Their RSI is currently overbought at 71.41, while their MACD is bullish, but moving relatively flat, which tends to signal a bearish crossover & a consolidation period are on the horizon.
Volumes were -6.31% below average last week compared to the year prior (76,570,440 vs. 81,726,945), indicating a lack of confidence near new 52-week highs, as well as traders taking vacations ahead of the Christmas holiday.
Monday kicked the week off on a note of uncertainty with a spinning top candlestick that closed just above Friday’s upper shadow, with upper & lower shadows being roughly the same size.
Tuesday opened higher & climbed steadily towards the $475 price level, but fell short at $474.92 for the day’s high, while closing just below it for the day at $474.84/share.
A new 52-week high was established Wednesday at $475.89/share after the day’s session opened at the midway point of Tuesday’s candle, but profits were eagerly taken & the day closed lower, but remained above the 10 DMA (even its lower shadow) as a sign of support.
Thursday hinted at more skittishness among market participants with a hanging man candle that tested lower, but did not dip lower than the day prior’s close as the 10 DMA maintained support & forced the session to close higher (although only 75-80% of the day prior’s candle), although a bearish harami pattern was formed after the close with Wednesday’s candle.
The week ended as uncertain as it began from a technical perspective, with Friday closing in a doji whose upper shadow did not get as high as Wednesday’s candle’s & whose lower shadow covered most of the prior day’s candle’s real body.
Their Average True Range does not reflect a strong trend & has been showing weakening as the week progressed, which when paired with the uncertainty of the candles does seem to signal that we are nearing a cooldown period.
The strongest volume session of the week was Wednesday, which was a declining session & the bullish sessions except for Thursday’s all had volumes that were <75% of Wednesday’s declining volumes, signaling a lack of enthusiasm for more risk in the near-term.
There is an emerging bearish head & shoulders pattern which will be something to keep an eye on as we enter the new year, particularly if there is a consolidation around the $450-460/share price range, where the 50 DMA will be a support level to keep an eye on, as well as the $455.98 & $450.25/share price levels.
Price Level:Volume Sentiment Analysis For SPY, The SPDR S&P 500 ETF
SPY’s reaching new 52-week highs has created an interesting area in terms of volume analysis, as there is limited data in terms of the strength of buyers:sellers currently until a -3.73% decline has taken place, bringing prices down to $456/share.
This will be particularly interesting as their 2nd highest support level is currently at $455.98/share & this would likely trigger the support that would lay the groundwork for the bearish head & shoulders pattern mentioned above.
Again, due to the limited data as these price levels are higher than usual the support zone that is depicted below between the -3.73%-8.79% block will get fuzzy, as the strongest volume sentiments lie above the -5.42% range from the current price in the image below.
Should support break down in the other buyer dominated ranges their price will enter a seller dominated zone that dips down to -12.17% from their current price to $416/share.
There are support points in the $412-413 price range which has been 1.54 Buyers:1 Seller over the past 1-2 years, but this could pave the way to test the $407.56/share support level, which if broken would likely bring a test of the $400/share price level, given that the sellers get more aggressive in the $400-403.99/share range, which comes after a seller dominated zone already.
The chart below outlines the price level:volume sentiment for the major support & resistance areas of the past year, followed by the list of each price level’s volume sentiment.
SPY ETF’s Price Level:Volume Sentiment Analysis Over The Past 1-2 Years With Support & Resistance Levels
SPY ETF’s Price Level:Volume Sentiment Analysis For The Past 1-2 Years
$476 – NULL – 0:0*; +0.5% From Current Price Level
$472 – NULL – 0:0*; -0.35% From Current Price Level – Current Price Box*
$468 – NULL – 0:0*; -1.19% From Current Price Level – 10 Day Moving Average*
$464 – NULL – 0:0*; -2.04% From Current Price Level
$460 – NULL – 0:0*; -2.88% From Current Price Level
$456 – NULL – 0:0*; -3.73% From Current Price Level
$452 – Buyers – 2.33:1; -4.57% From Current Price Level
$448 – Buyers – 2.133:1; -5.42% From Current Price Level
$444 – Buyers – 1.56:1; -6.26% From Current Price Level – 50 Day Moving Average*
$440 – Buyers – 1.19:1; -7.1% From Current Price Level
$436 – Buyers – 1.6:1; -7.95% From Current Price Level
$432 – Buyers – 1.05:1; -8.79% From Current Price Level
$428 – Sellers – 1.29:1; -9.64% From Current Price Level
$424 – Sellers – 1.14:1; -10.48% From Current Price Level
$420 – Sellers – 1.87:1; -11.33% From Current Price Level
$416 – Sellers – 1.36:1; -12.17% From Current Price Level
$412 – Buyers – 1.54:1; -13.02% From Current Price Level
$408 – Buyers – 2.22:1; -13.86% From Current Price Level
$404 – Sellers – 1.15:1; -14.7% From Current Price Level
$400 – Sellers – 2.06:1; -15.55% From Current Price Level
$396 – Buyers – 1.27:1; -16.39% From Current Price Level
$392 – Buyers – 1.5:1; -17.24% From Current Price Level
$388 – Buyers – 1.95:1; -18.08% From Current Price Level
$384 – Sellers – 1.56:1; -18.93% From Current Price Level
$380 – Sellers – 2.89:1; -19.77% From Current Price Level
$376 – Seller s- 1.89:1; -20.62% From Current Price Level
$372 – Sellers – 1.53:1; -21.46% From Current Price Level
$368 – Sellers – 1.33:1; -22.31% From Current Price Level
$364 – Sellers – 3:1; -23.15% From Current Price Level
$360 – Sellers – 1.86:1; -23.99% From Current Price Level
$356 – Buyers – 1.07:1; -24.84% From Current Price Level
$352 – Sellers – 2:0*; -25.68% From Current Price Level
$348 – Sellers – 3:0*; -26.53% From Current Price Level
$344 – NULL – 0:0*; -27.37% From Current Price Level
$340 – NULL – 0:0*; -28.22% From Current Price Level
Technical Analysis Of QQQ, The Invesco QQQ Trust ETF (NASDAQ)
QQQ ETF – Invesco QQQ Trust ETF’s Technical Performance Over The Past Year
Their RSI is currently overbought at 70.96, while their MACD is bullish, but flattening out, which tends to signal that there will be a consolidation period in the near-term.
Volumes were -17.72% below average last week compared to the year prior (43,245,120 vs. 52,559,460), which signals a severe lack of confidence at these 52-week high price levels, particularly as the highest volume session came on Wednesday’s declining session.
Monday kicked off slightly higher than Friday’s close, with a slight upper shadow indicating that they may nudge higher on Tuesday, which occurred but on only ~80% of Monday’s volumes, signaling that not many more people were eager to jump into the pool.
This was confirmed on Wednesday where the week’s highest volume session occurred, opening near the open of Tuesday’s session, pushing higher to establish the new 52-week high level at $410.47, which then resulted in the rug being pulled out from under the session & declines that closed near the close of the prior Thursday’s session (below all other sessions in between & their shadows).
Conflicting energies were in the air on Thursday, as a dragonfly doji candle showed uncertainty, but a potential for a kick upward, while also forming a bearish harami pattern with the day prior.
While Thursday’s session had volume that was ~85% of Wednesday’s session, that still signals a yellow light.
Friday continued on the skating on thin ice theme, with a spinning top candle whose upper shadow did not break near the 52-week high set Wednesday & whose lower shadow dipped below the open of the day prior’s candle, sending the 10 day moving average into a flattening process, preparing it to curl over bearishly in the near-term & signaling the strength of support is weakening.
Due to Friday’s volumes being lowest of the week it also indicates that there was limited interest in carrying new risk into the holiday weekend.
Their Average True Range also has been signaling a weakening trend over the past week, which does not bode well for the near-term.
Market participants should have their eyes peeled for a bearish head & shoulders formation, particularly if the $390/share price level becomes tested in a consolidation, as the 50 DMA will become the nearest support level by that point in the event of decline.
Price Level:Volume Sentiment Analysis For QQQ, The Invesco QQQ Trust ETF
Much like SPY, QQQ sits in a similar position near its 52-week high & has limited buyer:seller data near these price levels for the past 1-2 years.
After a -5% decline there is a window of buyer dominated prices, but minus the sturdy 4:1 Buyers:Sellers price zone of $380-383.99/share things begin to get a bit muddier.
This would enter the consolidation range that would become the right shoulder mentioned prior.
If prices are walked down to the $341.67 support level (which we may well be based on the volume sentiments below & the current positioning of QQQ’s moving averages), then there is no support until $311.69/share.
There is one price zone in between those levels (similar to SPY above) that has standout Buyer:Seller levels over the last 1-2 years, the $324-327.99/share price zone.
Should this not hold up there are strong chances that the $307.31/share support level is tested, which may lead to a test of the $300/share level based on the Seller:Buyer volume of that price level.
While this would be a medium-term price movement most likely, it will be something worth keeping an eye on along the way down.
QQQ ETF’s Price Level:Volume Sentiment Analysis Over The Past 1-2 Years With Support & Resistance Levels
QQQ ETF’s Price Level:Volume Sentiment Analysis Over The Past 1-2 Years
QQQ ETF’s Price Level:Volume Sentiment Analysis Over The Past 1-2 Years
$412 – NULL – 0:0*; +0.89% From Current Price Level
$408 – NULL – 0:0*; -0.09% From Current Price Level – Current Price Box*
$404 – NULL – 0:0*; -1.07% From Current Price Level
$400 – NULL – 0:0*; -2.05% From Current Price Level – 10 Day Moving Average*
$396 – NULL – 0:0*; -3.03% From Current Price Level
$392 – NULL – 0:0*; -4.01% From Current Price Level
$388 – NULL – 0:0*; -4.99% From Current Price Level
$384 – Buyer s- 1.55:1; -5.97% From Current Price Level
$380 – Buyers – 4:1; -6.95% From Current Price Level
$376 – Buyers – 1.21:1; -7.93% From Current Price Level – 50 Day Moving Average
$372 – Sellers – 1.03:1; -8.91% From Current Price Level
$368 – Buyers – 1.1:1; -9.89% From Current Price Level
$364 – Buyers – 1.4:1; -10.87% From Current Price Level
$360 – Buyers – 1.82:1; -11.85% From Current Price Level
$356 – Sellers – 1.16:1; -12.83% From Current Price Level
$352 – Buyers – 1.40:1; -13.81% From Current Price Level – 200 Day Moving Average
$348 – Even – 1:1; -14.79% From Current Price Level
$344 – Sellers – 1.06:1; -15.76% From Current Price Level
$340 – Buyers – 1.92:1; -16.74% From Current Price Level
$336 – Sellers – 2.4:1; -17.72% From Current Price Level
$332 – Even – 1:1; -18.7% From Current Price Level
$328 – Sellers – 1.36:1; -19.68% From Current Price Level
$324 – Buyers – 2.24:1; -20.66% From Current Price Level
$320 – Buyers – 1.37:1; -21.64% From Current Price Level
$316 – Sellers – 1.46:1; -22.62 From Current Price Level
$312 – Sellers – 1.8:1; -23.6% From Current Price Level
$308 – Sellers – 1.15:1; -24.58% From Current Price Level
$304 – Buyers – 1.18:1; -25.56% From Current Price Level
$300 – Sellers – 1.62:1; 26.54% From Current Price Level
$296 – Buyers – 1.85:1; -27.52% From Current Price Level
$292 – Buyers – 1.64:1; -28.5% From Current Price Level
$288 – Sellers – 1.26:1; -29.48% From Current Price Level
$284 – Sellers – 2.22:1; -30.46% From Current Price Level
$280 – Buyers – 1.15:1; -31.44% From Current Price Level
$276 – Buyers – 1.06:1; -32.42% From Current Price Level
$272 – Sellers – 1.21:1; -33.4% From Current Price Level
$268 – Sellers – 1.61:1; -34.37% From Current Price Level
$264 – Buyers – 1.15:1; -35.35% From Current Price Level
$260 – Sellers – 3.6:1; -36.33% From Current Price Level
$256 – Sellers – 2.7:0*; -37.31% From Current Price Level
Technical Analysis Of IWM, The iShares Russell 2000 ETF
IWM ETF – The iShares Russell 2000 ETF’s Technical Performance Over The Past Year
Their RSI is also currently overbought at 73.18, while their MACD is still bullish, but beginning to stretch out as if it is exhausting & preparing to roll over bearishly following a month & a half long advance.
Volumes were +50.54% above average last week compared tot he year prior (47,347,420 vs. 31,451,786), which is the aftershock of last week’s massive price jumps & high volume sessions of Wednesday & Thursday, as well as last Friday’s heavy volume profit taking day that followed.
Monday established a bearish harami that set up the squeeze that brought about the end of the week’s new 52-week high, as the day’s candle opened higher than Friday’s but closed lower for the session, with an upper shadow that tested near Friday’s open.
Tuesday’s session featured a wide-range real body higher, with slight upper & lower shadows on the second highest volume of the week, indicating that there was risk appetite, but that it was relatively confined to the open & closing prices & in between, not much higher or lower.
Wednesday set a new 52-week high for the time being before retreating like the other indexes into a day of steep declines on high volumes (highest of the week) as investors were eager to secure profits & take them off of the table.
Thursday completed a bearish harami pattern that tested much lower than it closed based on the lower shadow of the day’s candle, which broke below the $198/share price level on low volume.
Friday sent conflicting signals & clouds of uncertainty, with a gap up session whose lower shadow did not touch the $200/share price level, but whose real body was concentrated in the lower 50% of the day’s range, despite establishing a new 52-week high.
The low volume of the session also indicated that there was limited interest in carrying risk into the long weekend.
IWM’s Average True Range also has been declining, signaling that there is a weakening in the trend.
There is a support zone between the 10 DMA, $197.10 & $196.34/share price range which will be an area to keep an eye on in the coming days-to-weeks, particularly as their 50 & 200 day moving averages are primed to form a golden cross in the coming week.
Should prices drop below there, the window created last week between Wednesday & Thursday will become a problem area & likely lead to further declines.
Price Level:Volume Sentiment Analysis For IWM, The iShares Russell 2000 ETF
IWM is in a different camp than the other major indexes, as although they too are are 52-week highs & have limited data at these levels, they also have not ascended the same way as the others & have fluctuated more in ranges of the past year.
As they move differently than the other three ETFs noted in this article, it is imperative to consider that while reading their charts below.
The support zone of $194-197.99/share is currently jam packed with buyer sentiment, however, given that this contains two prior 52-week highs the sellers are underrepresented as there has been limited trading action at these price levels.
After a 7% drop from their current price level the buyer sentiment is much more diluted that it is at the higher price levels, which is where the shoulders of the prior head & shoulders patterns occurred.
Should it be tested, the $180-181.99/share price level will be interesting to see, given that it is currently even between buyers & sellers historically.
With how IWM tends to fluctuate in ranges & how their 52-week low was set only 2 months ago it will be interesting to see how buyers & sellers meet, as many of the price levels below do have limited/skewed data that is reflective of the oscillating nature of the ETF.
IWM ETF’s Price Level:Volume Sentiment For The Past 1-2 Years With Resistance & Support Levels
IWM ETF’s Price Level:Volume Sentiment For The Past 1-2 Years
$204 – NULL – 0:0*; +1.25% From Current Price Level
$200 – NULL – 0:0*; -0.73% From Current Price Level – Current Price Box*
$198 – NULL – 0:0*; -1.73% From Current Price Level
$196 – Buyers – 2:1; -2.72% From Current Price Level
$194 – Buyers – 7.67:1; -3.71% From Current Price Level – 10 Day Moving Average*
$192 – Sellers – 2.8:1; -4.71% From Current Price Level
$190 – Buyers – 5:1; -5.7% From Current Price Level
$188 – Sellers – 1.27:1; -6.69% From Current Price Level
$186 – Buyers – 3.5:1; -7.68% From Current Price Level
$184 – Buyers – 1.32:1; -8.68% From Current Price Level
$182 – Buyers – 1.15:1; -9.67% From Current Price Level
$180 – Even – 1:1; -10.66% From Current Price Level
$178 – Buyers – 1.36:1; -11.65% From Current Price Level – 200 Day Moving Average*
$176 – Buyers – 1.86:1; -12.65% From Current Price Level – 50 Day Moving Average*
$174 – Buyers – 1.04:1; -13.64% From Current Price Level
$172 – Buyers – 1.30:1; -14.63% From Current Price Level
$170 – Sellers – 1.79:1; -15.62% From Current Price Level
$168 – Sellers – 1.4:1; -16.62% From Current Price Level
$166 – Sellers – 2:1; -17.61% From Current Price Level
$164 – Sellers – 1.83:1; -18.6% From Current Price Level
$162 – Sellers – 1.35:1; -19.59% From Current Price Level
$160 – Sellers – 1.75:1; -20.59% From Current Price Level
Technical Analysis Of DIA, The SPDR Dow Jones Industrial Average ETF
DIA, the SPDR Dow Jones Industrial Average ETF gained +0.31% last week, faring the worst of the major indexes, as investors took profits on Wednesday & Thursday, while remaining otherwise rangebound all week.
DIA ETF – SPDR Dow Jones Industrial Average ETF’s Technical Performance Over The Past Year
Their RSI is also overbought at 74.82, while their MACD is currently bullish, but showing an impending bearish crossover in the coming week.
Volumes were +8.53% above average last week compared to the year prior (3,777,000 vs. 3,480,259), which indicates that people are still interested in the larger cap names, but are also on edge due to Wednesday’s declining session being the highest volume of the week (the chart also looks like someone giving the middle finger for the week if you look closely at the volumes, reading between the lines).
Monday kicked off the week on an uncertain note, with a spinning top that closed lower than it opened & whose real body remained mostly in the bottom 60% of the candle.
Tuesday saw a run higher with a wide-range candle that broke the $375/share mark & set a temporary new 52-week high, but there was limited volume confirming that this was a bullish signal.
Wednesday opened midway through Tuesday’s candle’s real body, broke higher to set a new 52-week high, but declined to below the close of the previous Thursday’s session & whose lower shadow dipped into the range the prior Wednesday’s session traded in, while on the highest volume of the week.
Thursday completed a bearish harami pattern with a long lower shadow that found support just above the 10 day moving average, but managed to close higher.
Friday provided even more indecision on a declining session that was a doji, as it’s upper shadow tested lower than the two highest sessions of the week, while its lower shadow dipped below all of the sessions except for Wednesday’s real bodies (and all but Thursday’s lower shadows as well).
DIA’s Average True Range is signaling that there is not a strong trend, but the line is flat, signaling that there will soon be a break to one direction or another.
Should there be a move to the downside & the 10 DMA’s support is broken, it will be worth watching to see where the 50 DMA is at, as currently the only support level between the 10 & 50 DMAs is $353.53/share.
There is also a watch for a bearish head & shoulders for DIA in the medium term, particularly as so many market participants have sought shelter there over the past 6-12 months.
Price Level:Volume Sentiment Analysis For DIA, The SPDR Dow Jones Industrial Average ETF
DIA’s price level:volume sentiment is also different than SPY & QQQ, but not for the same reasons as IWM.
They’ve run up so far from their nearest support levels that aren’t moving averages that there is a lot of room without much footing to catch on to.
The 10 day moving average currently is so close to the 52-week high that there is limited data on whether its buyer or seller dominated.
What’s concerning regarding DIA is that so many market participants have continued to pile into them while other indexes have taken losses, which gives cause for concern should there be some event that leads everyone for the exits.
In the event of a 10% correction to DIA, the levels below it for the next 2.25% down are still buyer dominated, but weakly, before the seller dominance steps in for an additional 4.25%, which is in the price range of their current 52-week high (set in March of 2023).
This will be something to keep an eye on in the event of decline, especially if there happens to be a 10%+ fall.
Given that DIA is also using 3-4 years worth of data, the lower range data discussed above is not as lacking in sample size compared to the other indexes mentioned prior, making it more meaningful in the long-run.
DIA ETF’s Price Level:Volume Sentiment For The Past 3-4 Years With Resistance & Support Levels
DIA ETF’s Price Level:Volume Sentiment For The Past 3-4 Years
DIA ETF’s Price Level:Volume Sentiment For The Past 3-4 Years
$380 – NULL – 0:0*; +1.66% From Current Price Level
$376 – NULL – 0:0*; +0.59% From Current Price Level
$372 – NULL – 0:0*; -0.48% From Current Price Level – Current Price Box & 10 Day Moving Average*
$368 – NULL – 0:0*; -1.55% From Current Price Level
$364 – NULL – 0:0*; -2.62% From Current Price Level
$360 – NULL – 0:0*; -3.69% From Current Price Level
$356 – NULL – 0:0*; -4.76% From Current Price Level
$352 – Buyers – 6:1; -5.83% From Current Price Level
$348 – Buyers – 1.27:1; -6.9% From Current Price Level – 50 Day Moving Average*
$344 – Sellers – 1.03:1; -7.97% From Current Price Level
$340 – Buyers – 2.08:1; -9.04% From Current Price Level
$336 – Buyers- 1.45:1; -10.11% From Current Price Level – 200 Day Moving Average*
$332 – Buyers – 1.03:1; -11.18% From Current Price Level
$328 – Buyers – 1.07:1; -12.25% From Current Price Level
$324 – Sellers – 1.38:1; -13.32% From Current Price Level
$320 – Sellers – 1.04:1; -14.39% From Current Price Level
$316 – Sellers – 1.42:1; -15.46% From Current Price Level
$312 – Sellers – 1.78:1; -16.53% From Current Price Level
$308 – Buyers – 1.93:1; -17.6% From Current Price Level
$304 – Sellers – 1.55:1; -18.67% From Current Price Level
$300 – Buyers – 1.2:1; -19.74% From Current Price Level
$296 – Buyers – 1.44:1; -20.81% From Current Price Level
$292 – Sellers – 1.47:1; -21.88% From Current Price Level
$288 – Even – 1:1; -22.95% From Current Price Level
$284 – Buyers – 1.06:1; -24.02% From Current Price Level
$280 – Sellers – 1.1:1; -25.09% From Current Price Level
$276 – Buyers – 1.4:1; -26.16% From Current Price Level
$272 – Buyers – 4:1; -27.23% From Current Price Level
$268 – Buyers – 4:1; -28.3% From Current Price Level
$264 – Sellers – 1.18:1; -29.37% From Current Price Level
$260 – Buyers – 1.21:1; -30.44% From Current Price Level
$256 – Buyers – 1.43:1; -31.51% From Current Price Level
$252 – Buyers – 1.71:1; -32.58% From Current Price Level
$248 – Buyer s- 1.56:1; -33.65% From Current Price Level
$244 – Buyers – 4.25:1; -34.72% From Current Price Level
$240 – Buyers – 3.2:1; -35.79% From Current Price Level
$236 – Sellers – 2.33:1; -36.86% From Current Price Level
$232 – Sellers – 4.5:1; -37.93% From Current Price Level
$228 – Buyers – 6:1; -39% From Current Price Level
$224 – Buyers – 1.17:1; -40.07% From Current Price Level
$220 – Buyers – 2.11:1; -41.14% From Current Price Level
$216 – Buyers – 1.22:1; -42.22% From Current Price Level
$212 – Sellers – 0.3:0**; -43.29% From Current Price Level
$208 – Buyers – 1:0*; -44.36% From Current Price Level
$204 – NULL – 0:0*; -45.43% From Current Price Level
$200 – NULL – 0:0*; -46.5% From Current Price Level
$198 – Buyers – 0.3:0*; -47.03% From Current Price Level
$196 – Sellers – 0.3:0*; -47.57% From Current Price Level
$194 – NULL – 0:0*; -48.1% From Current Price Level
$192 – NULL – 0:0*; -48.64% From Current Price Level
The Week Ahead
Monday will have no economic data to report as it is Christmas & markets will be closed.
Tuesday kicks the week off with S&P Case-Schiller Home Price Index (20 cities) dat at 9 am.
Wednesday has no data scheduled to be released.
Initial Jobless Claims, Advanced U.S. Trade Balance In Goods, Advanced Retail Inventories & Advanced Wholesale Inventories data are released Thursday at 8:30 am, followed by Pending Home Sales at 10 am.
Friday the week winds down with the Chicago Business Barometer data at 9:45 am & the bond market will be closing early.
See you back here next year!
*** I DO NOT OWN SHARES OR OPTIONS CONTRACT POSITIONS IN SPY, QQQ, IWM, OR DIA & THIS IS NOT INVESTING ADVICE, PLEASE DO YOUR OWN DUE DILIGENCE ***
Bank of America Corp. stock trades under the ticker BAC & has gained +10.16% over the past year (ex-dividends), falling -8.27% since their 52-week high in February of 2023, but has reclaimed +35.98% since their 52-week low in October of 2023.
Below is a brief technical analysis of BAC’s recent price performance, as well as a price level:volume sentiment analysis that covers price data for the past 5-6 years.
Before going forward please note that I have both a long position in BAC shares, as well as a short position against them as well using puts.
Technical Analysis Of Bank Of America Corp. BAC Stock
Bank Of America Corp. BAC Stock’s Technical Performance Over The Past Year
Their RSI is overbought at 83.06, while their MACD is bullish currently after the price action of the past two sessions extended it from approaching a bearish crossover.
Volumes over the past week have been +12.03% above average compared to the year prior (53,813,820 vs. 48,035,243.43), mostly driven by Wednesday’s session (~2x Friday, Monday & Tuesday’s average) & Thursday’s, which in one day was almost the sum of the first three days in the calculation.
Given how overextended the broader markets look this volume spike looks more like a last minute squeeze, rather than a new trend being established & a means of pumping one last profit before a consolidation period.
The window from Thursday’s gap up session will be an area to watch next week as a result, as there is only one support level currently within the window range, pending the 10 day moving average doesn’t move up into it in the meantime.
BAC stock’s 50 day moving average is approaching their 200 DMA quickly & looks primed to form a golden cross in the coming days, which may help catch prices for a day or two should they decline sharply prior.
Given their current technical outlook & the technical outlook of the major indexes, it is a good time to look at their price level:volume sentiment to assess the strength & weakness of their nearby support & resistance levels.
The data below is from the past 5-6 years, with the ratio of Buyers:Sellers (or Sellers:Buyers) for each price level that BAC stock has traded at over that time period.
While the support & resistance levels noted in the top image of the next section are only for the past year’s chart, the chart below contains data that covers the range of price level:volume sentiment data for your reference.
Please note that this is meant to serve as a barometer or compass rose & be used as supporting information to help with investing research, but should not be taken as investment advice.
Bank Of America Corp. BAC Stock’s Technical Performance Over The Past 5 Years
Price Level:Volume Sentiment For Bank Of America Corp. BAC Stock
Bank Of America Corp. BAC Stock’s Price Level:Volume Sentiment Analysis For The Past 5-6 Years With Their Past Year’s Support & Resistance Levels
Bank Of America Corp. BAC’s Price Level:Volume Sentiment Analysis For The Past 5-6 Years
Bank Of America Corp. BAC’s Price Level:Volume Sentiment Analysis For The Past 5-6 Years
$48 – NULL – 0:0*; +41.43% From Current Price Level
$47 – NULL – 0:0*; +38.48% From Current Price Level
$46 – Sellers – 2:1; +35.53% From Current Price Level
$45 – Buyers – 4.5:1; +32.59% From Current Price Level
$44 – Buyers – 1.31:1; +29.64% From Current Price Level
$43 – Sellers – 1.13:1; +26.69% From Current Price Level
$42 – Buyers – 1.73:1; +23.75% From Current Price Level
$41 – Sellers – 2.58:1; +20.8% From Current Price Level
$40 – Sellers – 1.25:1; +17.86% From Current Price Level
$39 – Buyers – 1.74:1; +14.91% From Current Price Level
$38 – Buyers – 1.12:1; +11.96% From Current Price Level
$37 – Buyers – 1.25:1; +9.02% From Current Price Level
$36 – Buyers – 1.19:1; +6.07% From Current Price Level
$35 – Sellers – 1.27:1; +3.12% From Current Price Level
$34 – Buyers – 1.37:1; +0.18% From Current Price Level
$33 – Buyers – 1.26:1; -2.77% From Current Price Level – Current Price Box*
$32 – Sellers – 1.33:1; -5.72% From Current Price Level
$31 – Buyers – 1.21:1; -8.66% From Current Price Level – 10 Day Moving Average*
$30 – Buyers – 1.15:1; -11.61% From Current Price Level
$29 – Sellers – 1.5:1; -14.56% From Current Price Level
$28 – Buyers – 1.53:1; -17.5% From Current Price Level – 50 & 200 Day Moving Averages**
$27 – Sellers – 1.06:1; -20.45% From Current Price Level
$26 – Buyers – 1.18:1; -23.39% From Current Price Level
$25 – Buyers – 1.1:1; -26.34% From Current Price Level
$24 – Sellers – 1.04:1; -29.29% From Current Price Level
$23 – Buyers – 1.2:1; -32.23% From Current Price Level
$22 – Buyers – 2:1; -35.18% From Current Price Level
$21 – Sellers – 1.37:1; -38.13% From Current Price Level
$20 – Sellers – 1.27:1; -41.07% From Current Price Level
$19.50 – Sellers – 1.88:1; -42.55% From Current Price Level
$19 – Buyers – 3.6:1; -44.02% From Current Price Level
$18.50 – Sellers – 7:1; -45.49% From Current Price Level
$18 – Sellers – 0.4:0*; -46.97% From Current Price Level
$17.50 – Sellers – 0.4:0*; -48.44% From Current Price Level
$17 – NULL – 0:0*; -49.91% From Current Price Level
$16.50 – Sellers – 0.7:0*; -51.38% From Current Price Level
$16 – NULL – 0:0*; -52.86% From Current Price Level
*** I OWN A LONG POSITION IN BAC STOCK SHARES & ALSO CURRENTLY HAVE A SHORT POSITION AGAINST THEM AT THE TIME OF PUBLISHING THIS ARTICLE ***
SPY, the SPDR S&P 500 ETF remained relatively flat last week, only adding +0.24%, as market participants remained cautious while awaiting this week’s CPI, PPI & Fed Interest Rate decision data this upcoming week.
SPY ETF – SPDR S&P 500 ETF’s Technical Performance Over The Past Year
Their RSI is currently overbought at 70.08, with a MACD that is bearish after crossing over last week, but it is relatively flat following the tightly rangebound price action of the past few weeks.
Volumes were -8.43% below average compared to the year prior (75,087,217 vs. 81,996,981), which does not cast a bullish picture, particularly as while Friday’s bullish volume led the week, Monday, Tuesday & Wednesday’s bearish volume sessions were higher than Thursday’s advancing session & not far below Friday’s volume.
Monday kicked the week off on a bearish note, although the upper shadow of the day’s candle tested much higher than the lower shadow tested lower & the session opened on the 10 day moving average, but was able to close higher than the open, despite being lower than the previous Friday’s session.
However, the spinning top candle does imply indecision.
Tuesday followed in Monday’s footsteps in terms of a spinning top with the same opening & closing attributes, however it did not test as high & was on lower volume, signaling more uncertainty among market participants.
Wednesday opened near the highs of Monday’s session, however it took a bearish turn & ultimately closed below the support of the 10 day moving average.
Thursday saw some bullish price action, but the uncertain theme continued as the session resulted in a spinning top & were on the lowest volume session of the week.
However, it should be noted that the 10 DMA was able to support the candle, with the lower shadow bouncing off of it & heading higher.
Friday opened above the 10 DMA & closed higher with a small upper shadow & set a new 52-week high, which will be an area to watch going into next week.
The 10 DMA will also be important to watch, as it has become more rounded at the top which will likely make it weaker as a support level & it will become the highest support level in the near future.
Their Average True Range has remained flat since late November in the lower end of their chart, as there has been limited volatility with the majority of days resulting in limited movement upwards or downwards.
It should also be noted that currently the price level for SPY has historically been dominated by sellers, which although is to be expected as it is near a price extreme, will make watching their price levels in relation to the chart below important in the coming weeks.
If there are further advances it will shed insight into how much further it will run & if there are declines it will highlight the strength of the support levels below the price.
SPY has support at the $457.82 (Volume Sentiment: Buyers, 2:0*), $456.60 (Volume Sentiment: Buyers, 2:0*), $452.08 (Volume Sentiment: Even, 1:1) & $438.14/share (Volume Sentiment: Buyers, 1.21:1) price levels, with no resistance levels from the past year as they are currently at a new 52-week high.
SPY ETF’s Price Level:Volume Sentiment Analysis For The Past 2-3 Years
QQQ, the Invesco QQQ Trust ETF improved +0.57% over the past week, faring second best of the major indexes after a having the worst week of the bunch the week prior.
QQQ ETF – Invesco QQQ Trust ETF’s Technical Performance Over The Past Year
Their RSI is trending towards overbought conditions & currently sits at 65.6, while the MACD is bearish but has recently flattened after last week’s results.
Volumes were -14.04% below average last week compared to the year prior (45,461,933 vs. 52,885,137), signaling severe hesitancy by traders & investors.
Monday’s volumes on the declining session were the highest of the week, with Tuesday’s advancing session having the second lowest volumes (only to Wednesday’s declining session).
Monday’s candle was a dragonfly doji, which set the stage for a slight upwards movement for the rest of the week, but also signaled that there would be uncertainty among market participants.
Thursday’s advancing session had the highest volume of the week, however when you break down the day’s candlestick the upper shadow is the smallest, the day’s open occurred at the 10 day moving average & while it closed higher, it did test the support of the 10 DMA by dipping below it & going over halfway down the wide-range bar of Wednesday’s bearish session.
That 10 day moving average will be something to keep an eye on in the near future, as over the past week it has spent a fair amount of time serving as the support & resistance in a relatively tight price range, which will eventually exhaust when there hasn’t been enough bullish action with it acting as support.
Their Average True Range does not indicate there has bee much volatility recently, but given how their past 14 sessions have traded over a tight price range with limited movements to the upside & downside this makes sense & is beginning to look concerning & foreboding of something on the horizon.
QQQ has support at the $388.92 (10 Day Moving Average; Volume Sentiment: NULL, 0:0*), $387.42 (Volume Sentiment: Buyers, 1.75:1), $380.28 (Volume Sentiment: Buyers, 6:1) & $373.74/share (Volume Sentiment: Buyers, 1.1:1) price levels, with resistance at the $394.14/share (Volume Sentiment: NULL, 0:0*) price level, which is their 52-week high which was set last week.
QQQ ETF’s Price Level:Volume Sentiment Analysis Over The Past 1-2 Years
IWM ETF – iShares Russell 2000 ETF’s Technical Performance Over The Past Year
Their RSI is trending towards overbought levels at 66.92, with a bullish MACD that is beginning to show signs of fading enthusiasm after a strong past few weeks.
Volumes were +41.51% above average last week compared to the year prior (43,038,183 vs. 30,412,676), which paints an interesting picture given that Monday’s session was the strongest volume of the week (but hardly compared with Friday before it) on a wide-range session by prices with limited shadows on the upper/lower.
Tuesday opened mid-way up Monday’s price range, tested lower than Monday’s total range, but closed within the real-body of Monday’s candle, still for a loss (bearish sentiment) on the second lowest volume of the week.
Wednesday’s volumes are where things get interesting, as the day opened higher than Tuesday’s close, tested the $187.96 resistance level (or $187-188 resistance zone) but were only able to reach $187.92, before ultimately closing lower than the day prior & leaving an upper shadow that makes up over half of the day’s candle.
This did not show much confidence in the retest of the resistance level noted above, which despite the next two session’s moving higher, were untested again, with Friday’s candle having a large upper shadow compared to the day’s open/close range.
Their Average True Range will be an important thing to watch in the coming weeks, as the sessions with the lowest price volatility of the 14 day calculation period will all be removed & replaced by Wednesday, implying an uptick in volatility may be on the horizon.
Their 10 day moving average will need to have a close eye kept on it this upcoming week, as if prices fall beneath it it will join many other resistance points right above their current price levels.
IWM has support at the $184.57 (Volume Sentiment: Sellers, 1.26:1), $182.79 (10 Day Moving Average; Volume Sentiment: Buyers, 1.55:1), $180.76 (Volume Sentiment: Sellers, 1.13:1) & $179.88 /share (Volume Sentiment: Buyers, 1.05:1) price levels, with resistance at the $186.87 (Volume Sentiment: Buyers, 4.62:1), $187.92 (Volume Sentiment: Buyers, 4.62:1), $187.92 (Volume Sentiment: Buyers, 4.62) & $188.36/share (Volume Sentiment: Buyers, 2.75:1) price levels.
IWM ETF’s Price Level:Volume Sentiment Analysis Over The Past 1-2 Years
DIA ETF – SPDR Dow Jones Industrial Average ETF’s Technical Performance Over The Past Year
Their RSI is overbought at 77.53 & has been above the overbought 70-level since mid-November, with a MACD that has curled over set to make a bearish MACD crossover in the coming week.
Volumes were +29.24% above average last week compared to the year prior (4,539,983 vs. 3,512,913), which is noteworthy as it shows a lot of profit taking following a few weeks of advances, while the week’s price range itself did not make much of an attempt to advance higher.
Monday kicked the week off on a bearish note, although the session closed higher than it opened, but it still declined from the Friday prior’s close.
Tuesday’s session was interesting, as they had the second highest volume day of the week on a declining day, but resulted in a dragonfly doji, signaling both uncertainty, but that there may be a slight advance on the horizon.
Wednesday had the highest volume of the week on a wide-range candle whose upper shadow tested higher, but closed much lower than the open & had a slight lower shadow indicating that there was still some sentiment to test lower.
Thursday & Friday had the lowest volumes of the week, despite being the only advancing sessions, with Thursday resulting in a doji whose open & close were above the top half of the candle & Friday’s upper shadow hitting a new 52-week high but on the weakest volume of the week, which does not signal confidence in a move higher.
Their Average True Range is signaling a severe lack of volatility, which when you look at other times in the past year where it has dipped near this low there has been a consolidation period on the horizon.
Their 10 day moving average will be a point of interest to watch in the coming week, as it will need to provide the support to keep pushing DIA higher, as their other indicators & oscillators signal that they’re due to take a breather & cool off.
DIA has support at the $359.59 (10 Day Moving Average; Volume Sentiment: NULL, 0:0*), $354.32 (Volume Sentiment: Buyers, 1:0*), $349.45 (Volume Sentiment: Sellers, 1.17:1) & $343.16/share (Volume Sentiment: Buyers, 1.41:1) price levels, with no resistance in the past year as it closed the week out on a new 52-week high.
DIA ETF’s Price Level:Volume Sentiment Analysis Over The Past 3-4 Years
The Week Ahead
Monday starts the week off on a quiet note, with no major market data announcements.
Casey’s General, FuelCell Energy & Oracle are all scheduled to report earnings on Monday.
Consumer Price Index, Core CPI, CPI Y-o-Y & Core CPI Y-o-Y are all due at 8:30 am on Tuesday, followed by the monthly U.S. Federal Budget at 2pm.
Tuesday is relatively quiet on the earnings report front.
Wednesday brings us Producer Price Index, Core PPI, PPI Y-o-Y & Core PPI Y-o-Y data at 8:30 am, with the FOMC Interest-Rate Decision announced at 2 pm & Fed Chairman Powell’s Press Conference at 2:30 pm.
Adobe, ABM Industries, Cognyte Software, Nordson, Photronics & REV Group report earnings on Wednesday.
Thursday morning is a busy one, with Initial Jobless Claims, Import Price Index, Import Price Index minus Fuel, U.S. Retail Sales & Retail Sales minus Autos data coming in at 8:30 am, followed by Business Inventories data at 10 am.
Costco Wholesale, Jabil & Lennar are all releasing earnings reports on Thursday.
Empire State Manufacturing Survey data is released Friday morning at 8:30 am, followed by Industrial Production & Capacity Utilization data at 9:15 am.
Darden Restaurants is scheduled to report earnings on Friday.