Schlumberger Ltd. stock trades under the ticker SLB & has climbed +83.35% since their 52-week low in September of 2022 (ex-dividends), closely in-line with the advances of OIH who were featured in yesterday’s post.
SLB makes up ~20% of OIH’s total holdings & is also a component of IEZ (22.34%), XLE (4.54%), PXJ (5.02%), XES (4.2%), IYE (4.45%) RSPG (4.41%), DRLL (4.36%) & many other ETFs, hence the similar performance of the stock & the ETF.
As SLB currently sits -2.69% below their 52-week high, it’s worth taking a look into how market participants have behaved in recent history at each price level that they’ve traded at in order to gain insight into how they may behave in the near future.
This will serve as a reference for how strong support & resistance levels may be when they are approached again.
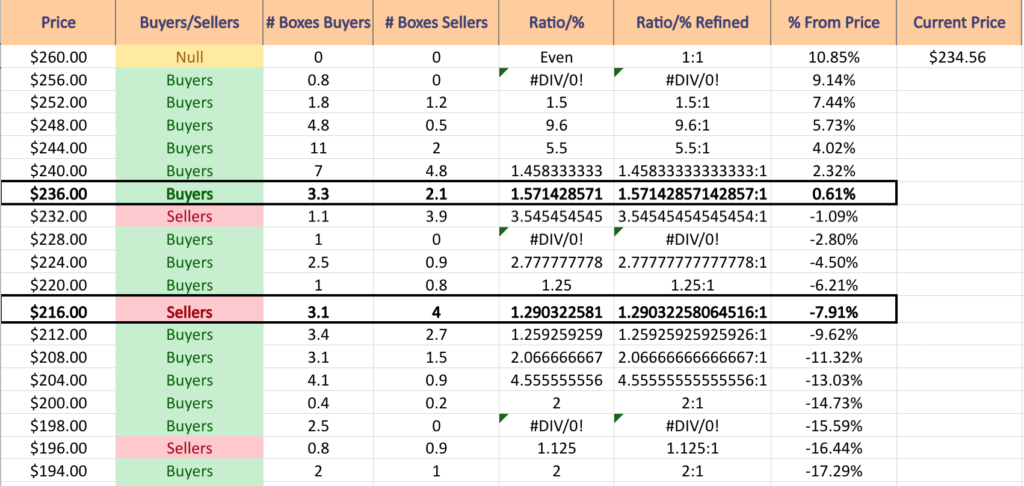
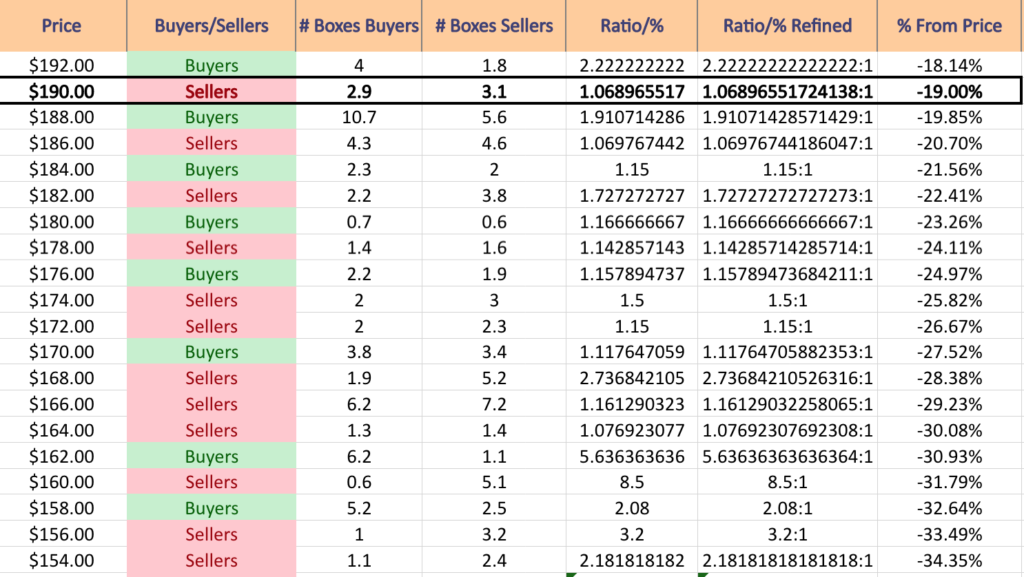
The Price:Volume analysis below seeks to display the volume at specific share-price levels from over the past one-to-two years & is intended to serve as a reference point for how investors viewed SLB stock’s value at each level.
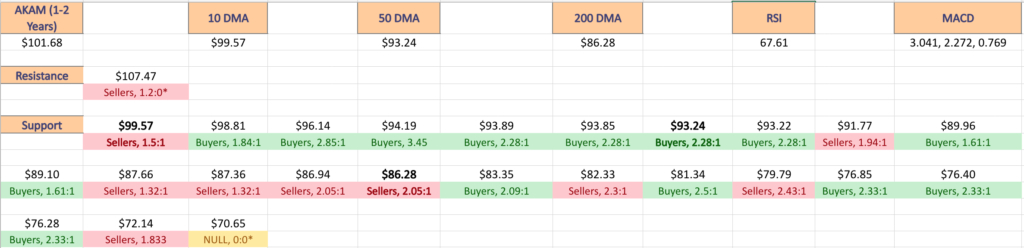
It also includes a list of moving averages, as well as support & resistance levels, which will be marked in bold.
Breaking Down The Technicals & Price:Volume Sentiment For Schlumberger Ltd. SLB Stock
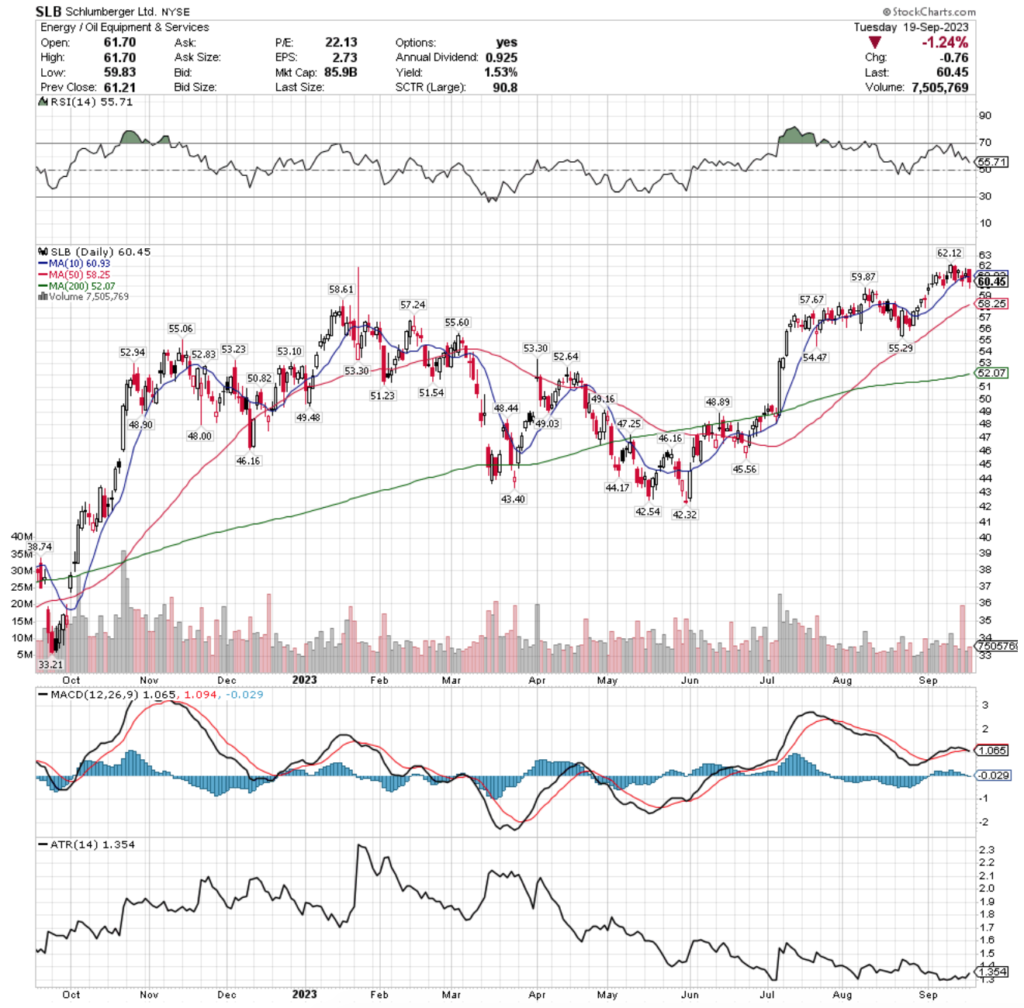
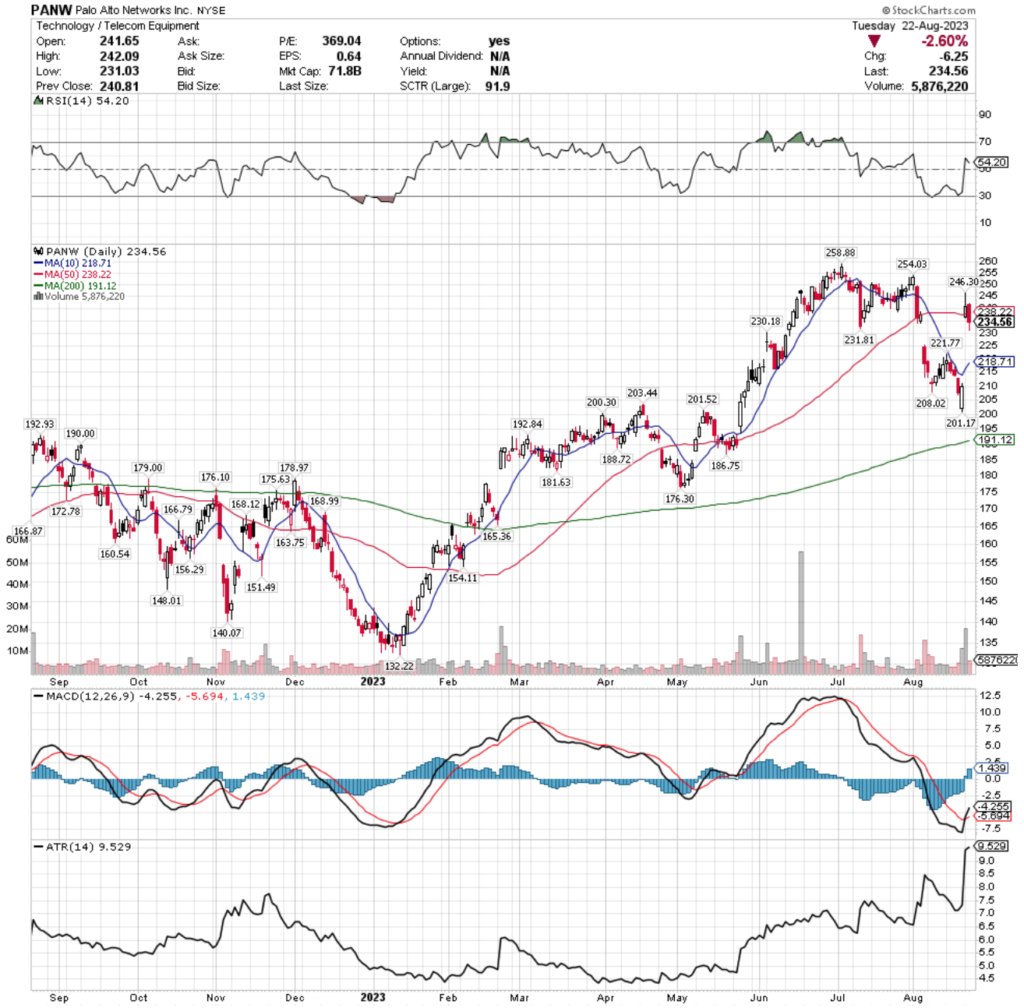
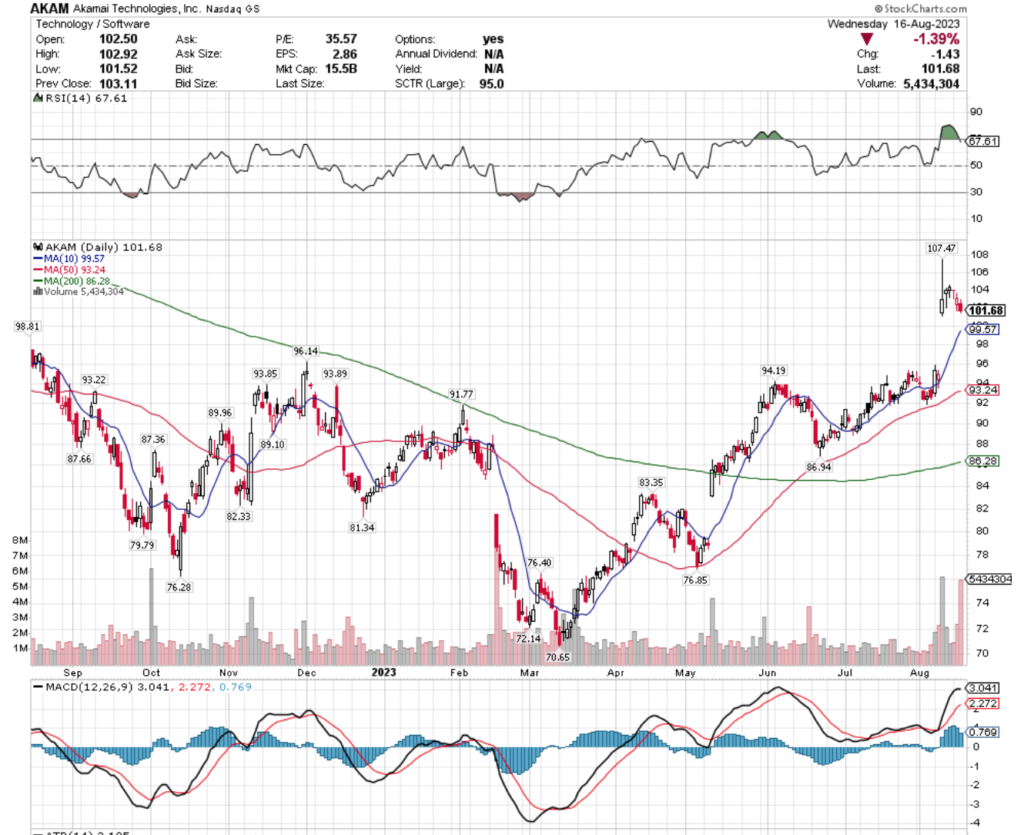
Schlumberger Ltd. SLB Stock’s Technical Performance Over The Past Year
Their RSI is trending back towards neutral & currently sits at 55.71, with a MACD that is about to crossover bearishly in the coming 1-2 days.
SLB’s volumes over the past week & a half have been -6.65% below average compared to the year prior (9,960,342.86 vs. 10.670,062.95), indicating that investors have become hesitant at these high price levels to continue buying & are taking a break during this consolidation range.
One thing of note, Friday’s session had the highest volume in a risk off move into the weekend, where a spinning top candle was unable to break the resistance of the 10 day moving average.
There looks to be a bearish head & shoulders pattern forming that began forming in July/early August, where the head would be the 52-week high’s session.
The profit taking from that +12.35% run up to the high covered a much wider range of prices for the day’s session, but occurred on ~33% of the volume of the highest volume sell off day & the former session was supported by the 10 DMA, whereas the latter was unable to close above it.
This may serve as confirmation that we will see that pattern formation play out in the coming month if the 10 DMA continues to act as resistance in the coming days.
Monday’s session was another spinning top & while bullish, the price action for the day in terms of the open & the close were concentrated around the bottom of the candle, barely above the 10 DMA.
Yesterday’s session closed below the 10 DMA, with the lower shadow of the candle signaling that investors were even more bearish on the day, which looks likely to continue in the near-term.
Looking at their Average True Range (ATR, Bottom Pane of Chart), the ATR is reverting back to the mean as their price deflates, which signals that there is likely going to be more selling over the next couple of weeks before a new consolidation range is established.
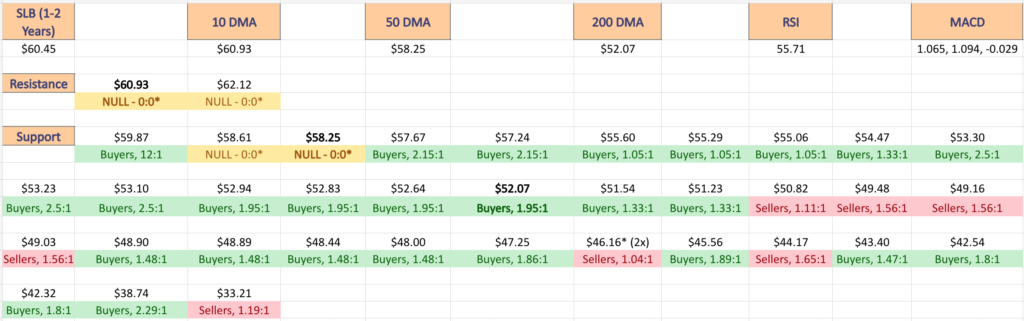
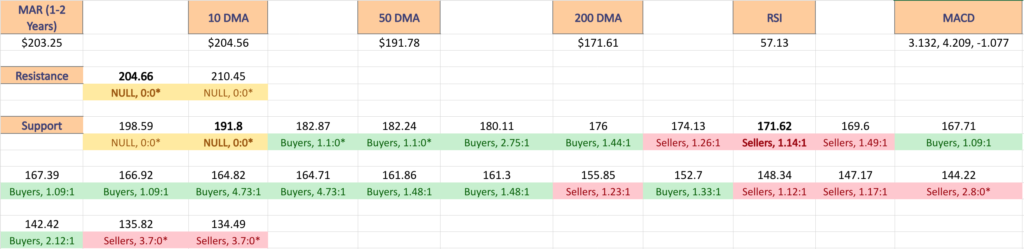
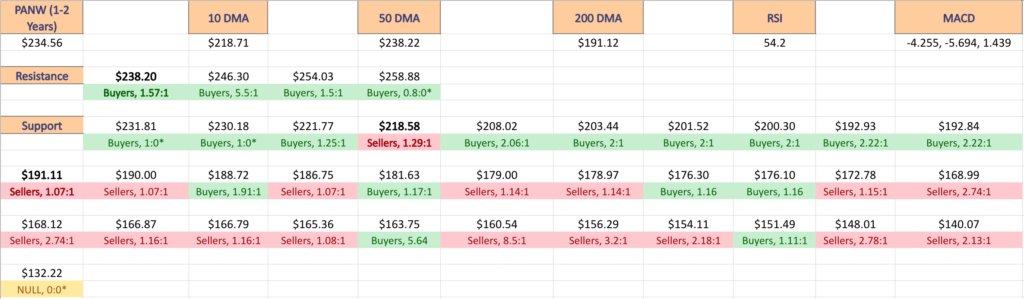
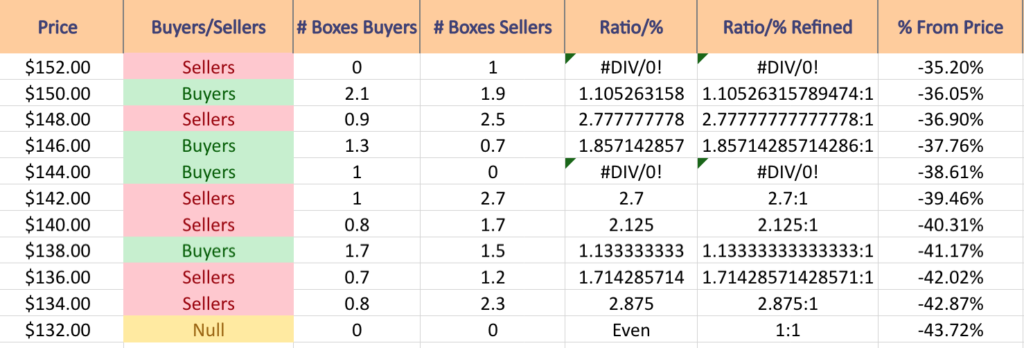
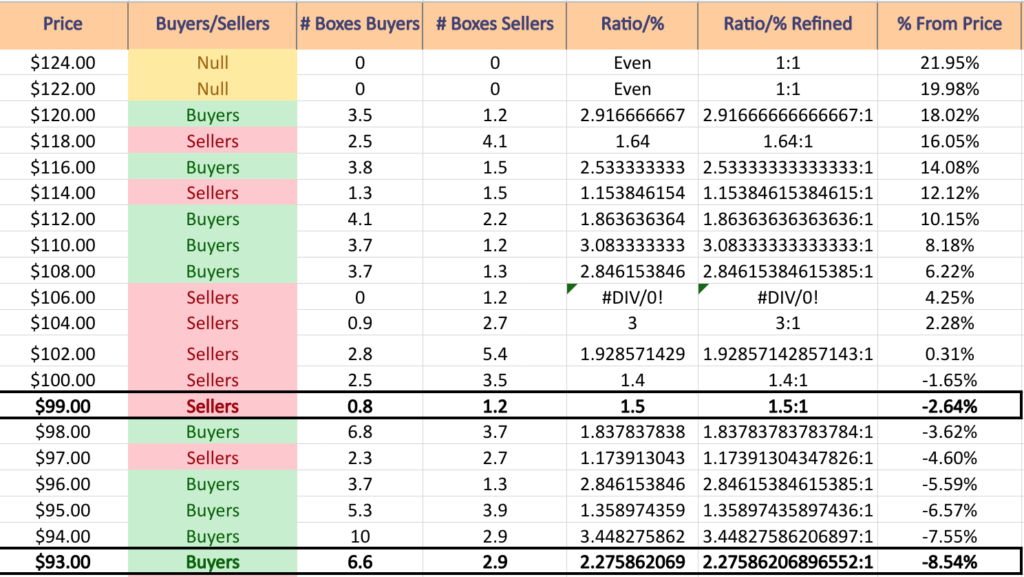
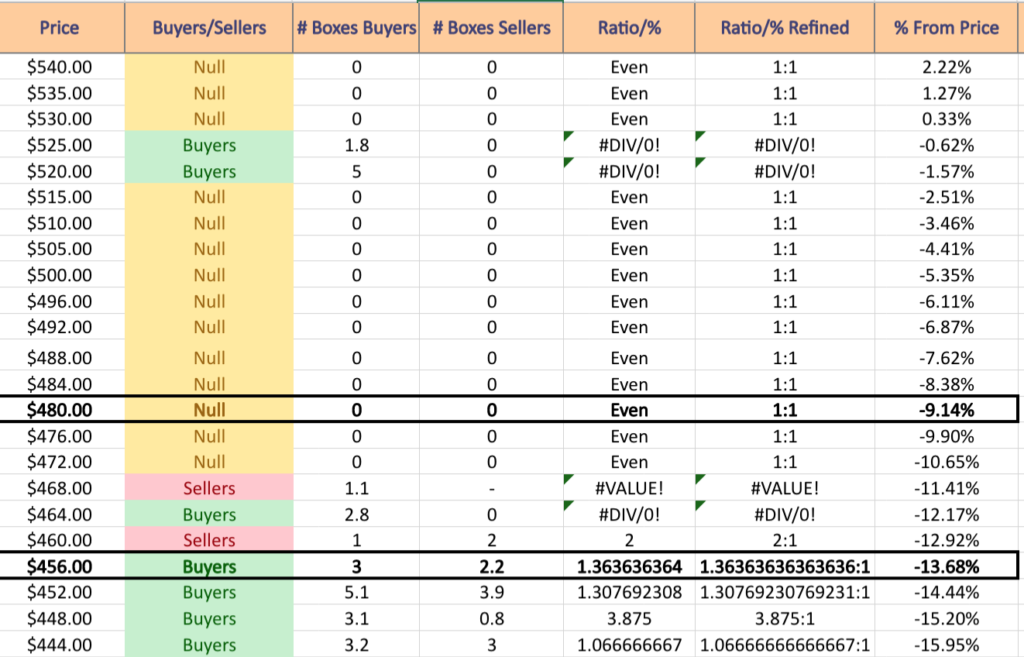
With this in mind, when reading the chart & list below keep in mind the Buyer:Seller sentiment at each price level SLB trades at in the coming weeks to see if there are clues from their past 1-2 years’ of price data for how the markets will react, particularly around key support levels.
The bold prices on the image below denote the moving average levels just listed & the bold entries in the list form of the analysis under the images include other levels of support.
Each corresponding price level using a ratio of Buyers:Sellers (or Sellers:Buyers), NULL values denote that there was not enough data, so the ratio would’ve been 0:0.
Ratios with a 0 for the denominator/constant are denoted with an *, but are reported as is, as we are accounting for volume/sentiment.
Schlumberger Ltd. SLB Stock’s Volume Sentiment At Each Price Level It’s Covered Over The Past 1-2 Years
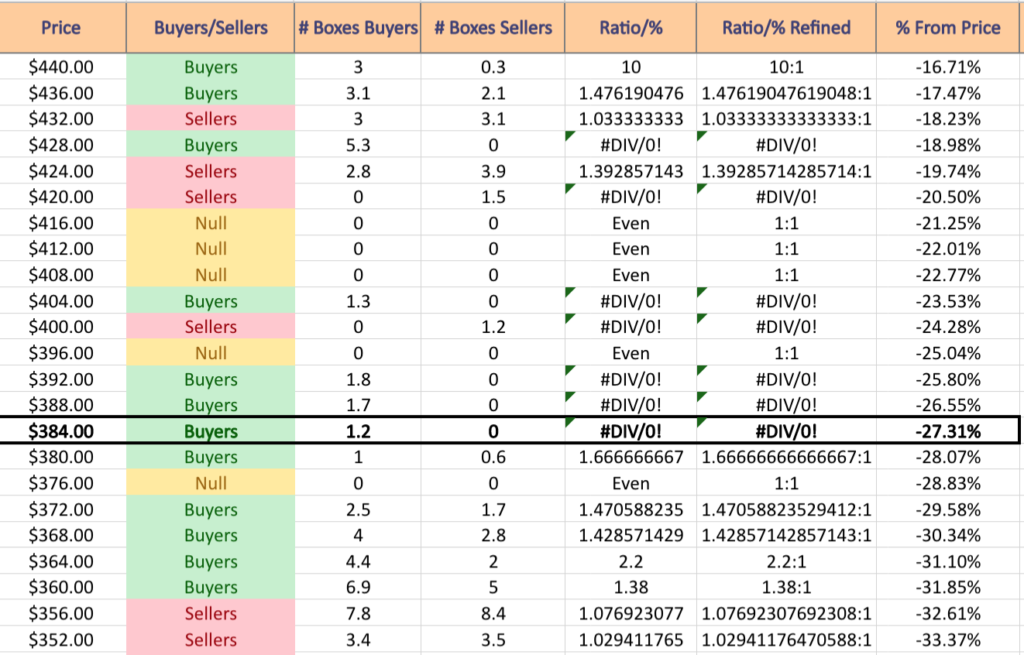
Schlumberger Ltd. SLB Stock’s Volume Sentiment At Each Price Level It’s Covered Over The Past 1-2 Years
Schlumberger Ltd. SLB Stock’s Volume Sentiment At Each Price Level It’s Covered Over The Past 1-2 Years
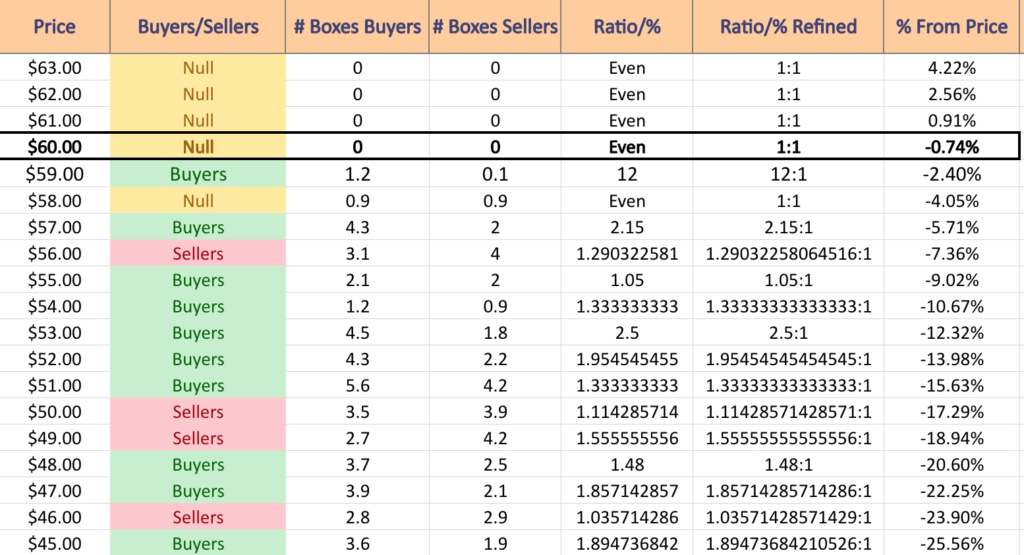
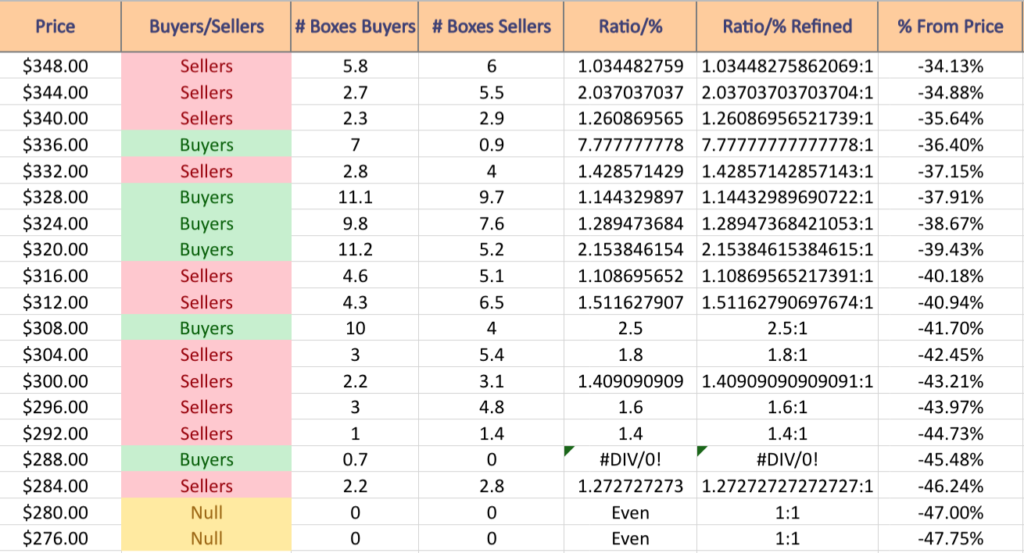
Schlumberger Ltd. SLB Stock’s Volume Sentiment At Each Price Level Over The Past 1-2 Years
$63 – NULL – 0:0*; +4.22% From Current Price
$62 – NULL – 0:0*; +2.56% From Current Price
$61 – NULL – 0:0*; +0.91% From Current Price
$60 – NULL – 0:0*; -0.74% From Current Price – Current Price Level & 10 Day Moving Average
$59 – Buyers – 12:1; -2.4% From Current Price
$58 – NULL – 0:0*; -4.05% From Current Price – 50 Day Moving Average
$57 – Buyers – 2.15:1; -5.71% From Current Price
$56 – Sellers – 1.29:1; -7.36% From Current Price
$55 – Buyers – 1.05:1; -9.02% From Current Price
$54 – Buyers – 1.33:1; -10.67% From Current Price
$53 – Buyers – 2.5:1; -12.32% From Current Price
$52 – Buyers – 1.95:1; -13.98% From Current Price – 200 Day Moving Average
$51 – Buyers – 1.33:1; -15.63% From Current Price
$50 – Sellers – 1.11:1; -17.29% From Current Price
$49 – Sellers – 1.56:1; -18.94% From Current Price
$48 – Buyers – 1.48:1; -20.6% From Current Price
$47 – Buyers – 1.86:1; -22.25% From Current Price
$46 – Sellers – 1.04:1; -23.9% From Current Price
$45 – Buyers – 1.89:1; -25.56% From Current Price
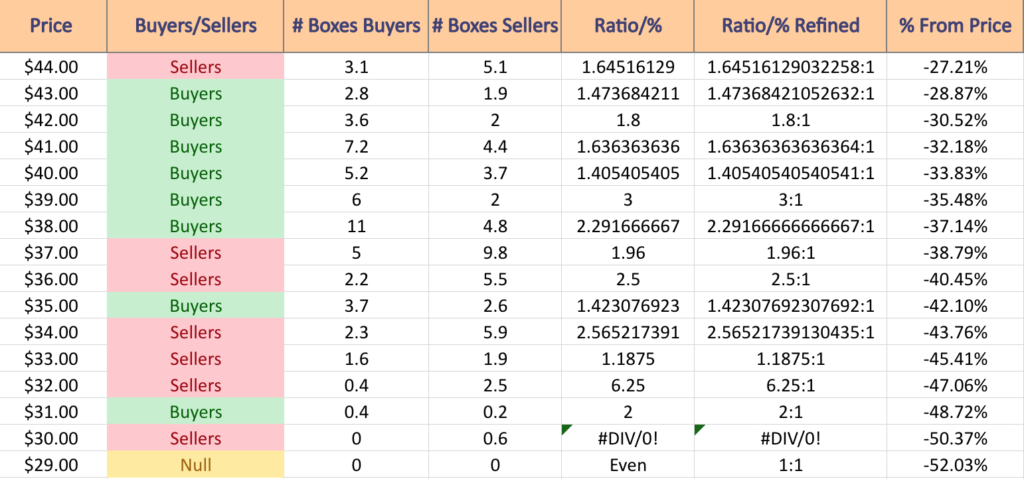
$44 – Sellers – 1.65:1; -27.21% From Current Price
$43 – Buyers – 1.47:1; -28.87% From Current Price
$42 – Buyers – 1.8:1; -30.52% From Current Price
$41 – Buyers – 1.64:1; -32.18% From Current Price
$40 – Buyers – 1.41:1; -33.83% From Current Price
$39 – Buyers – 3:1; -35.48% From Current Price
$38 – Buyers – 2.29:1; -37.14% From Current Price
$37 – Sellers – 1.96:1; -38.79% From Current Price
$36 – Sellers – 2.5:1; -40.45% From Current Price
$35 – Buyers – 1.42:1; -42.1% From Current Price
$34 – Sellers – 2.57:1; -43.76% From Current Price
$33 – Sellers – 1.19:1; -45.41% From Current Price
$32 – Sellers – 6.25:1; -47.06% From Current Price
$31 – Buyers – 2:1; 48.72% From Current Price
$30 – Sellers – 0.6:0*; -50.37% From Current Price
$29 – NULL – 0:0*; -52.03% From Current Price
Tying It All Together
The list & images above paint the picture as to how investors & traders have behaved at various price levels that SLB has been at over the past one-to-two years.
It is not meant to serve as investment/trading advice, and is simply a way to visualize what investor/trader sentiment has been like at each of the price levels mentioned, as well as what it was at levels of support & resistance that are denoted in the image & list.
As always, do your own due diligence before making investing/trading decisions.
For more on the methodology on how the data was collected & put together, please refer to our original Price:Volume analysis.
*** I DO NOT OWN SHARES OR OPTIONS CONTRACT POSITIONS IN SLB AT THE TIME OF PUBLISHING THIS ARTICLE ***
OIH, the VanEck Vectors Oil Services ETF has performed well over the past year, gaining +82.78% since their 52-week low in September of 2022 (ex-distributions).
Much of their success has been due to the strength of oil & oil services companies in Q4 2022 & into 2023.
Their price is currently -1.48% below their 52-week high, making it an opportune time to check in & see what their volumes have been over the last 1-2 years at the price levels that they’ve traded at.
The Price:Volume analysis below seeks to display the volume at specific share-price levels from over the past one-to-two years & is intended to serve as a reference point for how investors viewed OIH ETF’s value at each level.
It also includes a list of moving averages, as well as support & resistance levels, which will be marked in bold.
Breaking Down The Technicals & Price:Volume Sentiment For OIH, The VanEck Vectors Oil Services ETF
OIH ETF – VanEck Vectors Oil Services ETF’s Technical Performance Over The Past Year
Their RSI is currently trending back towards neutral from oversold territory, but still sits relatively oversold at 63.76, as their MACD looks set for a bearish crossover in the coming days.
Trading volumes have declined -14.27% this past week compared to the average of the year prior’s volumes (602,360 vs. 702,596), as investors have adopted a wait & see approach with prices so close to their 52-week high.
The 10 day moving average will be a point of interest to keep an eye on, as it is the nearest level of support to the current share price & beginning to signal signs of weakness as it is curving over.
Last week kicked off with an up session on Monday, however the filled in candlestick body shows that the session closed lower than it opened, as enthusiasm waned during the day’s session.
Tuesday’s gap up set the stage for a rangebound rest of the week, with the last three sessions resulting in spinning top candlesticks, which signals uncertainty & hesitancy among market participants.
Technical indicators are signaling that it is time for a cool off for OIH’s price & the table & list below can be useful to see how market participants have behaved at each price level OIH traded at over the past 1-2 years.
While history will not repeat itself perfectly, it will often rhyme, making it worth having the insights below as you watch the price action for OIH in the near-future.
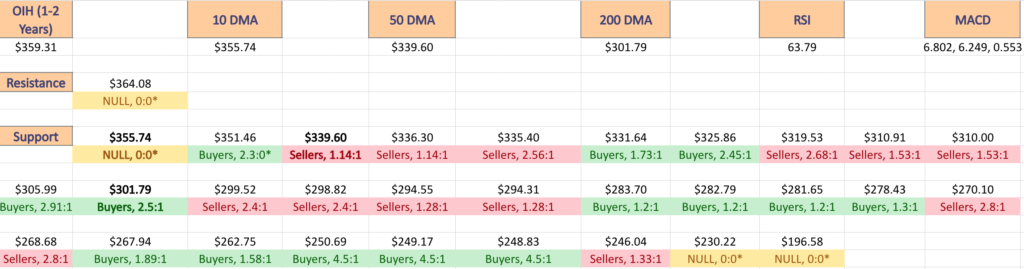
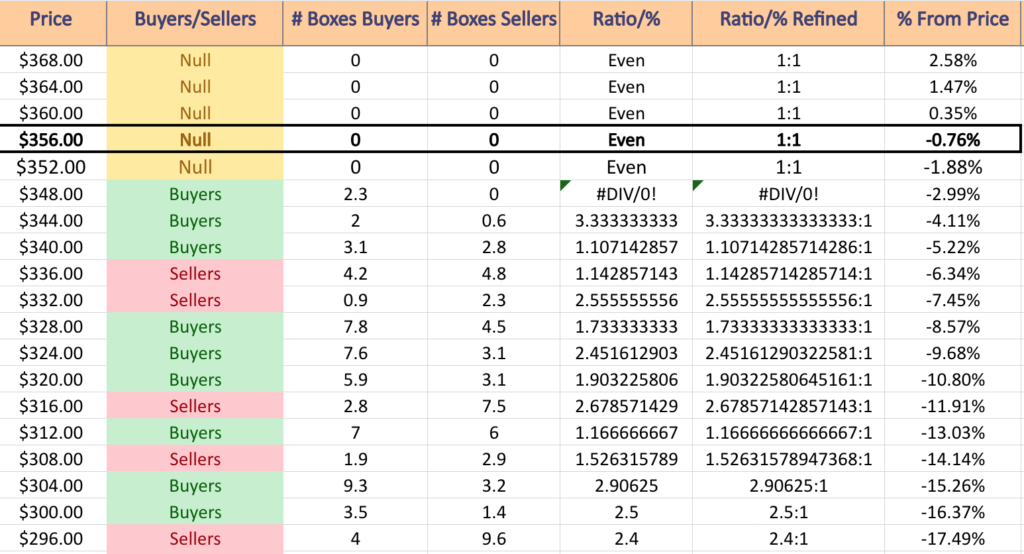
The bold prices on the image below denote the moving average levels just listed & the bold entries in the list form of the analysis under the images include other levels of support.
Each corresponding price level using a ratio of Buyers:Sellers (or Sellers:Buyers), NULL values denote that there was not enough data, so the ratio would’ve been 0:0.
Ratios with a 0 for the denominator/constant are denoted with an *, but are reported as is, as we are accounting for volume/sentiment.
OIH ETF’s Price:Volume Sentiment At Support & Resistance Levels From A One Year Chart
OIH ETF’s Volume Sentiment At Each Price Level It’s Traded At Over The Past 1-2 Years
OIH ETF’s Volume Sentiment At Each Price Level It’s Traded At Over The Past 1-2 Years
OIH, The VanEck Oil Services ETF’s Volume By Price Level Over The Past 1-2 Years
$368 – NULL – 0:0*; +2.58% From Current Price Level
$364 – NULL – 0:0*; +1.47% From Current Price Level
$360 – NULL – 0:0*; +0.35% From Current Price Level
$356 – NULL – 0:0*; -0.76% From Current Price Level – Current Price Block
$352 – NULL – 0:0*; -1.88% From Current Price Level – 10 Day Moving Average
$348 – Buyers – 2.3:0*; -2.99% From Current Price Level
$344 – Buyers – 3.33:1; -4.11% From Current Price Level
$340 – Buyers – 1.11:1; -5.22% From Current Price Level
$336 – Sellers – 1.14:1; -6.34% From Current Price Level – 50 Day Moving Average
$332 – Sellers – 2.56:1; -7.45% From Current Price Level
$328 – Buyer s- 1.73:1; -8.57% From Current Price Level
$324 – Buyers – 2.45:1; -9.68% From Current Price Level
$320 – Buyer s- 1.9:1; -10.8% From Current Price Level
$316 – Sellers – 2.68:1; -11.91% From Current Price Level
$312 – Buyers – 1.17:1; -13.03% From Current Price Level
$308 – Sellers – 1.53:1; -14.14% From Current Price Level
$304 – Buyers – 2.91:1; -15.26% From Current Price Level
$300 – Buyers – 2.5:1; -16.37% From Current Price Level – 200 Day Moving Average
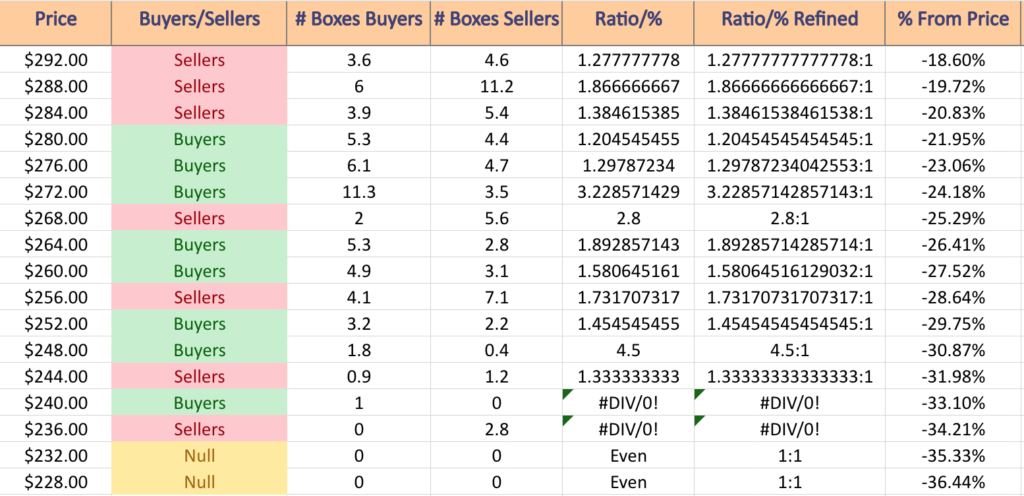
$296 – Sellers – 2.4:1; -17.49% From Current Price Level
$292 – Sellers – 1.28:1; -18.6% From Current Price Level
$288 – Sellers – 1.87:1; -19.72% From Current Price Level
$284 – Sellers – 1.39:1; -20.83% From Current Price Level
$280 – Buyers – 1.2:1; -21.95% From Current Price Level
$276 – Buyers – 1.30:1; -23.06% From Current Price Level
$272 – Buyers – 3.23:1; -24.18% From Current Price Level
$268 – Sellers – 2.8:1; -25.29% From Current Price Level
$264 – Buyers – 1.89:1; -26.41% From Current Price Level
$260 – Buyers – 1.58:1; -27.52% From Current Price Level
$256 – Sellers – 1.73:1; -28.64% From Current Price Level
$252 – Buyers – 1.45:1; -29.75% From Current Price Level
$248 – Buyers – 4.5:1; -30.87% From Current Price Level
$244 – Sellers – 1.33:1; -31.98% From Current Price Level
$240 – Buyers – 1:0*; -33.1% From Current Price Level
$236 – Sellers – 2.8:0*; -34.21% From Current Price Level
$232 – NULL – 0:0*; -35.33% From Current Price Level
$228 – NULL – 0:0*; -36.44% From Current Price Level
Tying It All Together
The list & image above paint the picture as to how investors & traders have behaved at various price levels that OIH has been at over the past one-to-two years.
It is not meant to serve as investment/trading advice, and is simply a way to visualize what investor/trader sentiment has been like at each of the price levels mentioned, as well as what it was at levels of support & resistance that are denoted in the image & list.
As always, do your own due diligence before making investing/trading decisions.
For more on the methodology on how the data was collected & put together, please refer to our original Price:Volume analysis.
*** I DO NOT OWN SHARES OR OPTIONS CONTRACT POSITIONS IN OIH AT THE TIME OF PUBLISHING THIS ARTICLE ***
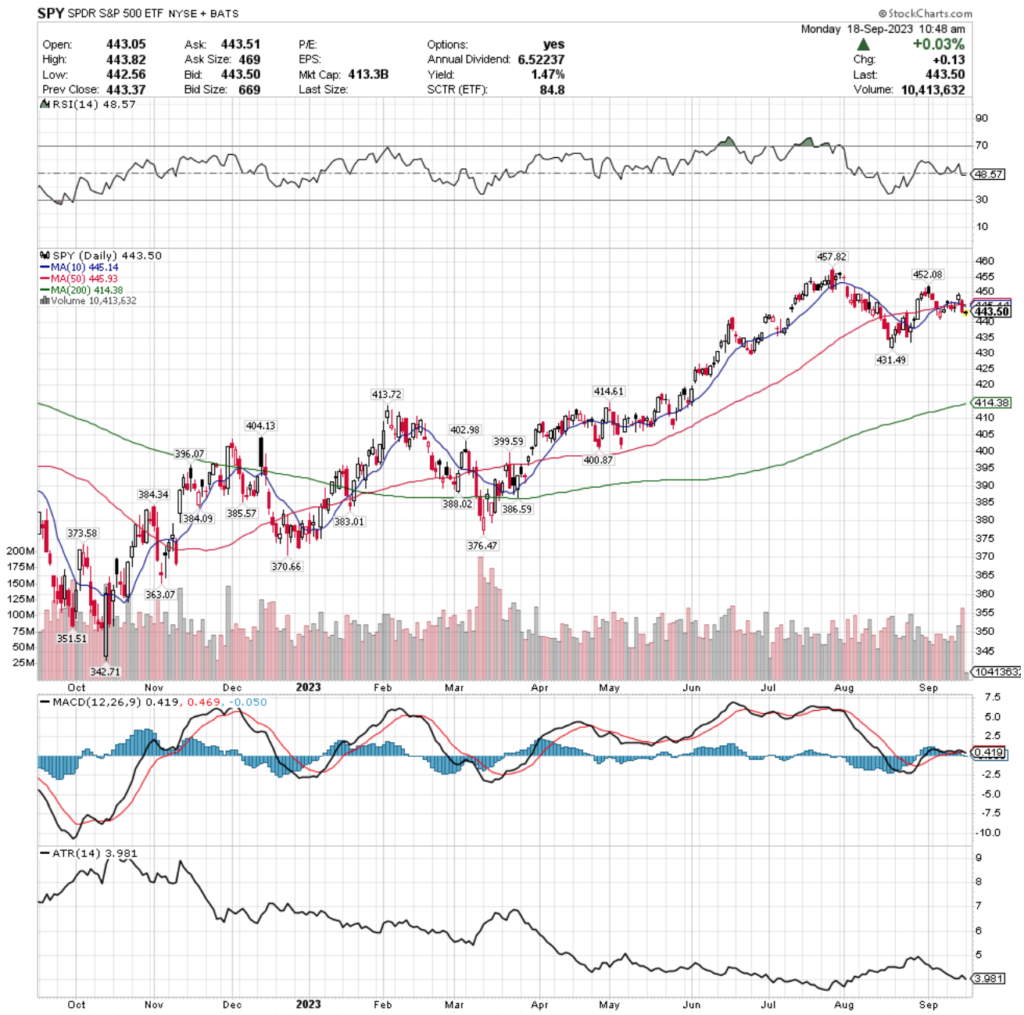
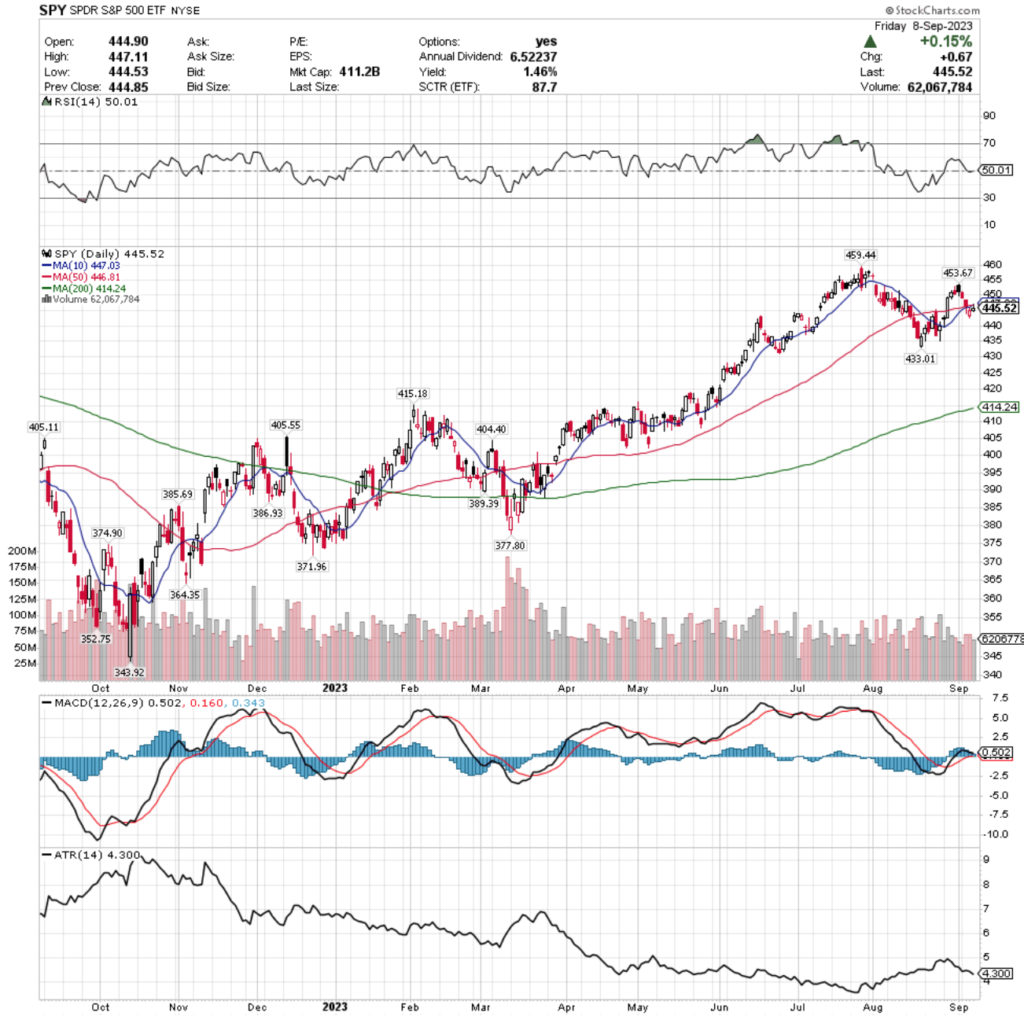
SPY ETF – SPDR S&P 500 ETF’s Technical Performance Over The Past Year
Their RSI is sitting just below the neutral mark at 48.57, with a MACD that is crossing over bearishly as we head into a new week.
Volumes were -8.8% less than average last week compared to the year prior (76,627,400 vs. 84,016,741), signaling that investors are feeling uncertain, which is confirmed by Friday’s risk off session being the week’s highest volume.
Monday’s session kicked off with a hanging man that was able to close above the support of the 10 & 50 day moving averages.
Tuesday’s candle was a bearish spinning top that was unable to stay above the 10 & 50 day moving averages, followed by a doji on Wednesday what also was not able to break that resistance.
Thursday saw a glimmer of hope with a session that jumped above the resistance levels & was able to maintain that price level into the close before everything unwound on Friday’s high volume risk off session heading into the weekend that closed below the 10 & 50 day moving average.
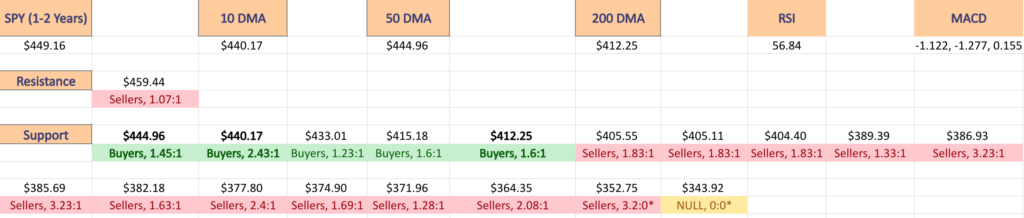
SPY has support at the $431 (Volume Sentiment: Sellers, 1.10:1), $414.61 (Volume Sentiment: Buyers, 1.6:1), $414.38 (200 Day Moving Average; Volume Sentiment: Buyers, 1.6:1) & $413.72/share (Volume Sentiment: Buyers, 1.6:1) price levels, with resistance at the $445.14 (10 Day Moving Average; Volume Sentiment: Buyers, 1.45:1), $445.93 (50 Day Moving Average; Volume Sentiment: Buyers, 1.45:1), $452.08 (Volume Sentiment: Buyers, 1.25:1) & $457.82/share (52-Week High; Volume Sentiment: Sellers, 1.07:1) price levels.
SPY ETF’s Price:Volume Sentiment Over The Pasts 1-2 Years
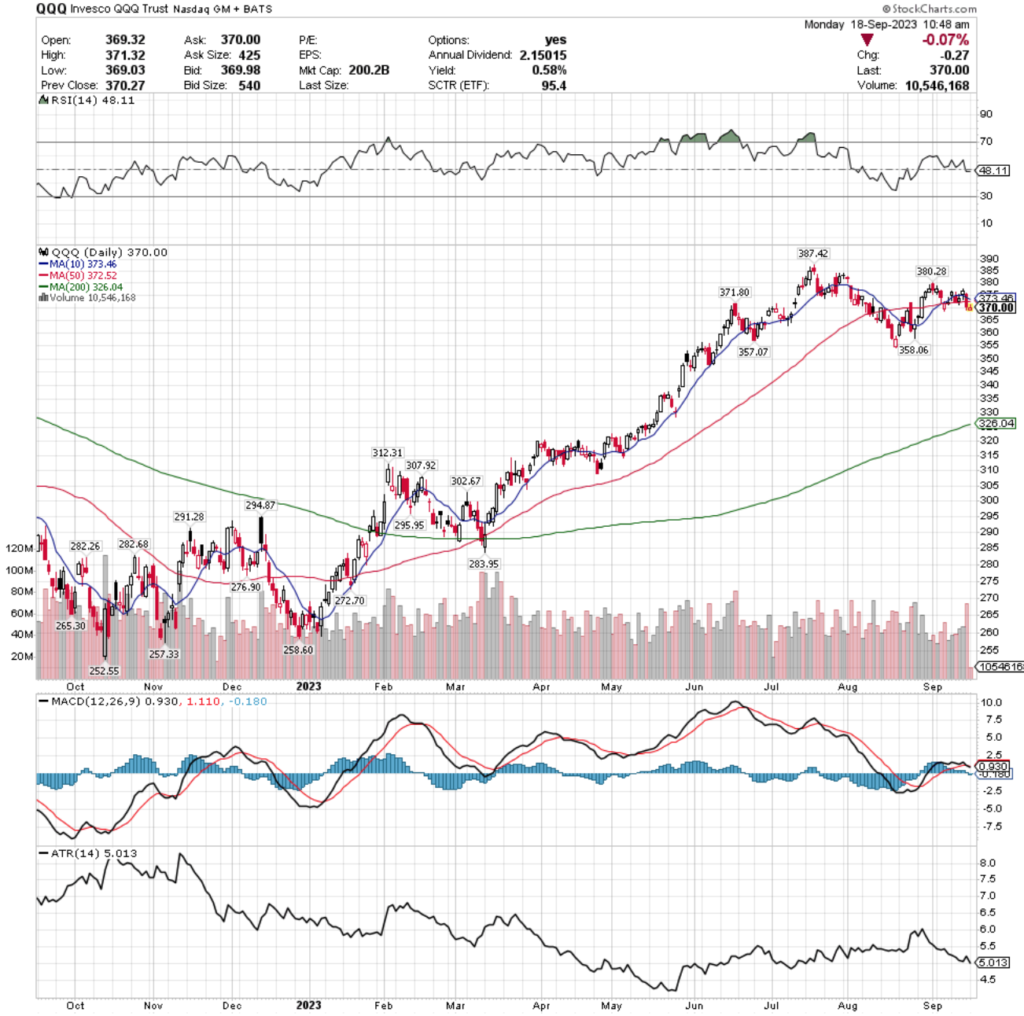
QQQ ETF – Invesco QQQ Trust ETF’s Technical Performance Over The Past Year
Their RSI is just below the neutral mark at 48.11, with a MACD that has recently crossed over bearishly.
Volumes were -11.22% below average last week vs. the year prior (49,085,080 vs. 55,285,373), which like SPY was strongest on Friday’s risk off session, indicating that investors are feeling uneasy & more risk averse in the near-term.
QQQ’s chart has a lot in common with SPY’s for last week, kicking the week off with a hanging man that was able to settle & close on the top of the 10 day moving average’s support.
Tuesday’s bearish candle’s real body was wedged in between the 10 & 50 day moving averages, with the upper shadow briefly breaking resistance but not closing above it.
Wednesday’s spinning top showed investors were getting jittery, with the candle’s body staying between the 10 & 50 day moving averages & closing atop the support of the 50 DMA.
Thursday offered a glimmer of hope blended with uncertainty, as the day’s session resulted in a spinning top that was able to break above the 10 day moving average & close above it.
That indecision resulted in a big risk off Friday, which is setting the tone for more near-term declines as investors will be watching for the 10 DMA to bearishly cross the 50 DMA in the coming days.
QQQ has support at the $358.06 (Volume Sentiment: Sellers, 2.56:1), $357.07 (Volume Sentiment: Sellers, 2.56:1), $326.04 (200 Day Moving Average; Volume Sentiment: Buyers, 2.48:1) & $312.31/share (Volume Sentiment: NULL; 0:0*) price levels, with resistance at the $371.80 (Volume Sentiment: Buyers, 8.2:1), $372.52 (50 Day Moving Average; Volume Sentiment: Sellers, 4.25:1), $373.46 (10 Day Moving Average; Volume Sentiment: Sellers, 4.25:1) & $380.28/share (Volume Sentiment: Buyers, 1.41:1) price levels.
QQQ ETF’s Price:Volume Sentiment Over The Pasts 1-2 Years
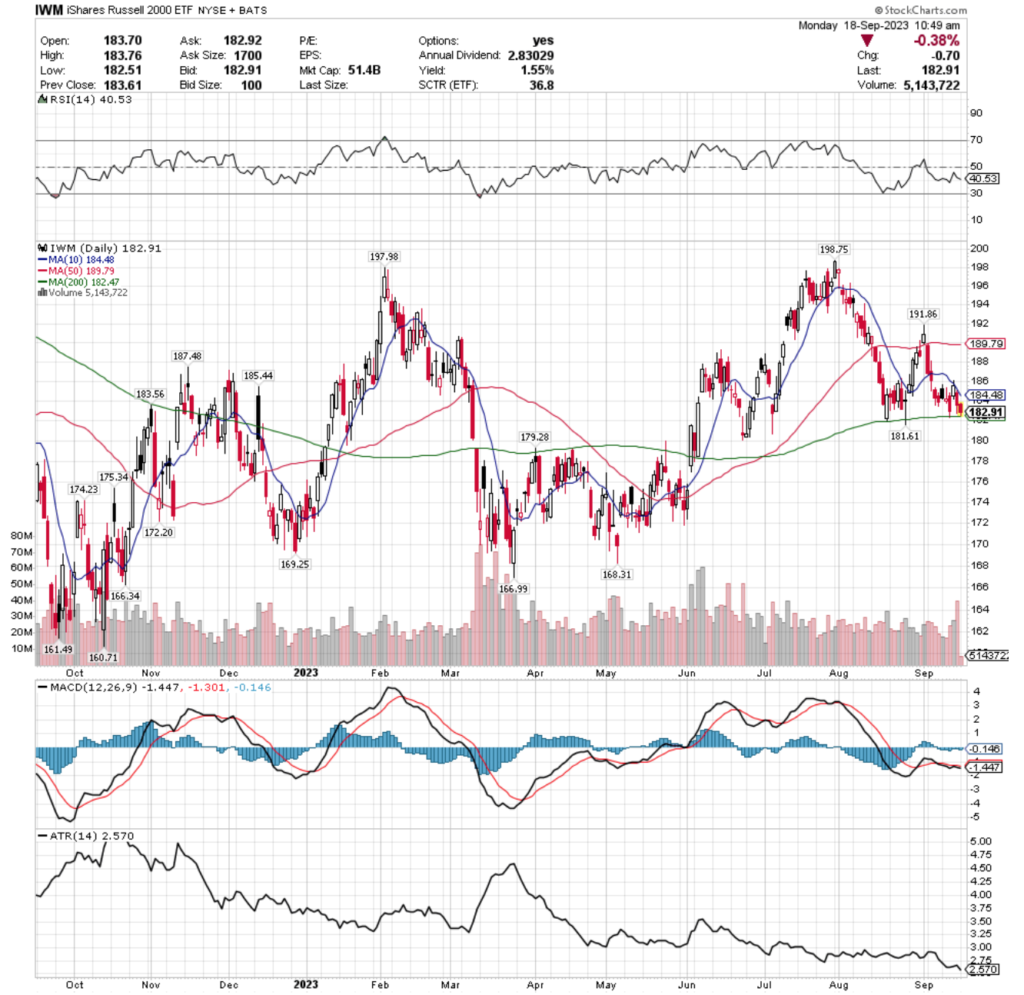
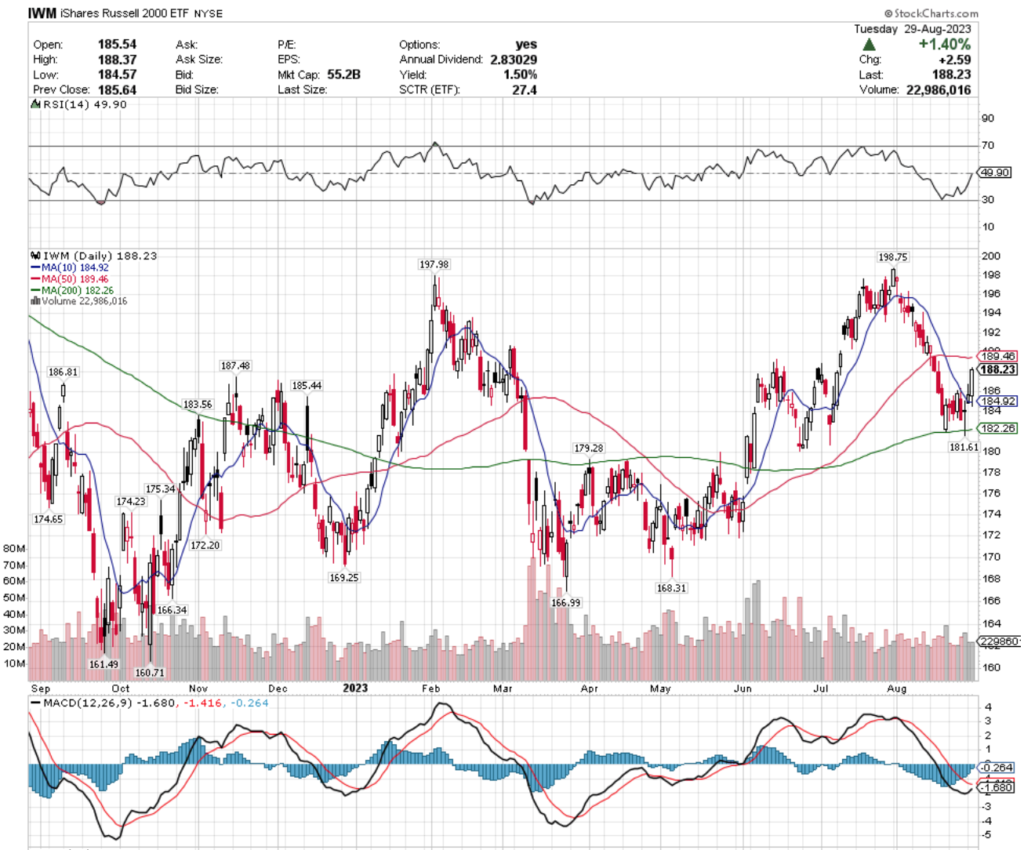
IWM ETF – iShares Russell 2000 ETF’s Technical Performance Over The Past Year
Their RSI is trending toward oversold & currently sits at 40.53 & their MACD has been bearish since the beginning of September.
Volumes fell -10.13% below the year prior’s average last week (25,259,700 vs. 28,105,603) in a sign of indecision during the week, but investors should note that Friday’s sell off into the weekend was the strongest volume session of the week, which is a warning signal.
Monday kicked off with a bullish start, however the session closed lower than it opened, which set the stage for the declines through the rest of the week.
Tuesday’s candle shows a wide range of prices were covered, but the open & close were concentrated towards the bottom of the day’s candle.
Wednesday the decline continued, but was supported by the 200 day moving average, before Thursday’s session attempted to break above the 10 day moving average’s resistance but was only able to briefly, as the close was below the 10 DMA.
Friday was a risk off session, with the 10 DMA forcing IWM lower, although the support of the 200 DMA was not broken.
As their 10 DMA approaches the 200 DMA it will be worth keeping an eye on to see if support holds up for their share price.
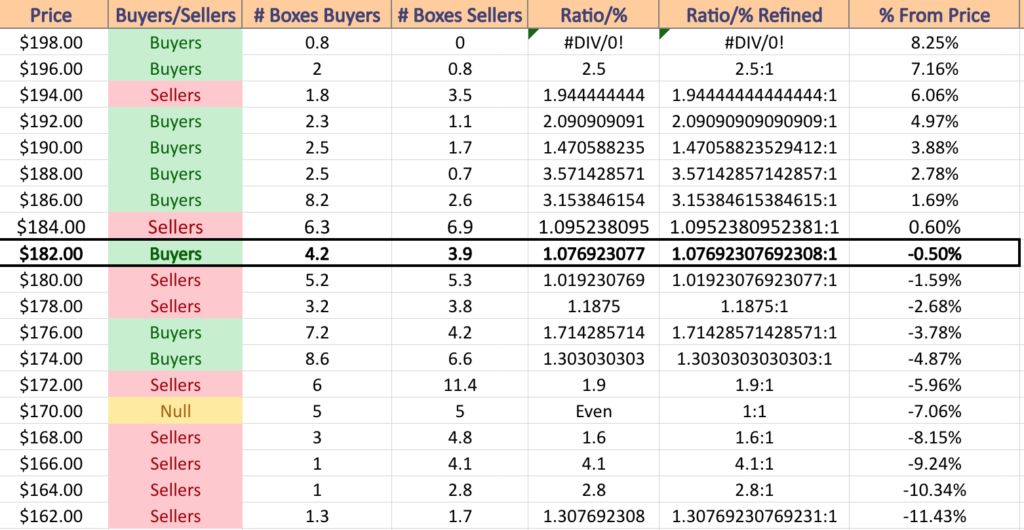
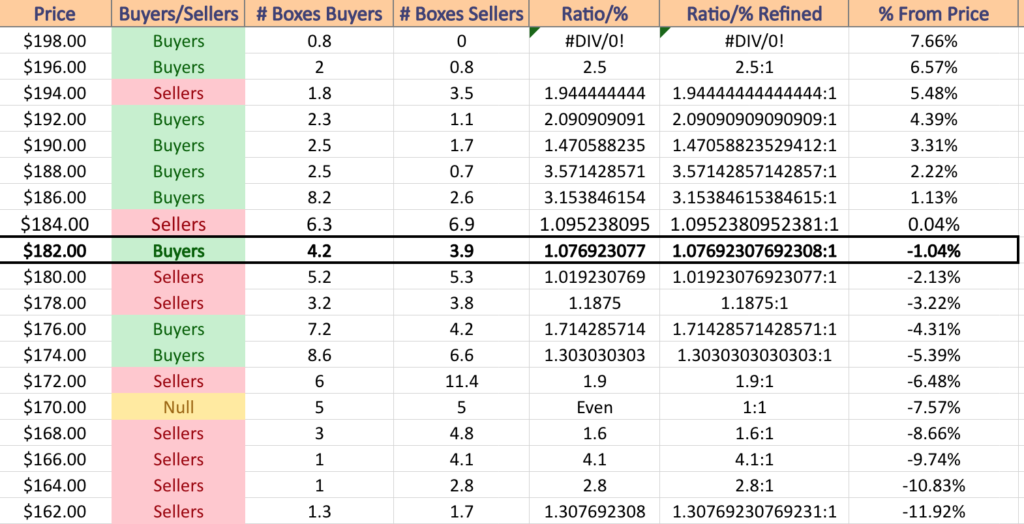
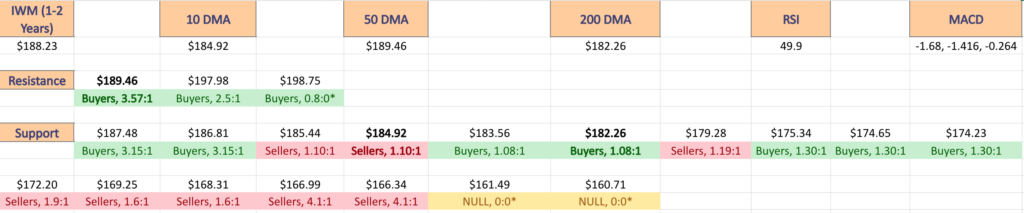
IWM has support at the $182.47 (200 Day Moving Average; Volume Sentiment: Buyers, 1.08:1), $181.61 (Volume Sentiment: Sellers, 1.02:1), $179.28 (Volume Sentiment: Sellers, 1.19:1) & $175.34/share (Volume Sentiment: Buyers, 1.3:1) price levels, with resistance at the $183.56 (Volume Sentiment: Buyers, 1.08:1), $184.48 (10 Day Moving Average; Volume Sentiment: Sellers, 1.10:1), $185.44 (Volume Sentiment: Sellers, 1.10:1) & $187.48/share (Volume Sentiment: Buyers, 3.15:1) price levels.
IWM ETF’s Price:Volume Sentiment Over The Pasts 1-2 Years
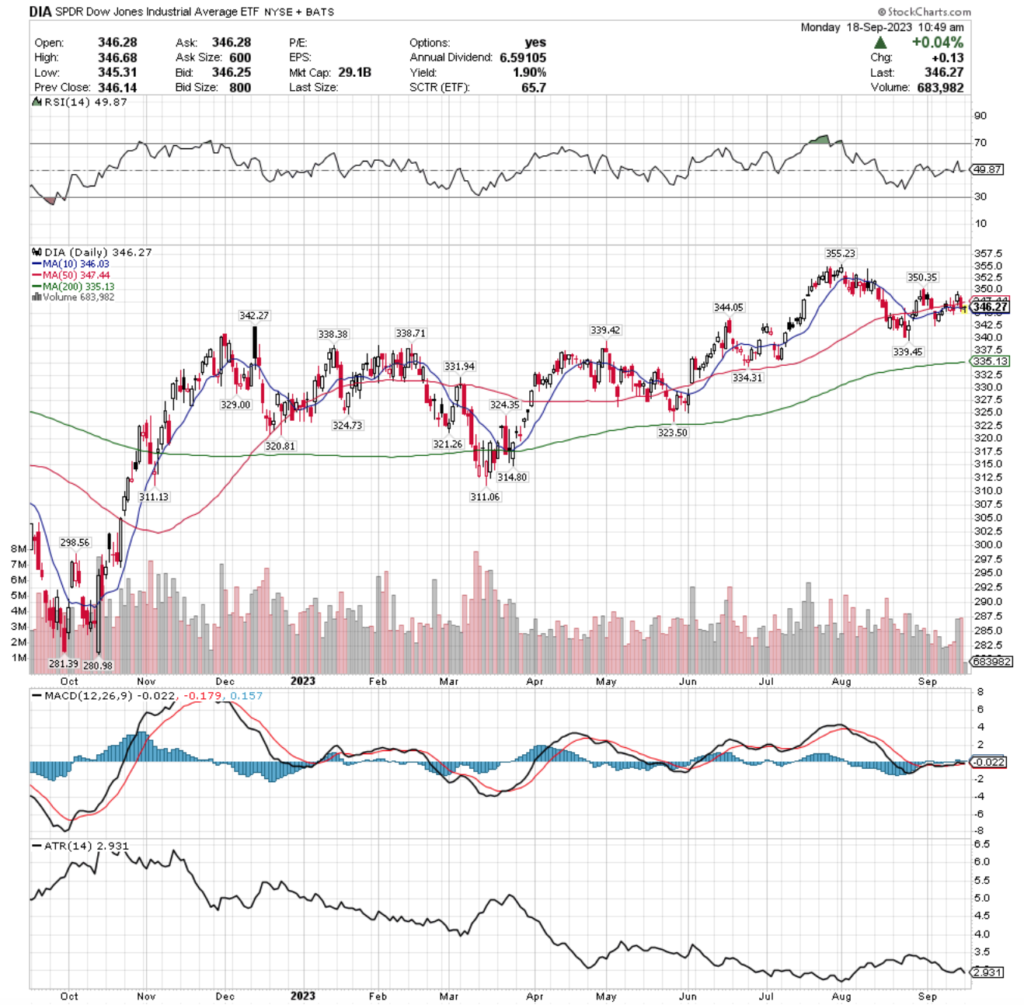
DIA ETF – SPDR Dow Jones Industrial Average ETF’s Technical Performance Over The Past Year
Their RSI is just below the neutral mark at 49.87, but their MACD is signaling a bearish crossover is on the near-term horizon.
Their volume declined -30.37% below average last week compared to the year prior (2,526,420 vs. 3,628,365) as market participants took a mostly wait & see approach to DIA, with exception to Thursday’s pump attempt to break & remain above support & Friday’s risk off profit taking that led the week in terms of highest volume sessions.
Monday’s session was a spinning top that was unable to close over the resistance of the 50 DMA, but was supported by the close by 10 DMA.
Tuesday also had a spinning top, as for a second day investors had feelings of indecision, except the support of the 10 DMA broke down.
Wednesday they attempted to break the 10 & 50 DMAs & were able to temporarily on Thursday before Friday’s session indicated that investors were feeling more risk averse heading into the weekend.
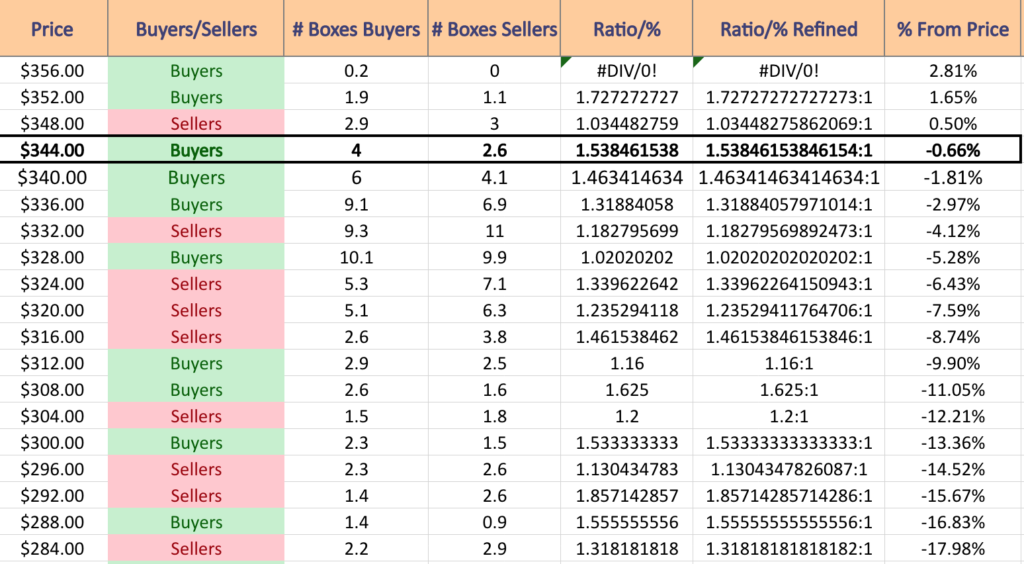
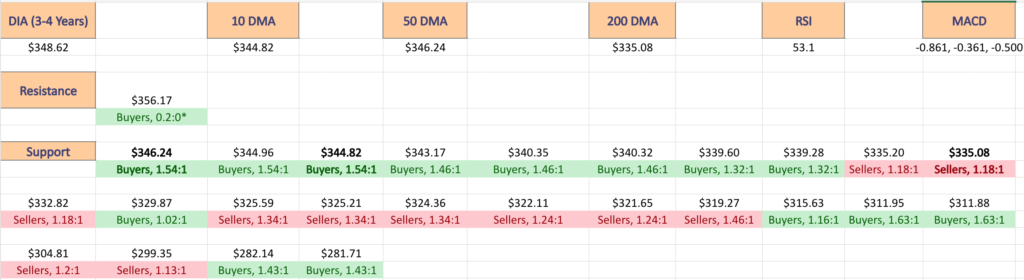
DIA has support at the $346.03 (10 Day Moving Average; Volume Sentiment: Buyers, 1.54:1), $344.05 (Volume Sentiment: Buyers, 1.54:1), $342.27 (Volume Sentiment: Buyers, 1.46:1) & $339.45/share (Volume Sentiment: Buyers, 1.32:1) price levels, with resistance at the $347.44 (50 Day Moving Average; Volume Sentiment: Buyers, 1.54:1), $350.35 (Volume Sentiment: Sellers, 1.03:1), $355.23 (52-Week High; Volume Sentiment: Buyers, 1.73:1) price levels.
DIA ETF’s Price:Volume Sentiment Over The Pasts 3-4 Years
Tying It All Together & The Week Ahead
Monday kicks off with Home Builder Confidence Index data at 10 am & Stitch Fix is scheduled to report earnings.
Housing Starts & Building Permits will be reported on Tuesday morning at 8:30 am.
Tuesday’s earnings reports include Apogee Enterprises, AutoZone, Endava & Steelcase.
The Fed Interest Rate Decision will be announced Wednesday at 2 pm, followed by Chairman Powell’s Press Conference at 2:30 pm.
FedEx reports earnings on Wednesday, as well as General Mills & KB Home.
Initial Jobless Claims, Philadelphia Fed Manufacturing Survey & U.S. Current Account Deficit data are reported at 8:30 am Thursday, followed by U.S. Leading Economic Indicators & Existing Home Sales data at 10 am.
Darden Restaurants & FactSet are due to report earnings results on Thursday.
Friday the week winds down with Fed Governor Lisa Cook speaking at 8:30 am, followed by S&P Flash U.S. Services PMI & S&P Flash U.S. Manufacturing PMI at 9:45 am & at 1pm Minneapolis Fed President Neil Kashkari & San Francisco Fed President Mary Daly are scheduled to both speak.
There are no major earnings reports scheduled for Friday.
See you back here next week!
*** I DO NOT OWN SHARES OR OPTIONS CONTRACT POSITIONS IN SPY, QQQ, IWM or DIA AT THE TIME OF PUBLISHING THIS ARTICLE ***
SPY, the SPDR S&P 500 ETF dipped -0.83% over the past week, performing better than the NASDAQ & Russell 2000, but underperforming the Dow Jones Industrial Average.
SPY ETF – SPDR S&P 500 ETF’s Technical Performance Over The Past Year
Their RSI is neutral at 50, but their MACD is beginning to crossover bearishly which will be something for investors to keep their eyes on.
SPY’s volume declined this past week -23.53% below the prior year’s average (64,484,950 vs. 84,325,501) signaling investor uncertainty & people trying to take profits off of the table after their recent run up at the end of August.
The week began on a sour note, with a new resistance level occurring at $453.67 on Monday’s session on a filled in green/black candlestick where price action favored being higher, but the lower shadow indicated there was also strong sentiment at the lower end of the day’s range.
Tuesday started the real decline, followed by a hanging man candlestick on Wednesday that dipped below the 10 & 50 day moving averages, but managed to close right at them for the day’s session.
Thursday SPY continued lower, flirting with the 10 & 50 day moving averages again on the upper shadow, but ultimately closing below them & Friday signaled further indecision with a spinning top candlestick that’s upper shadow tested but could not penetrate the 10 & 50 day moving averages & the candle’s real body was concentrated near the bottom of the day’s range.
Their Average True Range (ATR) suggests that there is more cooling off on the horizon, which should be troublesome to market participants as they are only 2.81% away from the nearest support level, which if broken leaves them exposed to further declines of up to -7% more if they test the next level of support or the closely trailing 200 day moving average.
SPY has support at the $433.01 (Volume Sentiment: Buyers, 1.23:1), $415.18 (Volume Sentiment: Buyers, 1.6:1), $414.24 (200 Day Moving Average; Volume Sentiment: Buyers, 1.6:1) & $405.55/share (Volume Sentiment: Sellers, 1.82:1) price levels, with resistance at the $446.81 (50 Day Moving Average; Volume Sentiment: Buyers, 1.45:1), $447.03 (10 Day Moving Average; Volume Sentiment: Buyers, 1.45:1), $453.67 (Volume Sentiment: Buyers, 1.25:1) & $459.44 /share (52-Week High; Volume Sentiment: Sellers, 1.07:1) price levels.
SPY ETF’s Price:Volume Sentiment Analysis Over The Past 1-2 Years
QQQ, the Invesco QQQ Trust ETF fell -1.45% over the past week, closing the week out at their 10 & 50 day moving averages.
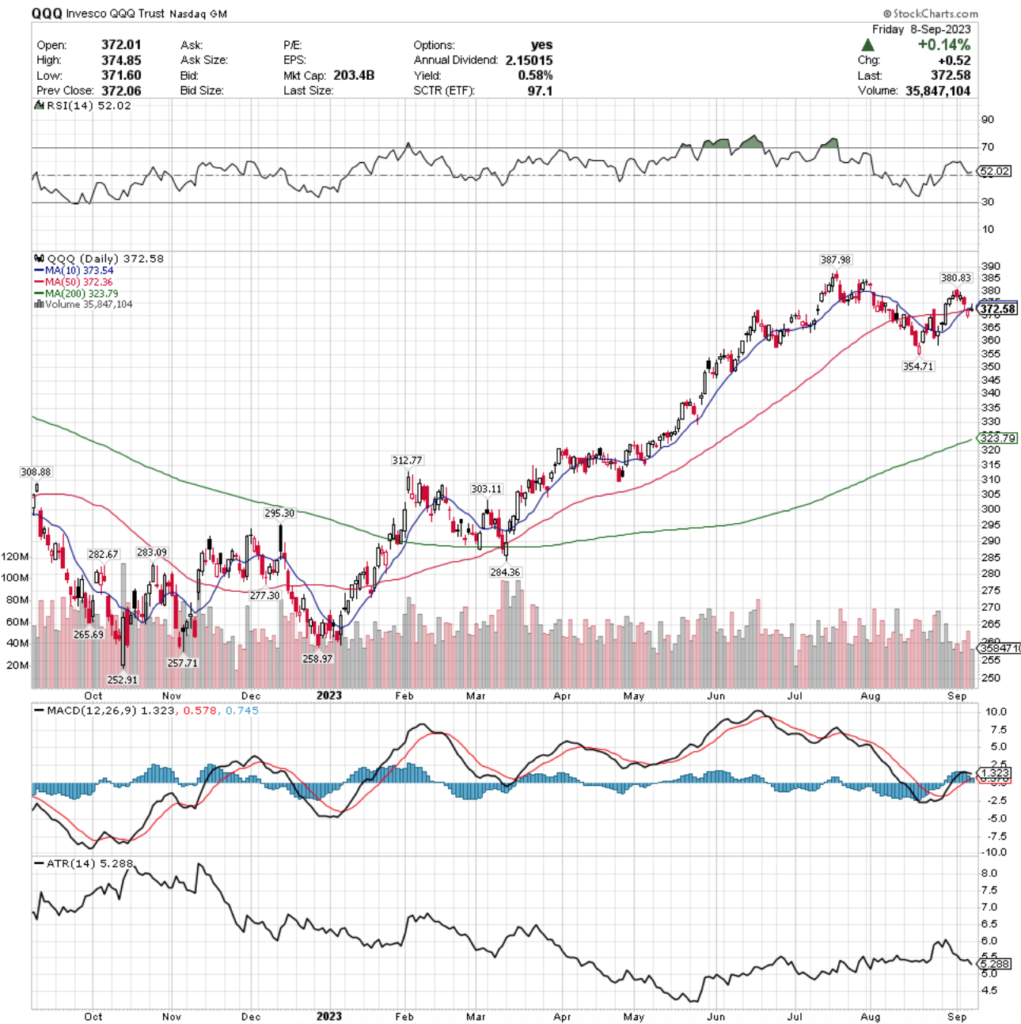
QQQ ETF – Invesco QQQ Trust ETF’s Technical Performance Over The Past Year
Their RSI is slightly above the neutral 50 mark at 52.02, with a MACD that is moving towards a bearish crossover in the coming days.
QQQ’s volume was -26.63% below average this week compared to the year prior’s average volumes (40,800,925 vs. 55,608,119), a sign of uncertainty among market participants & an effort to take some profits off of the table for protection in the near-term.
Their week kicked off similar to SPY’s, except their Monday candle was completely bearish & filled in red; Tuesday featured a spinning top of uncertainty & Wednesday featuring a hanging man candle, indicating further pain was on the near-term horizon.
While Wednesday’s session was able to find support at the area where the 10 & 50 day moving averages meet, Thursday saw them as resistance & closed below them.
Friday’s candlestick sets the tone for a grim week ahead, as it was a gravestone doji that’s upper shadow was able to get above the 10 & 50 day moving averages temporarily, the real body closed very narrowly between the 10 & 50 day moving averages, with all signals pointing bearish.
Their Average True Range also suggests that there is more of a near-term cool down period coming, which is something that investors should keep their eyes peeled to, given that the next level of support is -4.8% lower than the current price, with the following support level coming in -13.1% below the current price.
QQQ has support at the $372.36 (50 Day Moving Average; Volume Sentiment: Sellers, 4.25:1), $354.71 (Volume Sentiment: Buyers, 2.33:1), $323.79 (200 Day Moving Average; Volume Sentiment: Sellers, 1.51:1) & $312.77/share (Volume Sentiment: Sellers, 2:1) price levels, with resistance at the $373.54 (10 Day Moving Average; Volume Sentiment: Sellers, 4.25:1), $380.83 (Volume Sentiment: Buyers, 1.41:1) & $387.98/share (52-Week High; Volume Sentiment: Buyers, 1.41:1) price levels.
QQQ ETF’s Price:Volume Sentiment Analysis Over The Past 1-2 Years
IWM, the iShares Russell 2000 ETF fell -1.56% over the past week, faring the worst of the major indexes as investors became weary of small cap names.
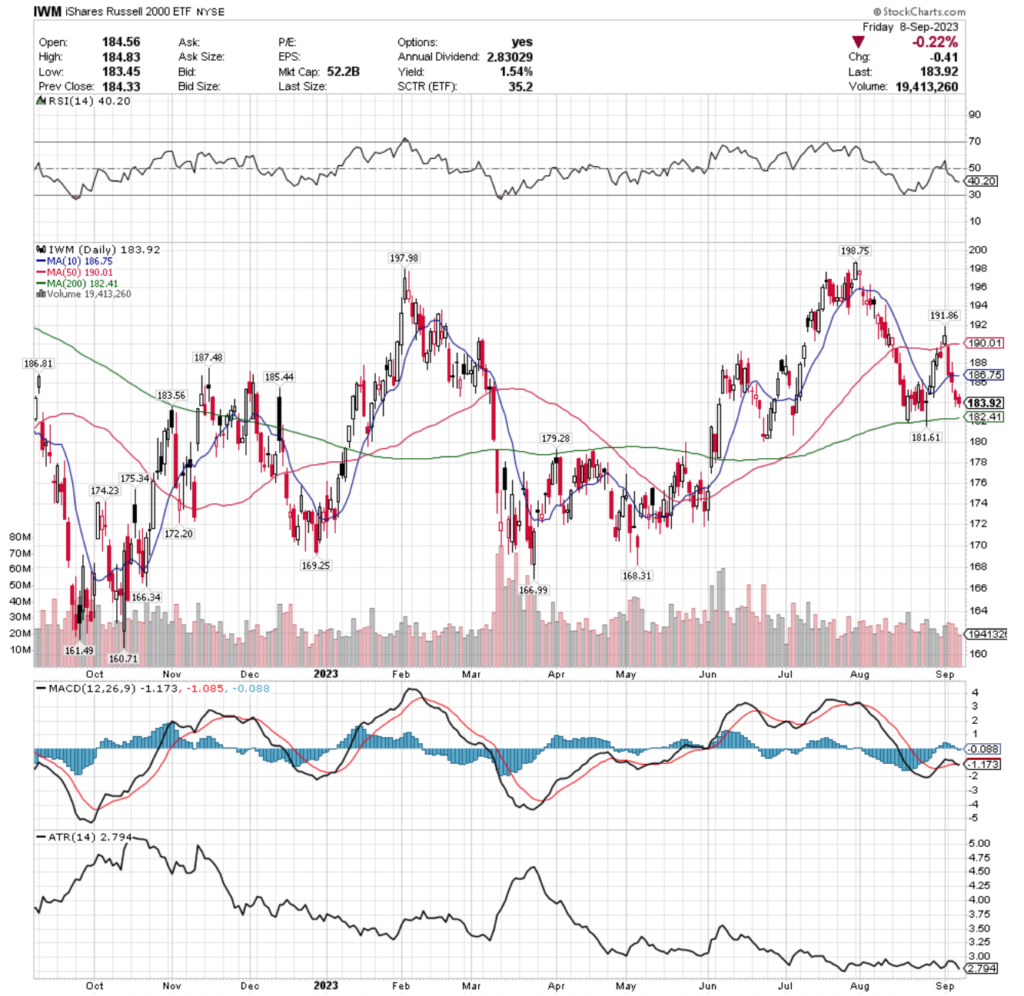
IWM ETF – iShares Russell 2000 ETF’s Technical Performance Over The Past Year
Their RSI is on the oversold end of the neutral range at 40.2, but their MACD is currently bearish following a week of declines.
IWM’s trading volume was -14.06% below average compared to the year prior (24,215,050 vs. 28,176,905), which mostly appeared to be profit-taking following their recent run up in late August.
Monday started the week establishing a new resistance level at $191.86, but most of the day’s candle is shadow above the real body, which was supported by their 50 day moving average.
Tuesday was a wide-range day whose candle sat perfectly between the 10 & 50 day moving averages, but the support of the 10 day moving average was broken Wednesday by a bearish spinning top candle, implying hesitancy & uncertainty by market participants.
Thursday & Friday were both down days, but a temporary floor seems to be building where a range may come from for this week while their oscillators return back closer to neutral.
Their ATR is signaling that a new, however temporary price range for consolidation is in order, as it is approaching the bottom of its range & continuing lower as their share price drops.
Given that IWM has traded in a much more range-bound manner than the high-flying SPY & QQQ there should are many more nearby support levels for them to rely on in the event of a decline, however, while there will be some rotation into small cap names, they will ultimately not be immune to any major losses in the S&P 500 or NASDAQ.
IWM has support at the $183.56 (Volume Sentiment: Buyers, 1.08:1), $182.41 (200 Day Moving Average; Volume Sentiment: Buyers, 1.08:1), $181.61 (Volume Sentiment: Sellers, 1.02:1) & $179.28 /share (Volume Sentimen t: Sellers, 1.19:1) price levels, with resistance at the $185.44 (Volume Sentiment: Sellers, 1.1:1), $186.75 (10 Day Moving Average; Volume Sentiment: Buyers, 3.15:1), $186.81 (Volume Sentiment: Buyers, 3.15:1) & $187.48/share (Volume Sentiment: Buyers, 3.15:1) price levels.
IWM ETF’s Price:Volume Sentiment Analysis Over The Past 1-2 Years
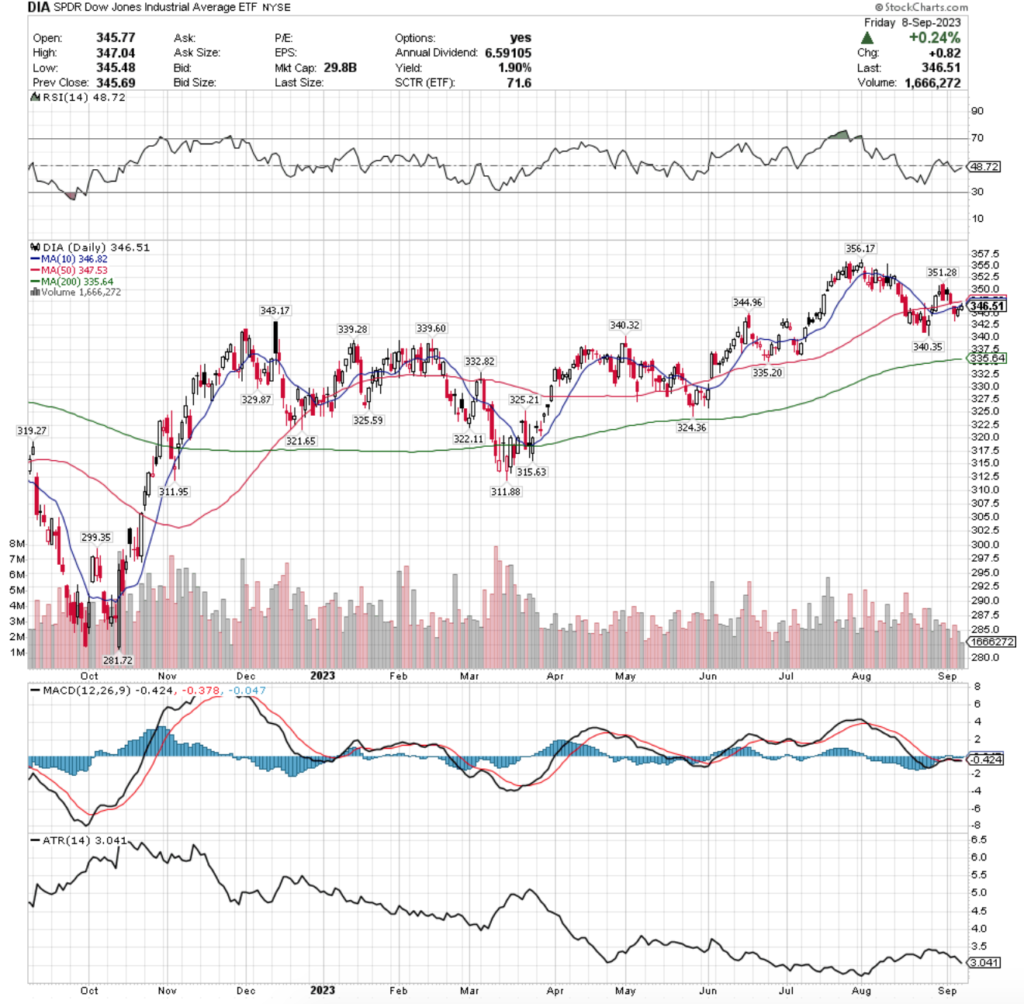
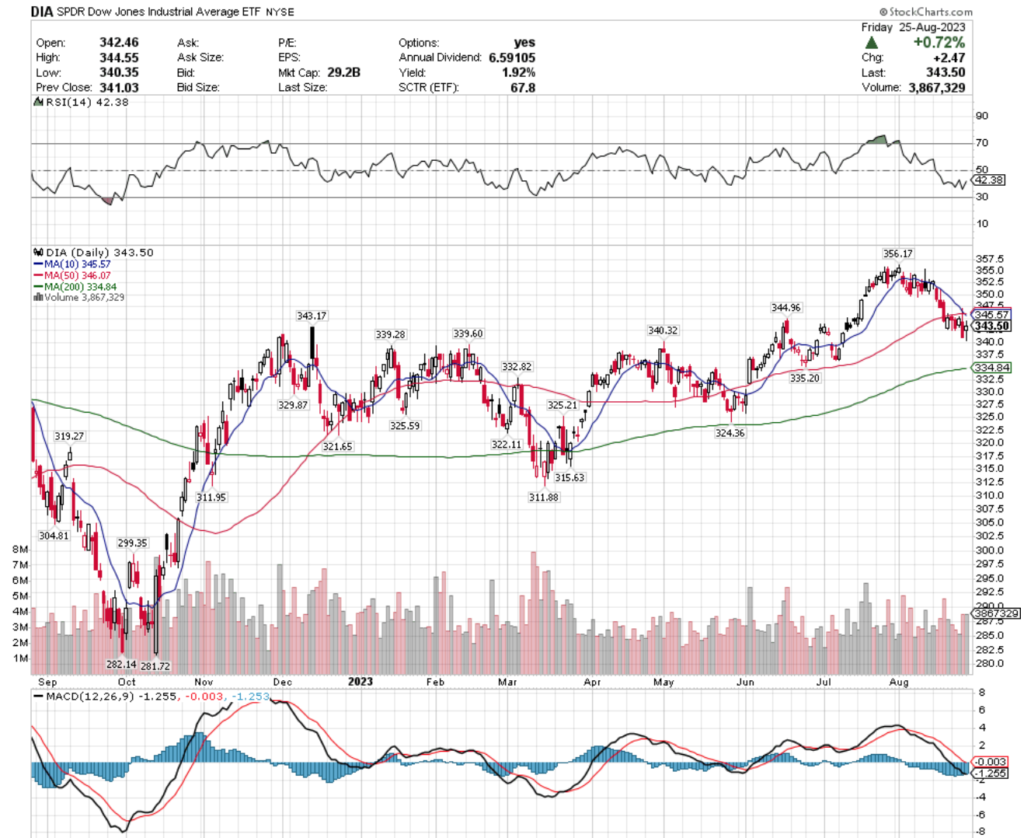
DIA ETF – SPDR Dow Jones Industrial Average ETF’s Technical Performance Over The Past Year
Their RSI is just below the neutral 50 mark at 48.72, with a MACD that is still bearish despite having been relatively flat for the past week and a half.
Volumes for DIA fell -40.27% from the year prior’s averages (2,174,950 vs. 3,641,279) signaling that investors were skittish & reluctant to be buying, but not unnerved enough to unload shares for profits.
They kicked off the week with a hanging man candle that was filled in, signaling that they opened the day higher than the day prior, but closed below the day’s opening price.
Tuesday they declined but were kept afloat by the 50 day moving average, but Wednesday produced a hammer candle following a gap down that led to a mild recovery on Thursday, with the week closing on an uncertain note with a spinning top candlestick.
Friday’s spinning top has an ominous look to it, with it being unable to break the resistance that they 10 day moving average was providing.
Much like IWM, DIA has traded in a less accelerated manner compared to SPY & QQQ, giving it much closer proximity to support levels compared to its current price.
However, note their ATR in the bottom pane of the chart trending away from their mean as the ETF advanced late in the week, which indicates that there should be a near-term shake up on the horizon.
DIA has support at the $344.96 (Volume Sentiment: Buyers, 1.54:1), $343.17 (Volume Sentiment: Buyers, 1.46:1), $340.35 (Volume Sentiment: Buyers, 1.46:1) & $340.32/share (Volume Sentiment: Buyers, 1.46:1) price levels, with resistance at the $346.82 (10 Day Moving Average; Volume Sentiment: Buyers, 1.54:1), $347.53 (50 Day Moving Average; Volume Sentiment: Buyers, 1.54:1), $351.28 (Volume Sentiment: Sellers, 1.03:1) & $356.17/share (52-Week High; Volume Sentiment: Buyers, 0.2:0*) price levels.
DIA ETF’s Price:Volume Sentiment Analysis Over The Past 3-4 Years
U.S. Oil & Gas Exploration & Production (IEO), Energy Momentum (PXI), Mega Cap Growth (MGK) & Turkey (TUR) Are All Bullishly Leading The Market
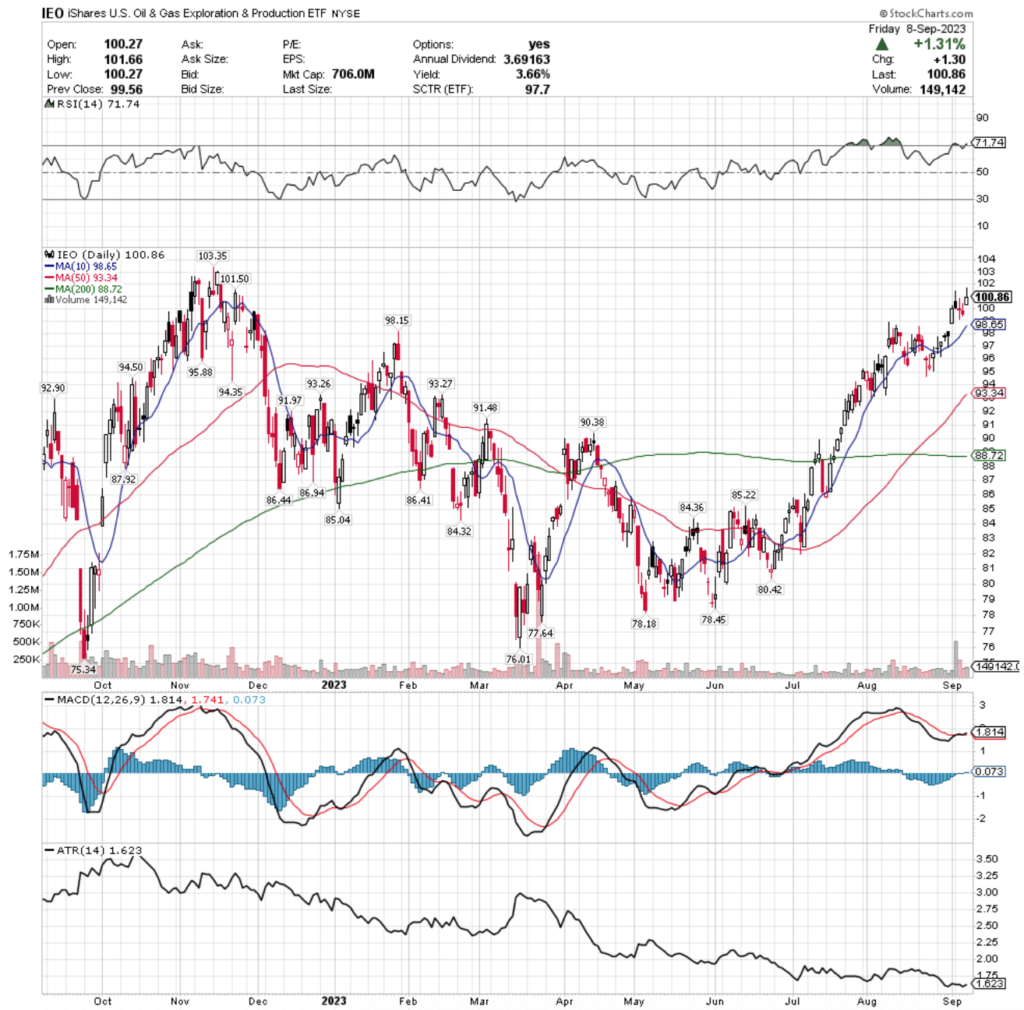
IEO ETF – iShares U.S. Oil & Gas Exploration & Production ETF’s Technical Performance Over The Past Year
Their RSI is currently overbought at 71.74, while their MACD is slightly bullish following the gap up that kicked off last week.
IEO’s trading volume this past week was +67.44% above average compared to the year prior (256,650 vs. 153,279.28), which is interesting as their gap up day was on the week’s weakest volume, Tuesday’s shooting star candle had the highest volume of the week, which has bearish implications in the near-term.
Wednesday’s bearish doji & Thursday’s bearish spinning top candle were the next highest volume days as investors took profits from the early week’s move off of the table.
Friday closed the week out with a shooting star candlestick, sending more bearish signals in the near-term.
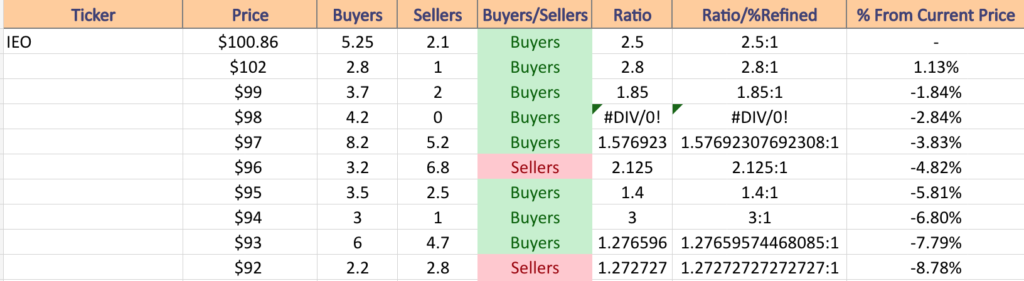
Their ATR is signaling that their price wants to remain rangebound here for a while or climb higher & the $98-98.99 support zone will be an area of interest to watch in the coming weeks.
Another thing worth noting is that there may be a bearish head & shoulders pattern emerging that began in mid-August on the final gap up that led to the consolidation range before their current price range.
This will be something for market participants to watch for & to plan appropriate hedging strategies using options, as their +3.66% distribution yield will only cover so much loss prevention for long-term shareholders, especially as if the $98 level is broken there is no support again until just below $96.
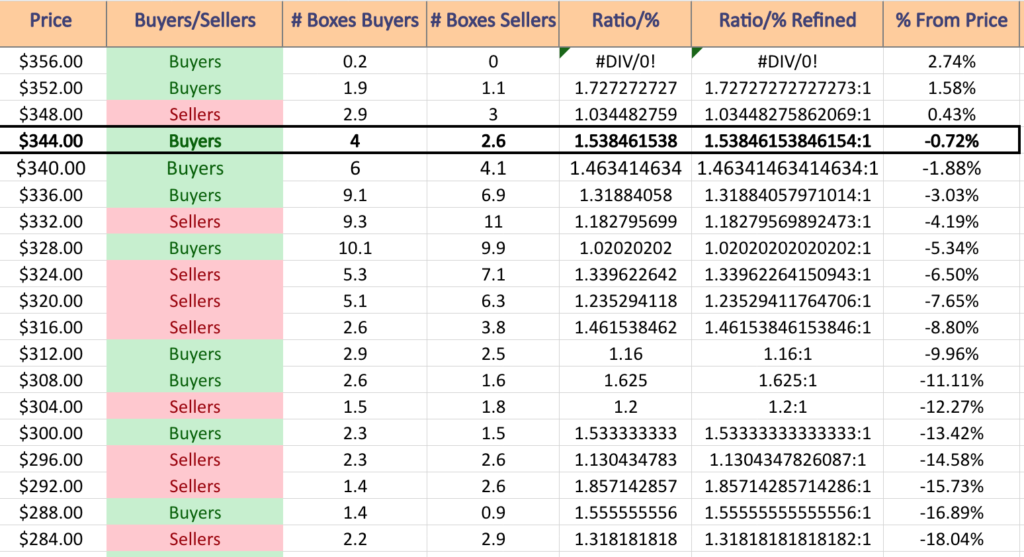
IEO has support at the $98.65 (10 Day Moving Average; Volume Sentiment: Buyers, 4.2:0*), $98.15 (Volume Sentiment: Buyers, 4.2:0*), $95.88 (Volume Sentiment: Buyers, 1.4:1) & $94.50/share (Volume Sentiment: Buyers, 3:1) price levels, with resistance at the $101.50 (Volume Sentiment: Buyers, 2.5:1) & $103.35/share (52-Week High; Volume Sentiment: Buyers, 2.8:1) price levels.
IEO ETF’s Price:Volume Sentiment Over The Past 1-2 Years
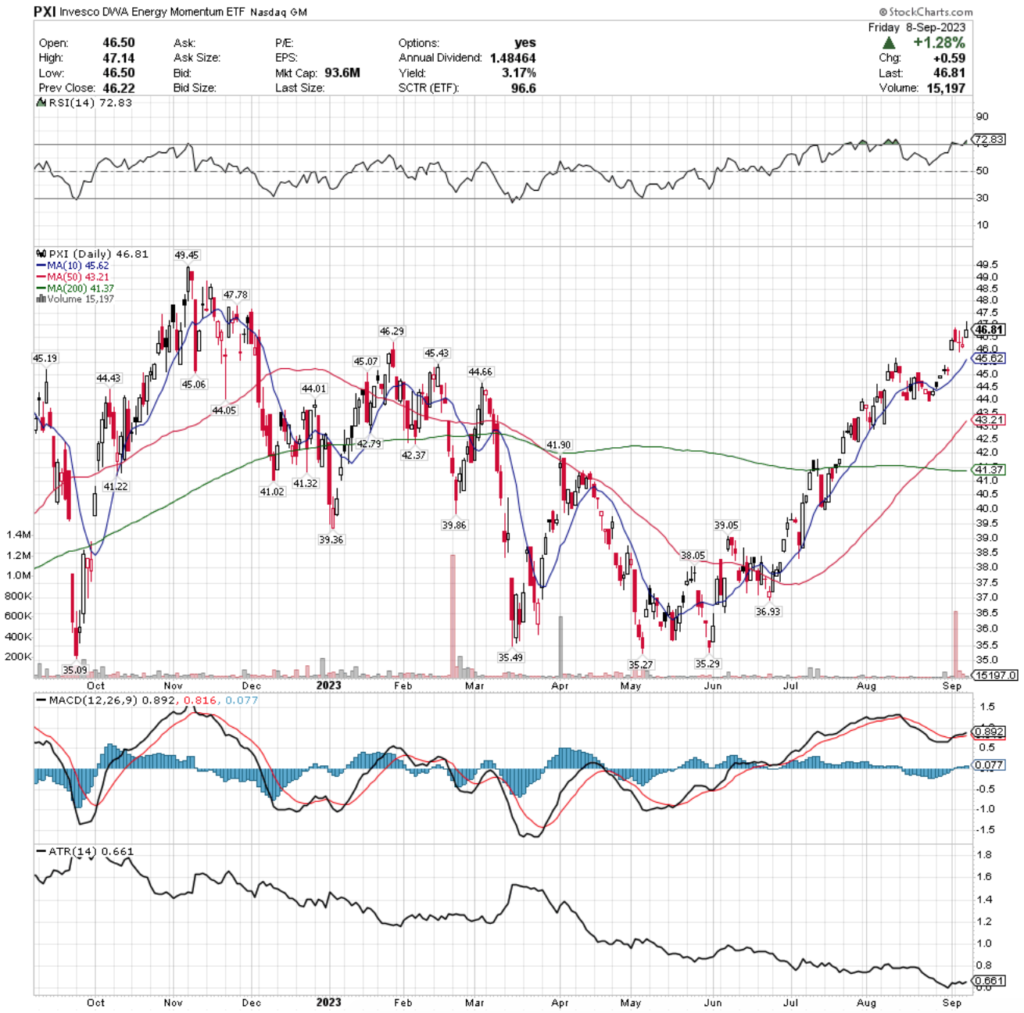
PXI ETF – Invesco DWA Energy Momentum ETF’s Technical Performance Over The Past Year
Their RSI is overbought at 72.83, but their MACD is still bullish following last Monday’s gap up session.
PXI’s volumes were +386.22% above average this past week compared to the year prior (191,850 vs. 39,457.37), which is troubling as their largest volume day was Tuesday, when shareholders took profits following their 2-3 month bull run & final gap up at a rate that eclipsed the rest of the week’s trading sessions.
Tuesday’s session covered a wide range of prices, with little upper shadow following the session’s open, with Wednesday’s session resulting in a doji, meaning more uncertainty among investors.
Thursday continued the uncertainty theme, as the day resulted in a spinning top whose real body resided near the bottom of the day’s range & Friday closed the week off on a bullish day, but in a shooting star candle, signaling that there is some volatility on the horizon.
It is worth keeping an eye on the 10 day moving average, as it is currently the first support level in the window created by last Monday’s gap & how their price behaves around it will dictate whether they consolidate from here or carry on.
With a 3.17% distribution yield there is some protection against losses, however it would be wise to look into hedging options in the near-term.
Another thing to keep an eye on is to see if a head & shoulders pattern is emerging that began in early August following their multi-month price advancement, as that would have bearish implications moving into late September & early October.
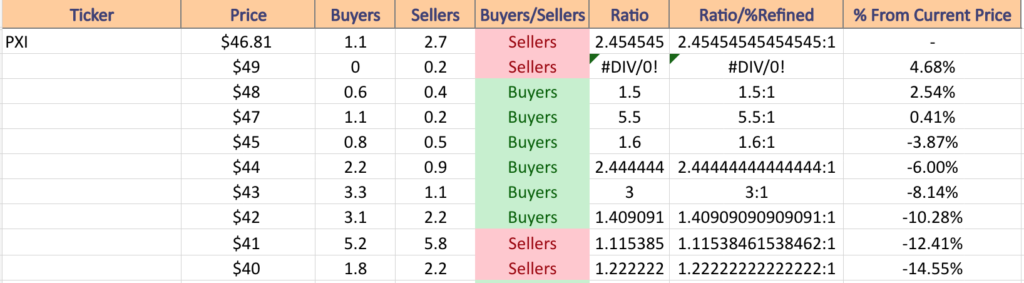
PXI has support at the $46.29 (Volume Sentiment: Sellers, 2.46:1), $45.62 (10 Day Moving Average; Volume Sentiment: Buyers, 1.6:1), $45.43 (Volume Sentiment: Buyers, 1.6:1) & $45.19/share (Volume Sentiment: Buyers, 1.6:1) price levels, with resistance at the $47.78 (Volume Sentiment: Buyers 5.5:1) & $49.45/share (52-Week High; Volume Sentiment: Sellers, 0.2:0*) price levels.
PXI ETF’s Price:Volume Sentiment Over The Past 3-4 Years
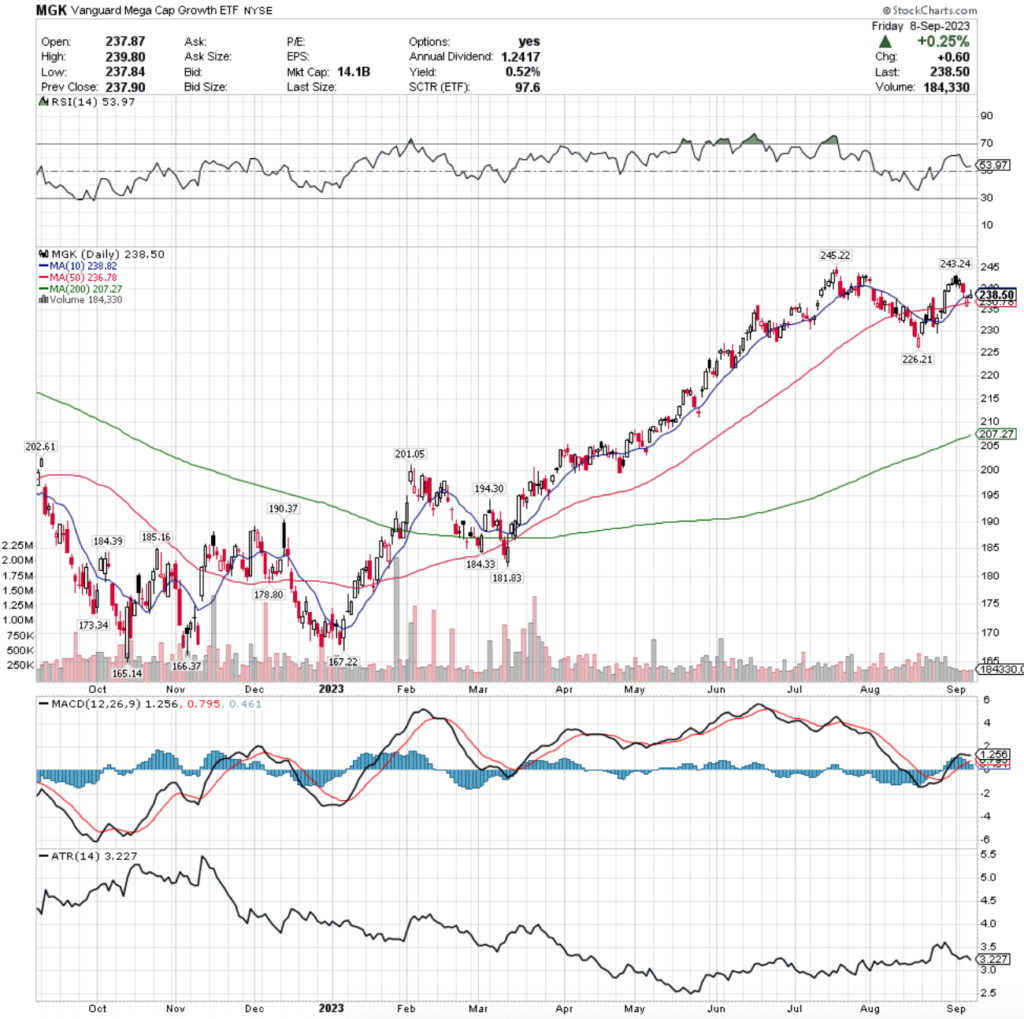
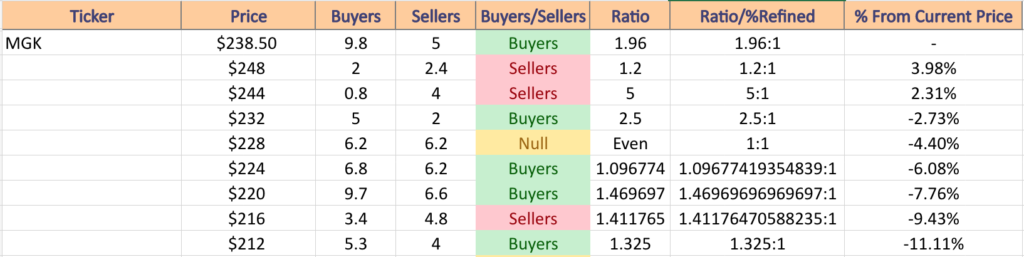
MGK, the Vanguard Mega Cap Growth ETF has gained +19.42% over the past year, including a +43.77% advance since their 52-week low in October of 2022 (ex-distributions).
MGK ETF – Vanguard Mega Cap Growth ETF’s Technical Performance Over The Past Year
Their RSI is currently sitting right above the neutral 50 mark at 53.97, with a bullish MACD that is beginning to signal a bearish crossover is imminent in the coming weeks.
Volumes fell to -50.16% of their annual average in this past week of trading for MGK (175,925 vs. 353,004.78) signaling a bout of uncertainty among market participants.
MGK’s week looked far more like what was seen earlier for SPY & QQQ, with the week kicking off on a filled in black candle, Wednesday’s session finding support from the 10 day moving average & Thursday’s session straddling the 10 & 50 day moving averages.
Friday closed in a spinning top with the real body consolidated at the bottom of the day’s price range, implying more bearishness on the horizon.
Their ATR confirms this, as on Friday’s slightly up session the ATR moved further away from their mean.
MGK has support at the $236.78 (50 Day Moving Average; Volume Sentiment: Buyers, 1.96:1), $226.21 (Volume Sentiment: Buyers, 1.1:1), $207.27 (200 Day Moving Average; Volume Sentiment: NULL, 0:0*) & $202.61/share (Volume Sentiment: NULL, 0:0*) price levels, with resistance at the $238.82 (10 Day Moving Average; Volume Sentiment: Buyers, 1.96:1), $243.24 (Volume Sentiment: NULL, 0:0*) & $245.22/share (52-Week High; Volume Sentiment: Sellers, 5:1) price levels.
MGK ETF’s Price:Volume Sentiment Over The Past 12-13 Years
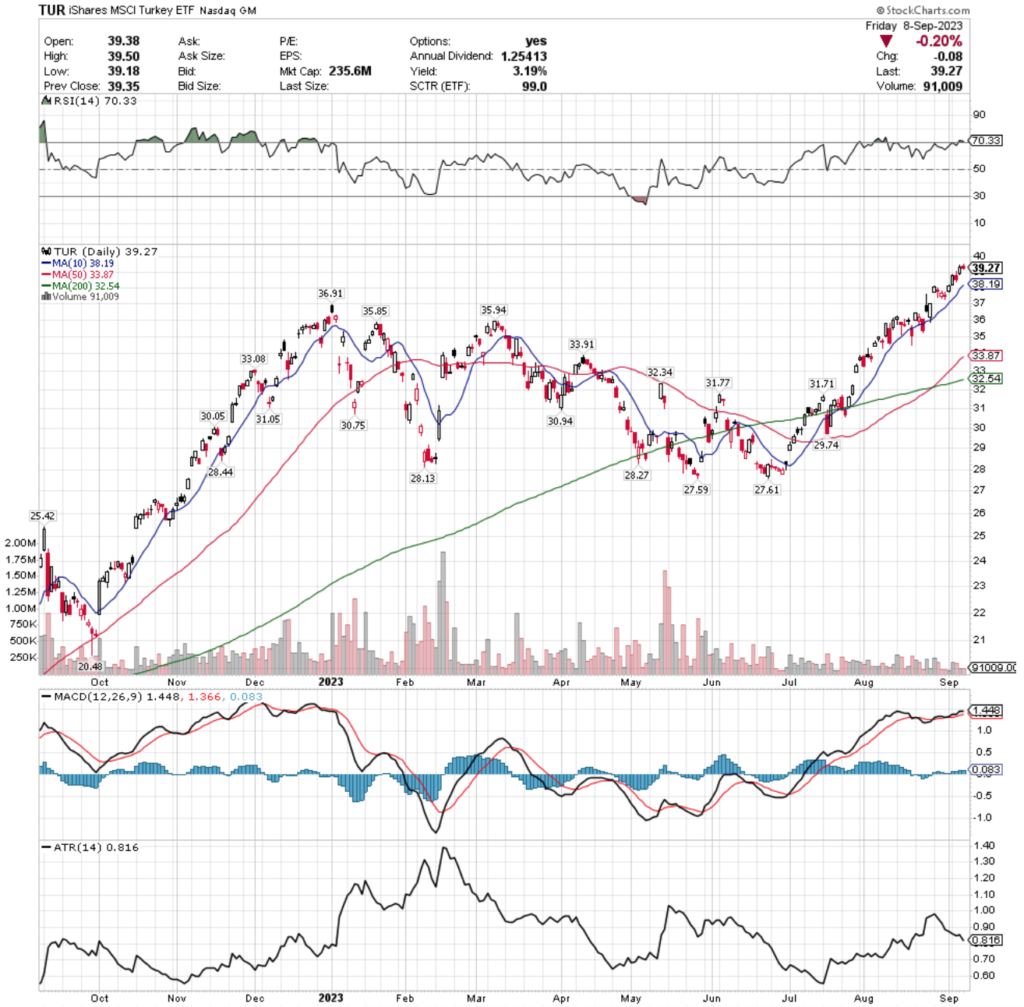
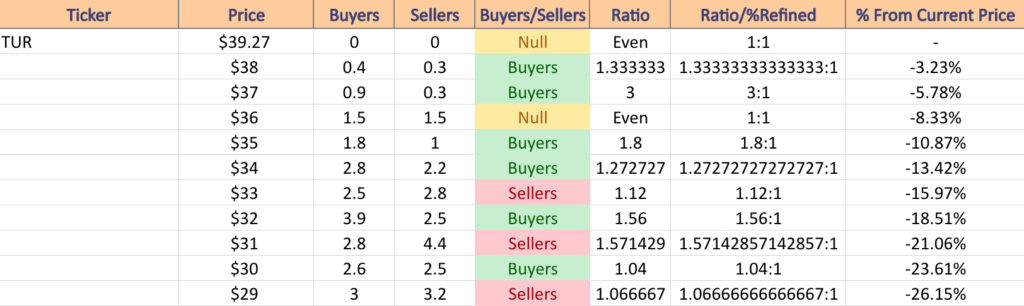
TUR, the iShares MSCI Turkey ETF has jumped +62.88% over the past year, improving +84.45% since their 52-week low in September of 2022 (ex-distributions).
TUR ETF – iShares MSCI Turkey ETF’s Technical Performance Over The Past Year
Their RSI is currently overbought at 70.33 & their MACD is bullish but beginning to show signs of a bearish crossover.
Last week’s volume was -58.24% lower than the year prior’s average volume for TUR (132,675 vs. 317,673) indicating that investors have become more cautious as they sit at an 52-week high.
Friday closed the week off with a spinning top at the 52-week high & their ATR is signaling that they are due for a cool off in the near-term.
While TUR offers a 3.19% distribution yield, it would be wise to seek hedging options in the near-term while they sit at such a high valuation compared to the year prior.
TUR has support at the $38.19 (10 Day Moving Average; Volume Sentiment: Buyers, 1.33:1), $36.91 (Volume Sentiment: Even, 1:1), $35.94 (Volume Sentiment: Buyers 1.8:1) & $35.85/share (Volume Sentiment: Buyers, 1.8:1) price levels, as it currently sits at its 52-week high.
TUR ETF’s Price:Volume Sentiment Over The Past 7-8 Years
China (YINN), Utilities (UTSL), Rare Earth/Strategic Metals (REMX) & 20+ Year Treasuries (UBT) Are All Bearishly Lagging The Market
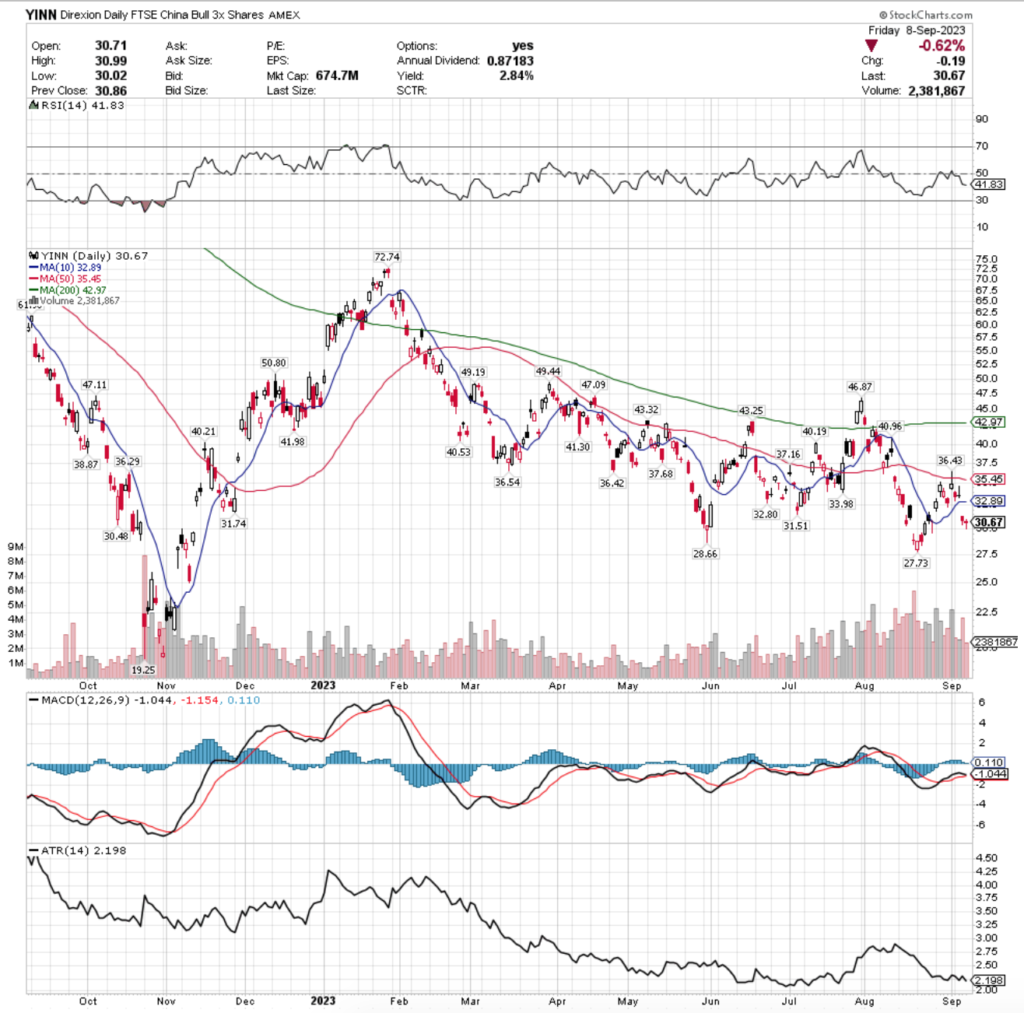
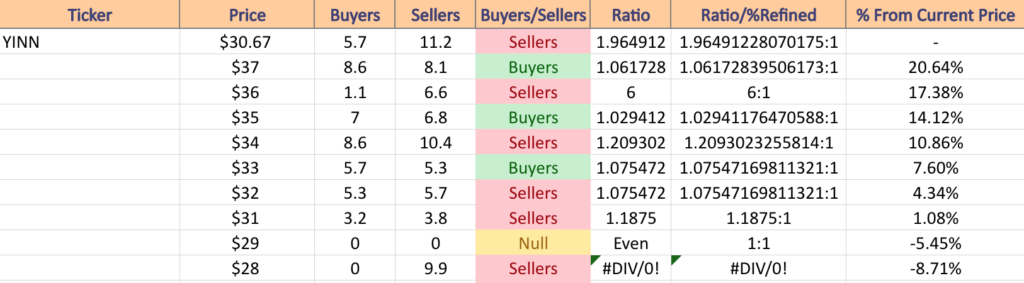
YINN, the Direxion Daily FTSE China Bull 3x Shares ETF has declined -48.49% over the past year, dropping -58.3% since their 52-week high in January of 2023, but recovering +56% since their 52-week low in October of 2022 (ex-distributions).
YINN ETF – Direxion Daily FTSE China Bull 3x Shares ETF’s Technical Performance Over The Past Year
Their RSI is on the oversold end of the neutral range at 41.83 & their MACD is about to crossover bearishly.
This past week’s average volumes increased +43.33% compared to the year prior (2,953,950 vs. 2,060,898.01) as investors were eager to join in Monday’s gap up session & just as eager to take their profits for the rest of the week.
Monday’s candle was a shooting star that could not break the resistance of the 50 day moving average, followed by another on Wednesday before Thursday gapped beneath the 10 day moving average support.
Friday’s dragonfly doji signals that there may be a consolidation range built around their current price level in the near-term.
They offer a 2.84% distribution yield which offers some cushion, but at this price level it will be worth looking to see how they behave as they encounter their support levels.
YINN has support at the $30.48 (Volume Sentiment: Sellers, 1.96:1), $28.66 (Volume Sentiment: Sellers, 9.9:0*), $27.73 (Volume Sentiment: NULL, 0:0*) & $19.25/share (Volume Sentiment: NULL, 0:0*) price levels, with resistance at the $31.51 (Volume Sentiment: Sellers, 1.19:1), $31.74 (Volume Sentiment: Sellers, 1.19:1), $32.80 (Volume Sentiment: Sellers, 1.08:1) & $32.89/share (10 Day Moving Average; Volume Sentiment: Sellers, 1.08:1) price levels.
YINN ETF’s Price:Volume Sentiment Over The Past 1-2 Years
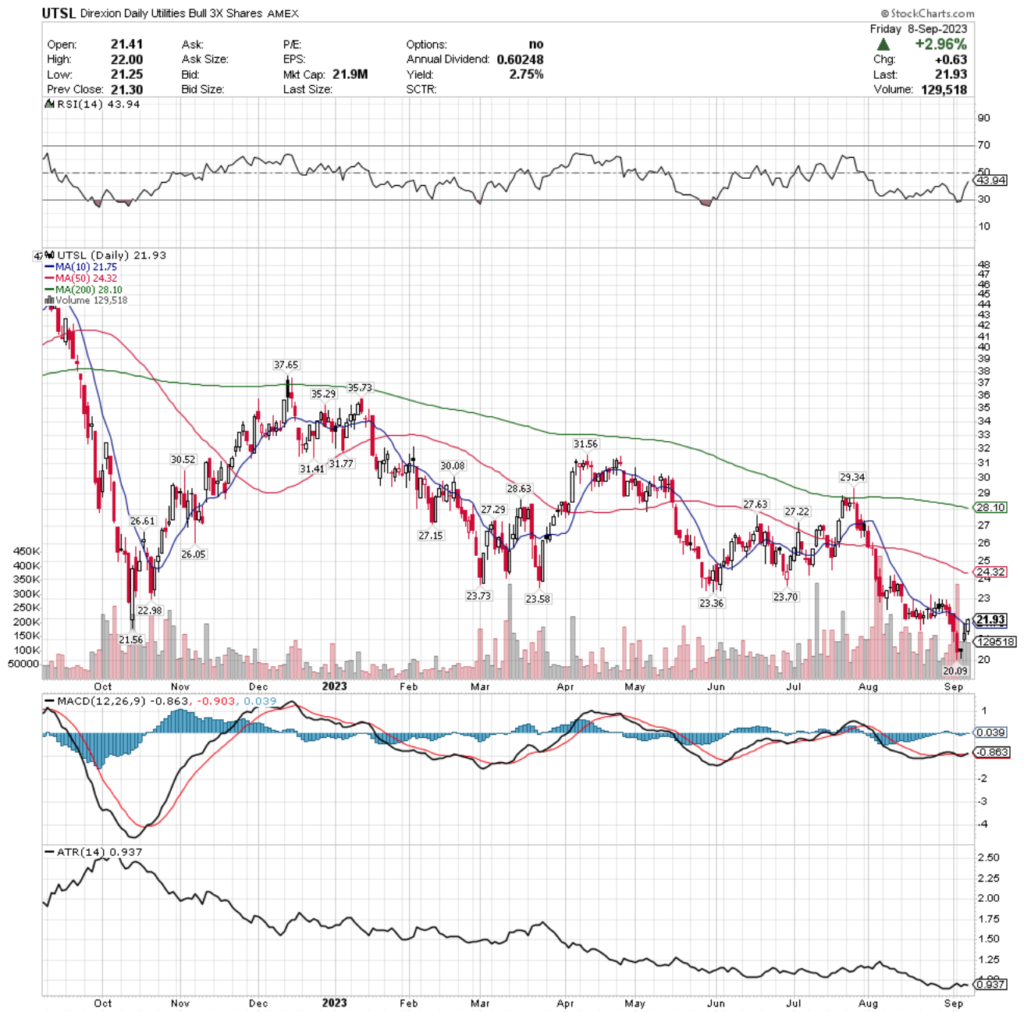
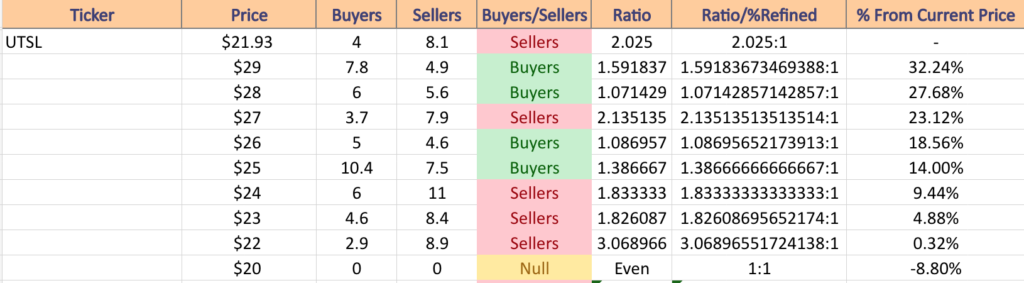
UTSL, the Direxion Daily Utilities Bull 3x Shares has fallen -52.66% over the past year, losing -54.97% since their 52-week high in September of 2022, but recovering +9.16% since their 52-week low in September of 2023 (ex-distributions).
UTSL ETF – Direxion Daily Utilities Bull 3x Shares ETF’s Technical Performance Over The Past Year
Their RSI is at 43.94 with a MACD that is trying to breakout bullishly.
Volumes were +115.01% above average compared to the year prior this past week (198,275 vs. 92,217.53) as Monday & Tuesday’s declines were violent, but investors were eager to buy back in on Wednesday, Thursday & Friday after they reached a new 52-week low.
The 10 day moving average will be an interesting area to keep an eye on in the coming week, to see whether it becomes support & leads them on a bullish run or if it remains resistance & makes UTSL retest their 52-week low.
Their ATR is implying that they may form a consolidation range around current price levels, but with only a 2.75% distribution yield it there is limited protection against additional losses if positions are entered before the range has become more sturdy.
UTSL has support at the $21.75 (10 Day Moving Average; Volume Sentiment: Sellers, 2.03:1), $21.56 (Volume Sentiment: Sellers, 2.03:1) & $20.09/share (Volume Sentiment: NULL, 0:0*) price levels, with resistance at the $22.98 (Volume Sentiment: Sellers, 3.07:1), $23.36 (Volume Sentiment: Sellers, 1.83:1), $23.58 (Volume Sentiment: Sellers, 1.83:1) & $23.70/share (Volume Sentiment: Sellers, 1.83:1) price levels.
UTSL ETF’s Price:Volume Sentiment Over The Past 2-3 Years
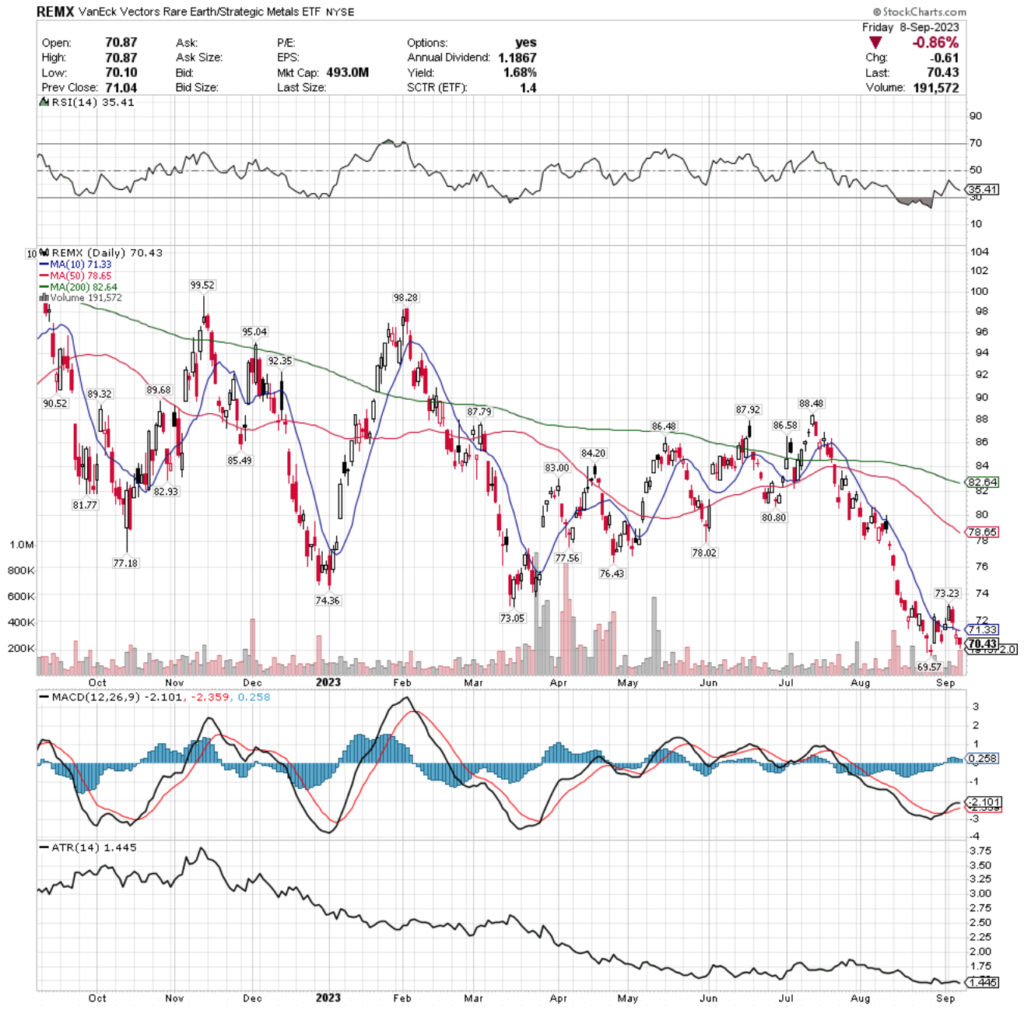
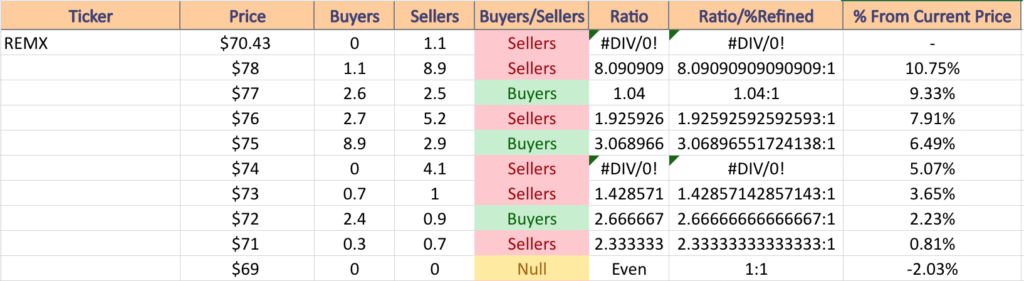
REMX, the VanEck Vectors Rare Earth/Strategic Metals ETF has shed -30.97% over the past year, declining -32.36% from their 52-week high in September of 2022, but has inched forward +1.24% since their 52-week low in August of 2023 (ex-distributions).
REMX ETF – VanEck Vectors Rare Earth/Strategic Metals ETF’s Technical Performance Over The Past Year
Their RSI is approaching oversold levels & currently sits at 35.41, as their MACD begins to curl over indicating a bearish crossover is on the horizon.
Last week’s volumes were -15.49% below average compared to the year prior (104,975 vs. 124,220.32) as investors mostly sat on the fence while the share price fluttered near its 52-week low from the end of August.
Friday was a major risk off day in terms of volume compared to the rest of the week, and the candle’s real body is a bit too large to be a hanging man, but it looks ready to set the tone for more declines going into this week.
With a modest 1.68% distribution yield, a wait & see approach would be better than following their ATR back to the mean assuming that they begin some form of rally, as there is limited support here & it is the 52-week low.
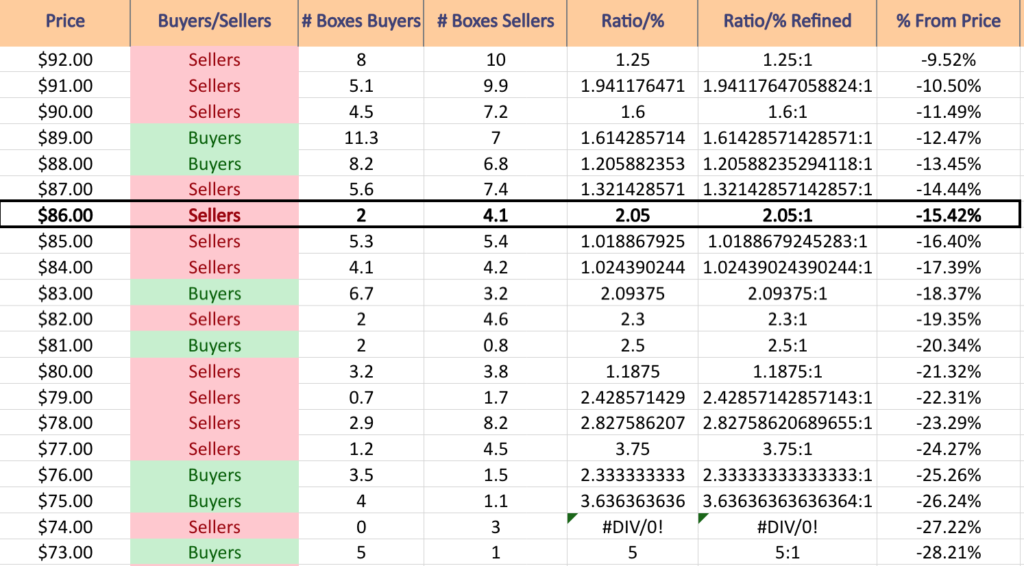
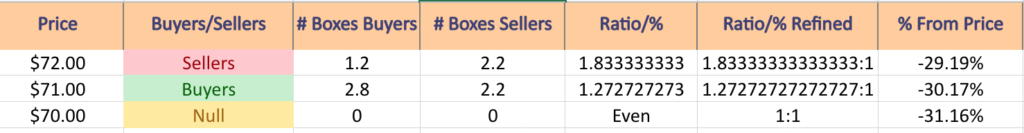
REMX has support at the $69.57 (52-Week Low; Volume Sentiment: NULL, 0:0*), with resistance at the $71.33 (10 Day Moving Average; Volume Sentiment: Sellers, 2.33:1), $73.05 (Volume Sentiment: Sellers, 1.43:1), $73.23 (Volume Sentiment: Sellers, 1.43:1) & $74.36/share (Volume Sentiment: Sellers, 4.1:0*) price levels.
REMX ETF’s Price:Volume Sentiment Over The Past 1-2 Years
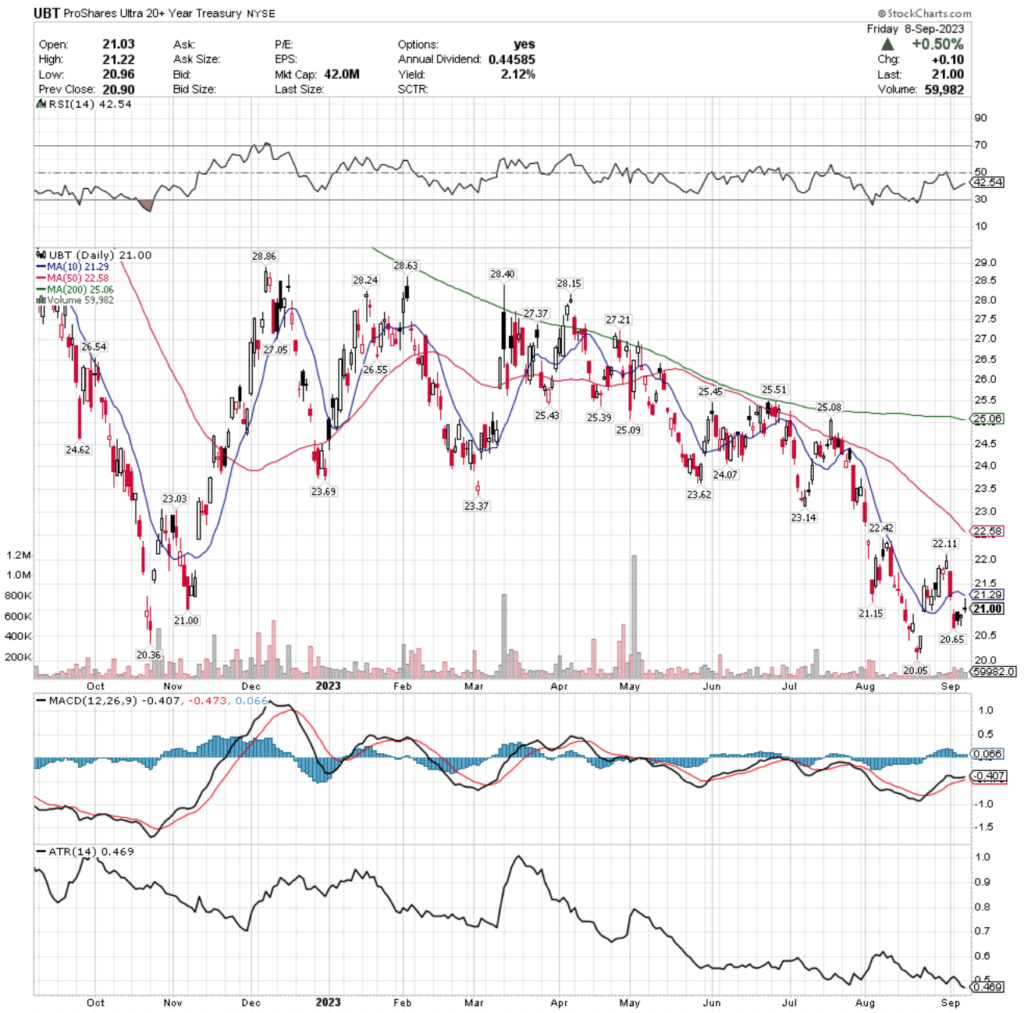
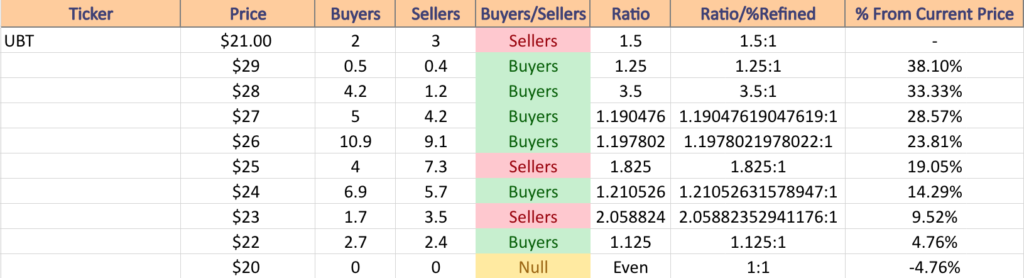
UBT, the ProShares Ultra 20+ Year Treasury ETF has lost -26.34% over the past year, falling -28.44% since their 52-week high in December of 2022, while reclaiming +4.79% since their 52-week low in October of 2022 (ex-distributions).
UBT ETF – ProShares Ultra 20+ Year Treasury ETF’s Technical Performance Over The Past Year
Their RSI is reverting back to neutral & sits at 42.54 with a MACD that is still bullish, but losing steam & looking ready to cross over bearishly.
Volumes last week were -46.02% below average compared to the year prior (52,000 vs. 96,649.8) as investors took a wait & see approach after Tuesday’s gap down below the ten day moving average put them within a few percent of their 52-week low.
Friday closed the week out with a gravestone doji that occurred on a gap up, following Thursday’s hanging man candle that completed a harami pattern with Wednesday’s candle, which indicates there is more bearish sentiment on the horizon.
Coupled with their ATR moving away from the mean over the last 3 days of last week which were advancing days & the fact that the 52-week low is so close by, there appears to be better entries on the horizon after they cool off more, or establish more support & a trading range around these levels.
As their distribution yield is only 2.12%, there is not much in the form of protection against further losses from these price levels.
UBT has support at the $21 (Current Price & Additional Support Touch-Point; Volume Sentiment: Sellers, 1.5:1), $20.65 (Volume Sentiment: NULL, 0:0*), $20.36 (Volume Sentiment: NULL, 0:0*) & $20.05/share (Volume Sentiment: NULL, 0:0*) price levels, with resistance at the $21.15 (Volume Sentiment: Sellers, 1.5:1), $21.29 (10 Day Moving Average; Volume Sentiment: Sellers, 1.5:1), $22.11 (Volume Sentiment: Buyers, 1.13:1) & $22.42/share (Volume Sentiment: Buyers, 1.13:1) price levels.
UBT ETF’s Price:Volume Sentiment Over The Past 3-4 Years
The Week Ahead
Monday starts off on a quiet note in terms of economic data, with nothing set to be reported.
Oracle is scheduled to report earnings results on Monday, along with Casey’s General & FuelCell Energy.
Tuesday features the NFIB Optimism Index data being reported at 6 am with a slow day on the earnings report front.
Consumer Price Index, Core CPI, CPI (Year-over-Year) & Core CPI (Year-over-Year) are all set to be reported on Wednesday morning at 8:30 am.
Cracker Barrel Old Country Store & REV Group are scheduled to report earnings on Wednesday.
Initial Jobless Claims, Producer Price Index, Core PPI, PPI (Year-over-Year), Core PPI (Year-over-Year), U.S. Retail Sales & Retail Sales minus Autos are scheduled to be reported on Thursday at 8:30 am, followed by Business Inventories numbers at 10 am.
Thursday’s earnings reports include Adobe, Korn/Ferry & Lennar.
Friday kicks off with U.S. Import Prices & Empire State Manufacturing Survey data at 8:30 am, followed by Industrial Production & Capacity Utilization data at 9:15 am & the week closes out on the data-front with Consumer Sentiment (preliminary) data at 10 am with no earnings reports of note scheduled.
See you back here next week!
*** I DO NOT OWN SHARES OR OPTIONS CONTRACT POSITIONS IN SPY, QQQ, IWM, DIA, IEO, PXI, MGK, TUR, YINN, UTSL, REMX, or UBT AT THE TIME OF PUBLISHING THIS ARTICLE ***
Major indexes in the stock market are all quietly retreating from 52-week highs as investors take their profits, earnings reports continue to come in & people prepare for the month of September, which tends to be a bad month for stocks.
Given how stretched out support levels are for the S&P 500 (SPY) & NASDAQ (QQQ) & how consolidated the price levels of the Russell 2000 (IWM) & Dow Jones Industrial Average (DIA) are, it’s important to have an understanding of volume sentiment at the various price levels each index has been at in recent history.
This way, it is easier to understand how market participants will behave when each index approaches price levels that are support or resistance.
In the case of SPY & QQQ it is even more essential, as with so much space between support levels there is a lot of room for error.
The article below gives a brief technical analysis breakdown for SPY, QQQ, IWM & DIA, as well as lists out their volumes at each price level that they have traded at in recent history, noting the ratio of buyers:sellers (or sellers:buyers).
There is also a chart that displays the candlesticks & some technical indicators for the time period that each ETF’s prices:volumes cover.
On the images of the table, the current price level will be in BOLD & its cells will have bold edges.
In the list that accompanies them the current support & resistance levels will be in BOLD & the current price level, 10, 50 & 200 Day Moving Averages will also be denoted.
This is not trading advice, but is meant to serve as an additional tool that may help you navigate the future market environment.
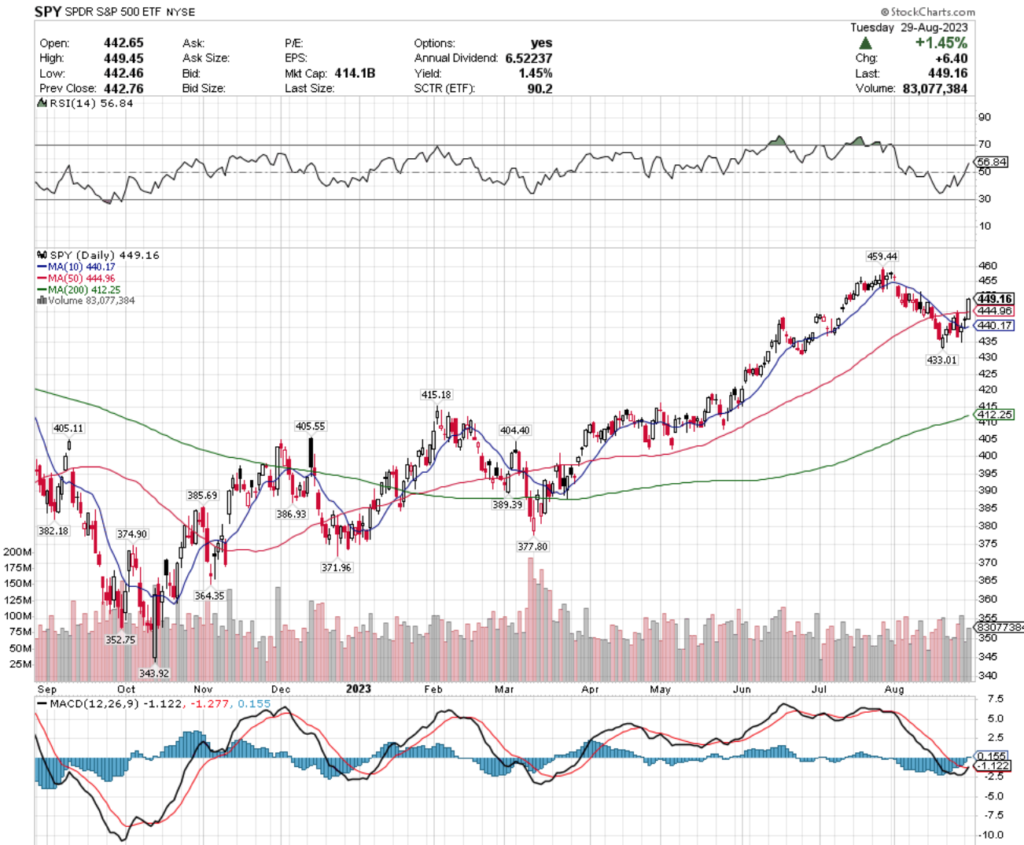
Technical Analysis & Price:Volume Sentiment Analysis Of The S&P 500 (SPY)
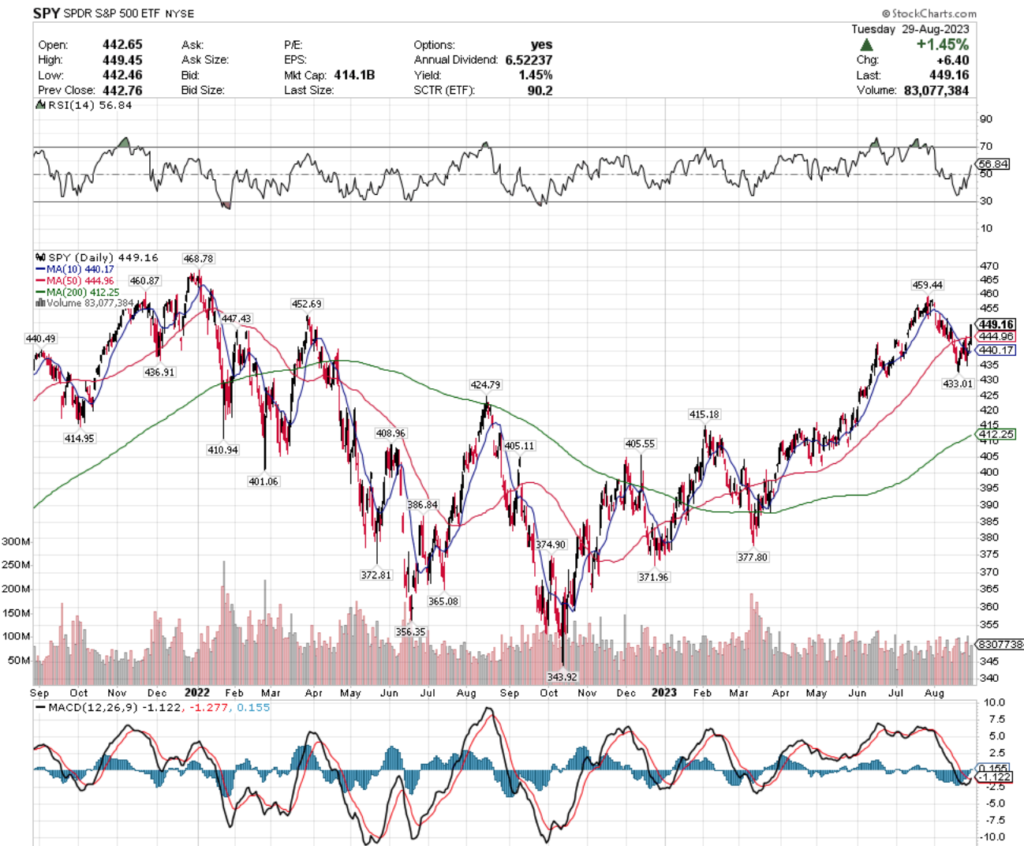
SPY ETF’s Technical Performance Over The Past Year
The S&P 500 (SPY) is just -2.24% below its 52-week high it reached about one month ago & has been in a consolidation range since the end of July.
Their RSI is on the overbought end of the neutral range, sitting at 56.84, with their MACD trying to crossover bullishly in the coming days.
Trading volumes over the past month have fallen -9.85% compared to the average for the year prior (76,433,609.09 vs. 84,789,231.87) as market participants had been taking profits off of the table, but have increased to -4.74% below average over the past week (80,766,700 vs. 84,789,231.87).
The uptick in volume this week comes with a catch, as the second highest volume day was a bearish engulfing candle last Thursday, and the highest volume day resulted in a spinning top after it, indicating indecision among market participants last Friday (there was also a spinning top to kick off the week this Monday).
While yesterday’s session was able to break above their 50 day moving average, the market will need some catalyst to keep driving higher in the near-term.
It is also worth noting that a bearish head & shoulders pattern began to emerge from SPY’s chart last week, which will be something to keep an eye on in the coming weeks.
Given that the next level of support aside from the 10 & 50 day moving averages for SPY is -3.36% below their current price & the next level below that is -7.57% below the price, the table below will be helpful for gauging how market participants will behaved by volume at each price level that they have traded at over the past 1-2 years.
I have included a 2 year chart as well to help visualize how the volume looked in relation to the chart.
SPY ETF’s Technical Performance Over The Past 1-2 Years
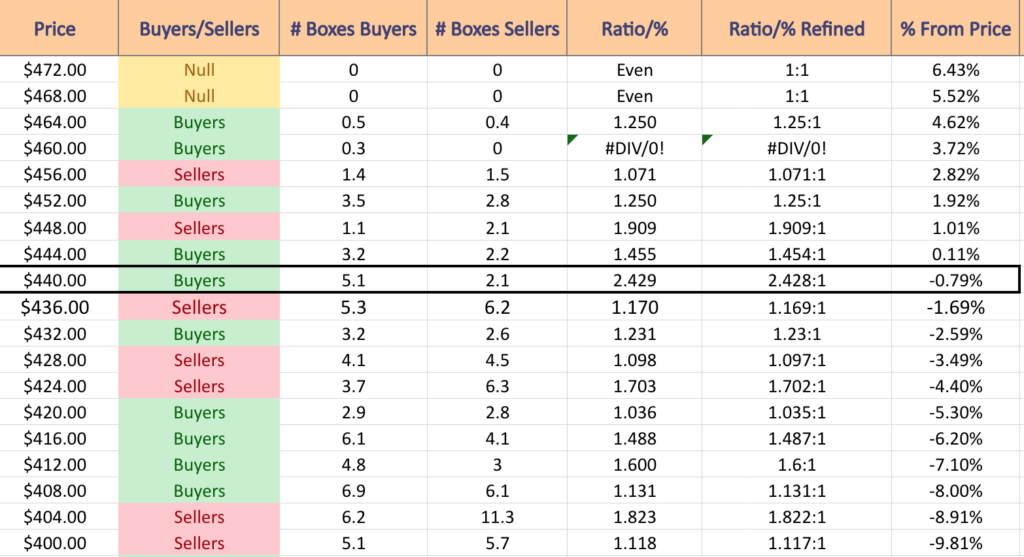
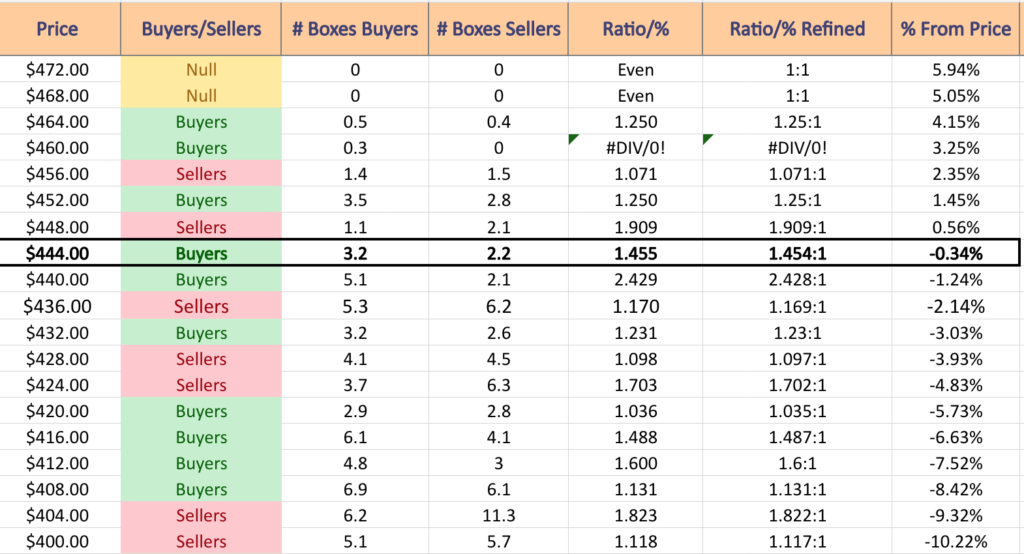
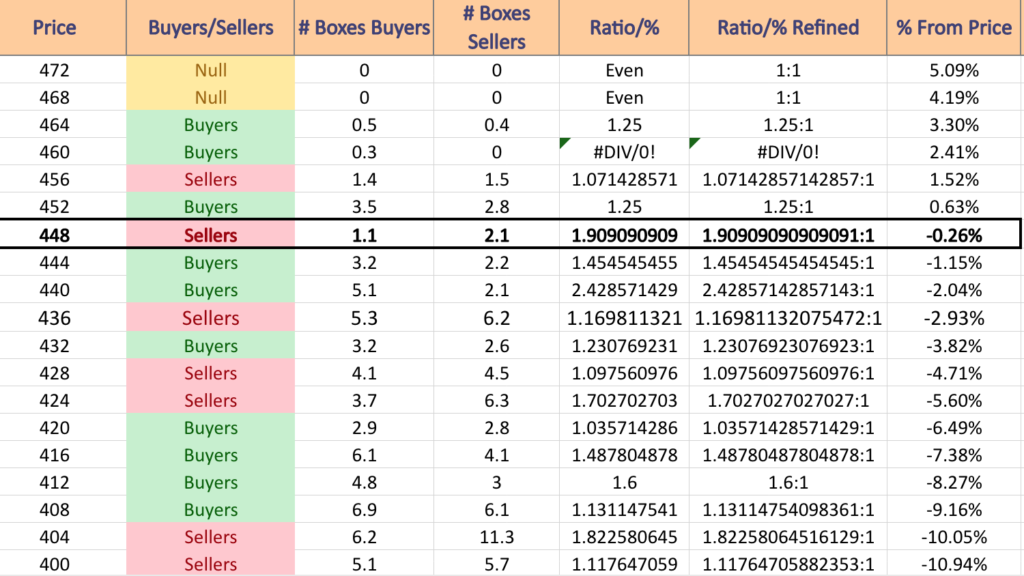
SPY ETF’s Price:Volume Sentiment Over The Past 1-2 Years
SPY ETF’s Price:Volume Sentiment Over The Past 1-2 Years
SPY ETF’s Price:Volume Sentiment Over The Past 1-2 Years
$472 – NULL – 0:0*; +5.09% From Current Price Level
$468 – NULL – 0:0*; +4.19% From Current Price Level
$464 – Buyers – 1.25:1; +3.3% From Current Price Level
$460 – Buyers – 0.3:0*; +2.41% From Current Price Level
$456 – Sellers – 1.07:1; +1.52% From Current Price Level
$452 – Buyers – 1.25:1; +0.63% From Current Price Level
$448 – Sellers – 1.91:1; -0.26% From Current Price Level – Current Price Level
$444 – Buyers – 1.45:1; -1.15% From Current Price Level – 50 Day Moving Average
$440 – Buyers – 2.43:1; -2.04% From Current Price Level – 10 Day Moving Average
$436 – Sellers – 1.17:1; -2.93% From Current Price Level
$432 – Buyers – 1.23:1; -3.82% From Current Price Level
$428 – Sellers – 1.10:1; -4.71% From Current Price Level
$424 – Sellers – 1.7:1; -5.6% From Current Price Level
$420 – Buyers – 1.04:1; -6.49% From Current Price Level
$416 – Buyers – 1.49:1; -7.38% From Current Price Level
$412 – Buyers – 1.6:1; -8.27% From Current Price Level – 200 Day Moving Average
$408 – Buyers 1.13:1; -9.16% From Current Price Level
$404 – Sellers – 1.82:1; -10.05% From Current Price Level
$400 – Sellers – 1.12:1; -10.94% From Current Price Level
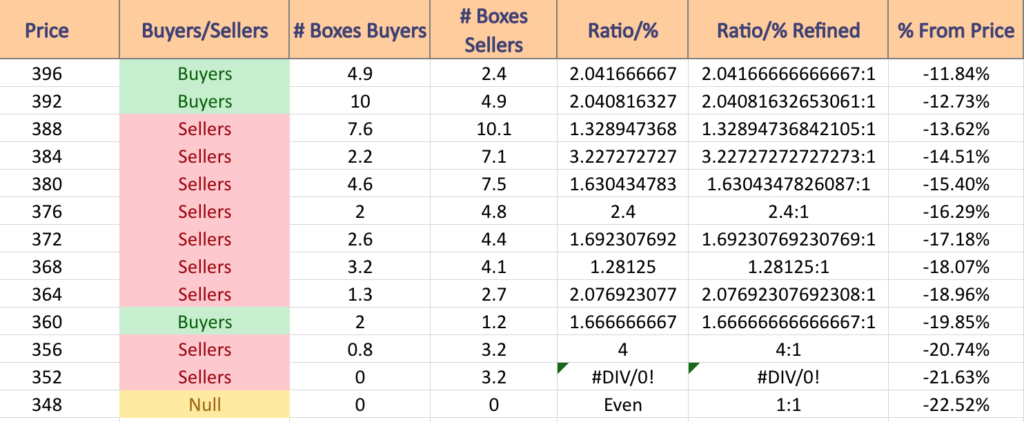
$396 – Buyers – 2.04:1; -11.84% From Current Price Level
$392 – Buyer s- 2.04:1; -12.73% From Current Price Level
$388 – Sellers – 1.33:1; -13.62% From Current Price Level
$384 – Sellers – 3.23:1; -14.51% From Current Price Level
$380 – Sellers – 1.63:1; -15.4% From Current Price Level
$376 – Sellers – 2.4:1; -16.29% From Current Price Level
$372 – Sellers – 1.69:1; -17.18% From Current Price Level
$368 – Sellers – 1.28:1; -18.07% From Current Price Level
$364 – Sellers – 2.08:1; -18.96% From Current Price Level
$360 – Buyers – 1.67:1; -19.85% From Current Price Level
$356 – Sellers – 4:1; -20.74% From Current Price Level
$352 – Sellers – 3.2:0*; -21.63% From Current Price Level
$348 – NULL – 0:0*; -22.52% From Current Price Level
Technical Analysis & Price:Volume Sentiment Analysis Of The NASDAQ (QQQ)
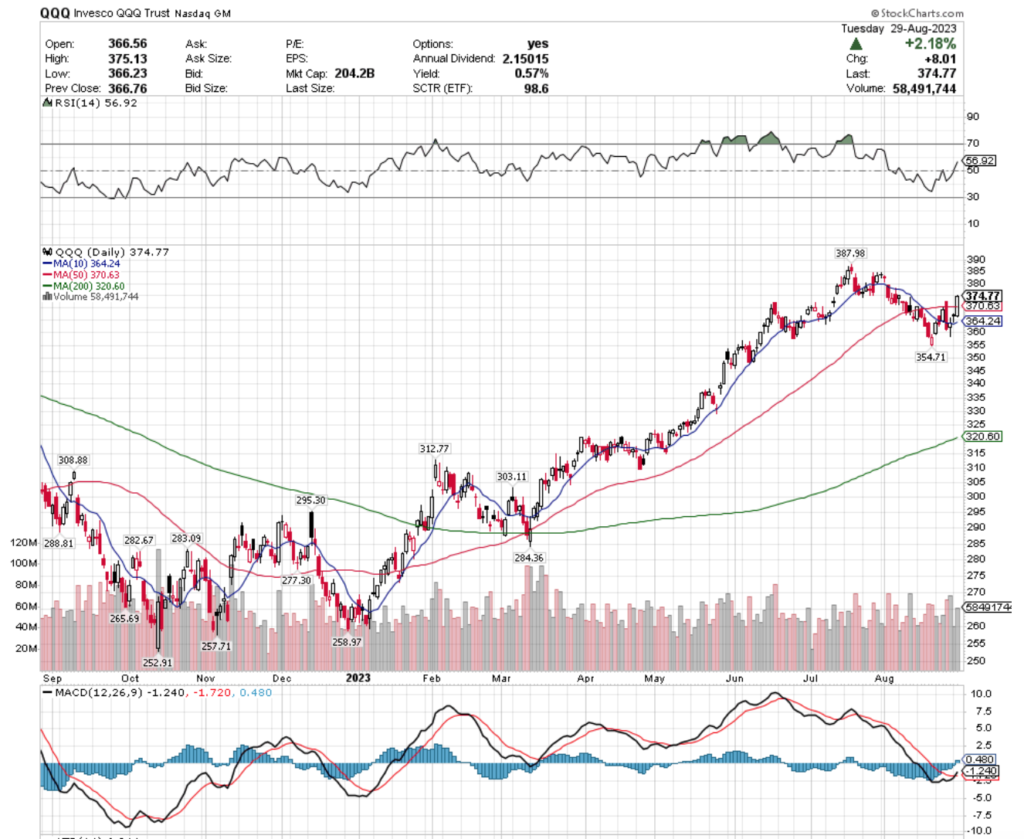
QQQ ETF’s Technical Performance Over The Past Year
The NASDAQ (QQQ) is currently -3.4% below its 52-week high which occurred in mid-July.
Much like SPY, they have been consolidating over the past month & a half & have been relatively range-bound.
Their RSI is also on the overbought end of the neutral range at 56.92, with their MACD slightly bullish.
QQQ’s volume story is interesting, with the past week’s volumes rising +2.58% higher than the average for the past year (57,473,620 vs. 56,025,471.31) after the past month’s average volume dipped -4.93% below average (53,264,047.83 vs. 56,025,471.31) as investors trimmed profits & took a wait & see approach into earnings season.
Their chart is very similar to SPY’s, with last Thursday’s bearish engulfing candlestick being the second highest volume day of the past week & Friday’s spinning top candlestick signaling “popular indecision” & having the week’s highest volume.
This week kicked off Monday with a dragonfly doji that was barely supported by the 10 day moving average on weak volume, signaling there is likely more near-term volatility on the horizon.
Also like SPY, QQQ began showing signs of a bearish head & shoulders pattern throughout their range-bound August decline, which will be something to keep an eye on in the coming weeks.
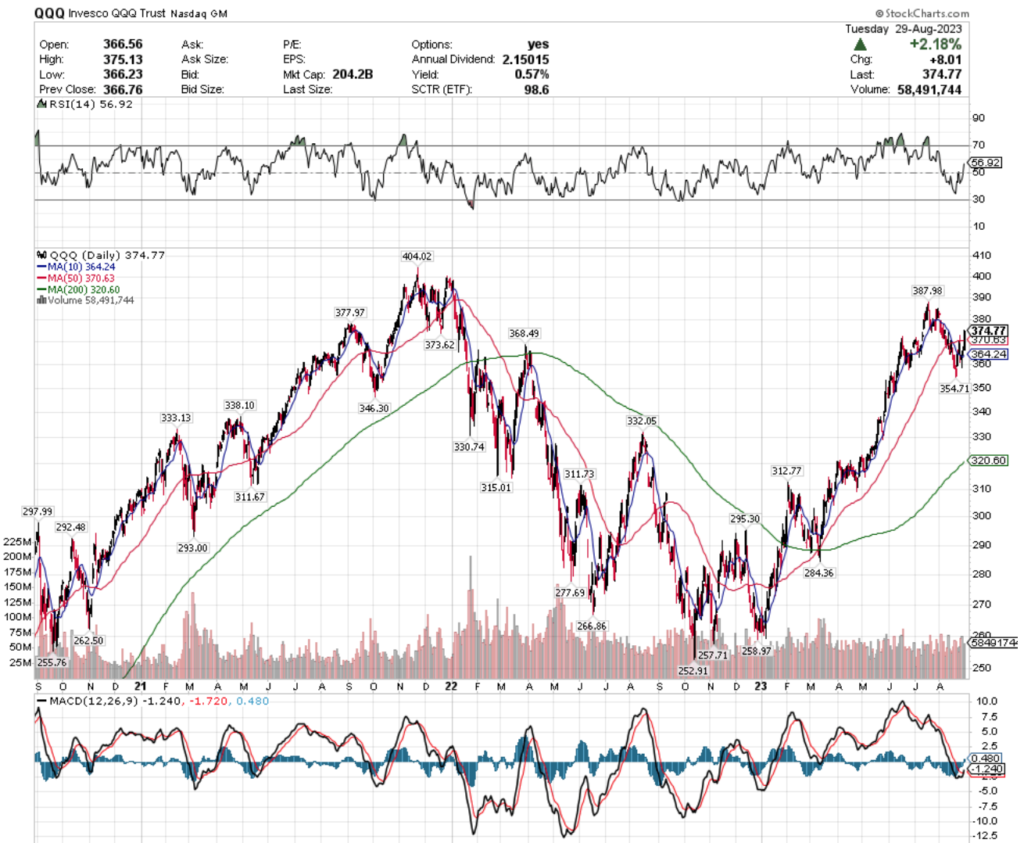
Aside from QQQ’s 10 & 50 day moving averages, their next level of support from the current price is -5.35% below their current price & the next highest level from there is -14.45% below the current price (200 day moving average).
The charts & price:volume list below shows how their trading volume has been at each price-range that they have traded at over the past 2-3 years & there is a 3 year candlestick chart for an additional visual below.
QQQ ETF’s Technical Performance Over The Past 2-3 Years
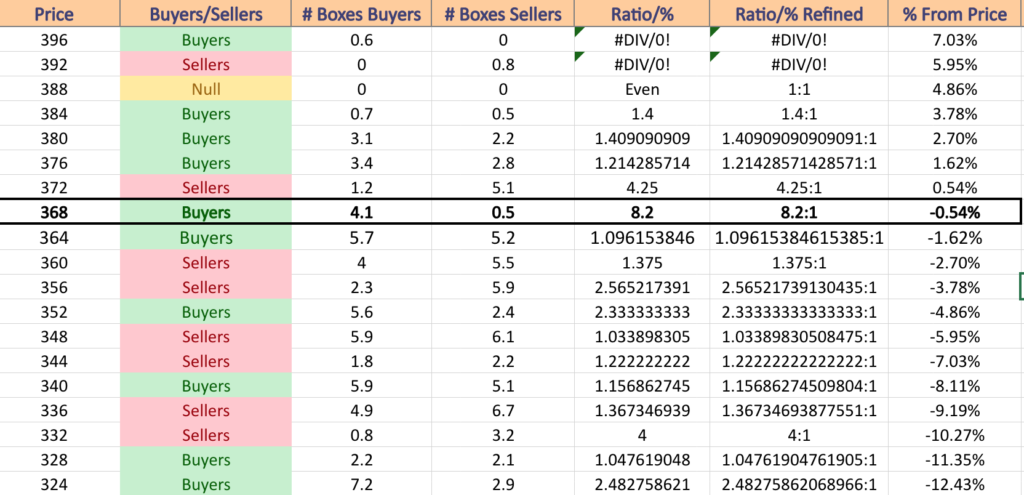
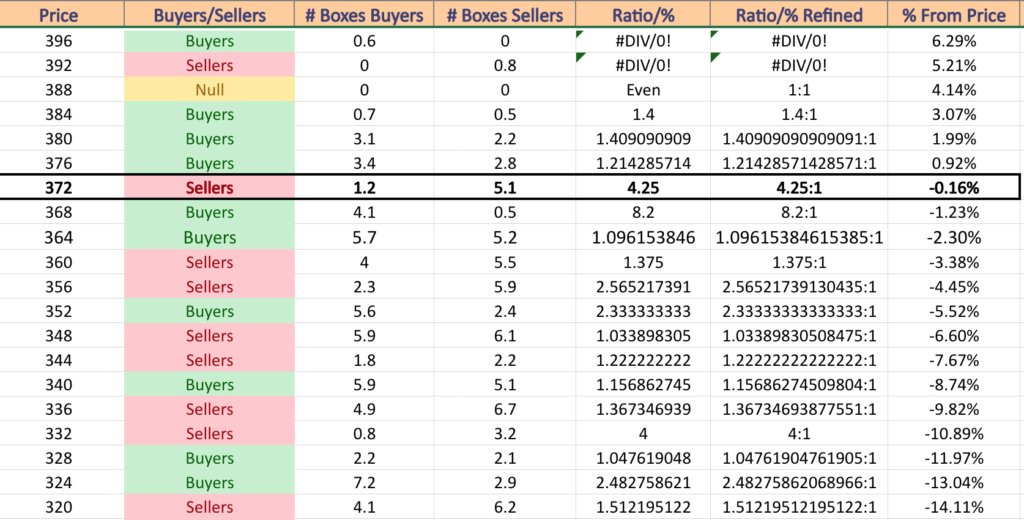
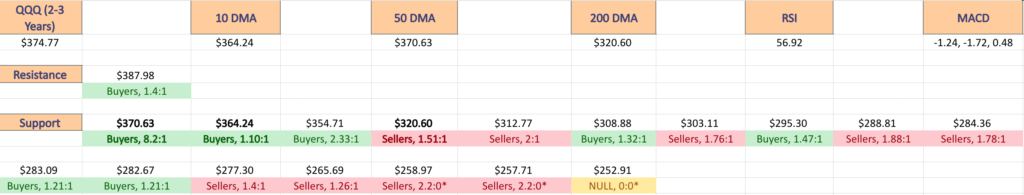
QQQ ETF’s Price:Volume Sentiment Over The Past 2-3 Years
QQQ ETF’s Price:Volume Sentiment Over The Past 2-3 Years
QQQ ETF’s Price:Volume Sentiment Over The Past 2-3 Years
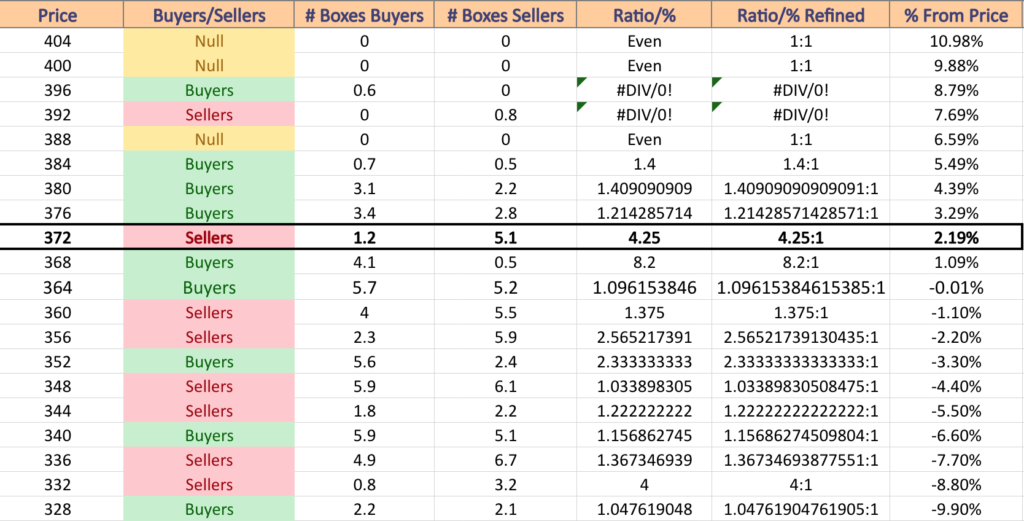
$404 – NULL – 0:0*; +10.98% From Current Price Level
$400 – NULL – 0:0*; +9.88% From Current Price Level
$396 – Buyers – 0.6:0*; +8.79% From Current Price Level
$392 – Sellers – 0.8:0*; +7.69% From Current Price Level
$388 – NULL – 0:0*; +6.59% From Current Price Level
$384 – Buyers – 1.4:1; +5.49% From Current Price Level
$380 – Buyers – 1.41:1; +4.39% From Current Price Level
$376 – Buyers – 1.21:1; +3.29% From Current Price Level
$372 – Sellers – 4.25:1; +2.19% From Current Price Level – Current Price Level
$368 – Buyers – 8.2:1; +1.09% From Current Price Level – 50 Day Moving Average
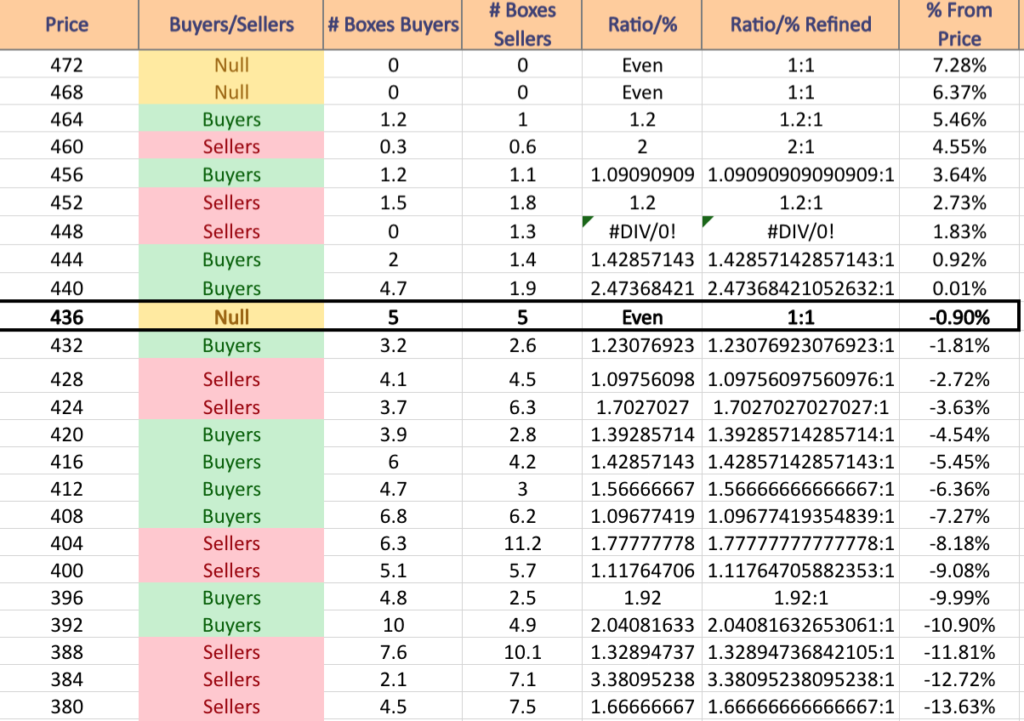
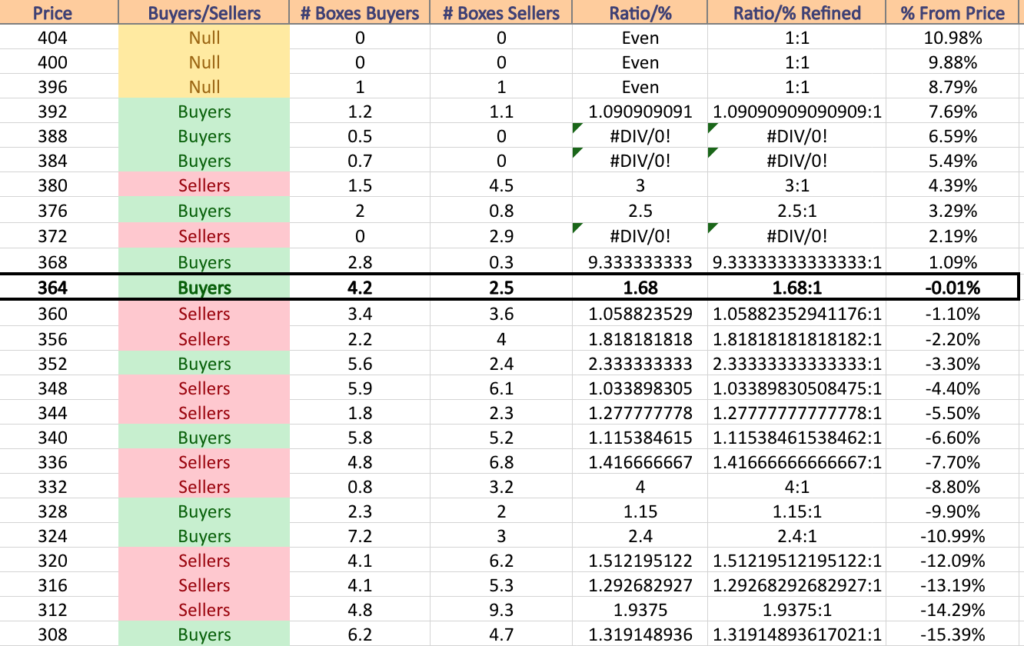
$364 – Buyers – 1.10:1; -0.01% From Current Price Level – 10 Day Moving Average
$360 – Sellers – 1.38:1; -1.1% From Current Price Level
$356 – Sellers – 2.57:1; -2.2% From Current Price Level
$352 – Buyers – 2.33:1; -3.3% From Current Price Level
$348 – Sellers – 1.03:1; -4.4% From Current Price Level
$344 – Sellers – 1.22:1; -5.5% From Current Price Level
$340 – Buyers – 1.16:1; -6.6% From Current Price Level
$336 – Sellers – 1.37:1; -7.7% From Current Price Level
$332 – Sellers – 4:1; -8.8% From Current Price Level
$328 – Buyers – 1.05:1; -9.9% From Current Price Level
$324 – Buyers – 2.48:1; -10.99% From Current Price Level
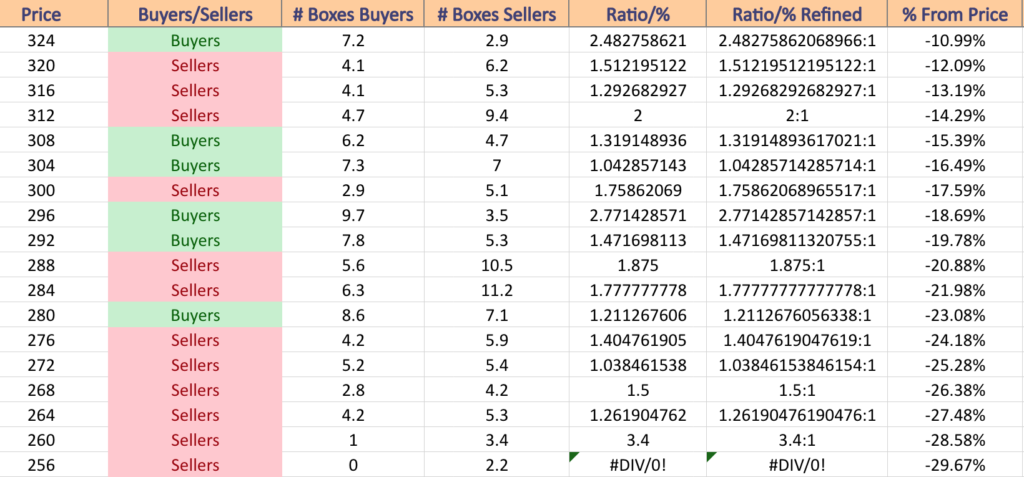
$320 – Sellers – 1.51:1; -12.09% From Current Price Level – 200 Day Moving Average
$316 – Sellers – 1.29:1; -13.19% From Current Price Level
$312 – Sellers – 2:1; -14.29% From Current Price Level
$308 – Buyers – 1.32:1; -15.39% From Current Price Level
$304 – Buyers – 1.04:1; -16.49% From Current Price Level
$300 – Sellers – 1.76:1; -17.59% From Current Price Level
$296 – Buyers – 2.77:1; -18.69% From Current Price Level
$292 – Buyers – 1.47:1; -19.78% From Current Price Level
$288 – Sellers – 1.875:1; -20.88% From Current Price Level
$284 – Sellers – 1.78:1; -21.98% From Current Price Level
$280 – Buyers – 1.21:1; -23.08% From Current Price Level
$276 – Sellers – 1.40:1; -24.18% From Current Price Level
$272 – Sellers – 1.03:1; -25.28% From Current Price Level
$268 – Sellers – 1.5:1; -26.38% From Current Price Level
$264 – Sellers – 1.26:1; -27.48% From Current Price Level
$260 – Sellers – 3.4:1; -28.58% From Current Price Level
$256 – Sellers – 2.2:0*; -29.67% From Current Price Level
Technical Analysis & Price:Volume Sentiment Analysis Of The Russell 2000 (IWM)
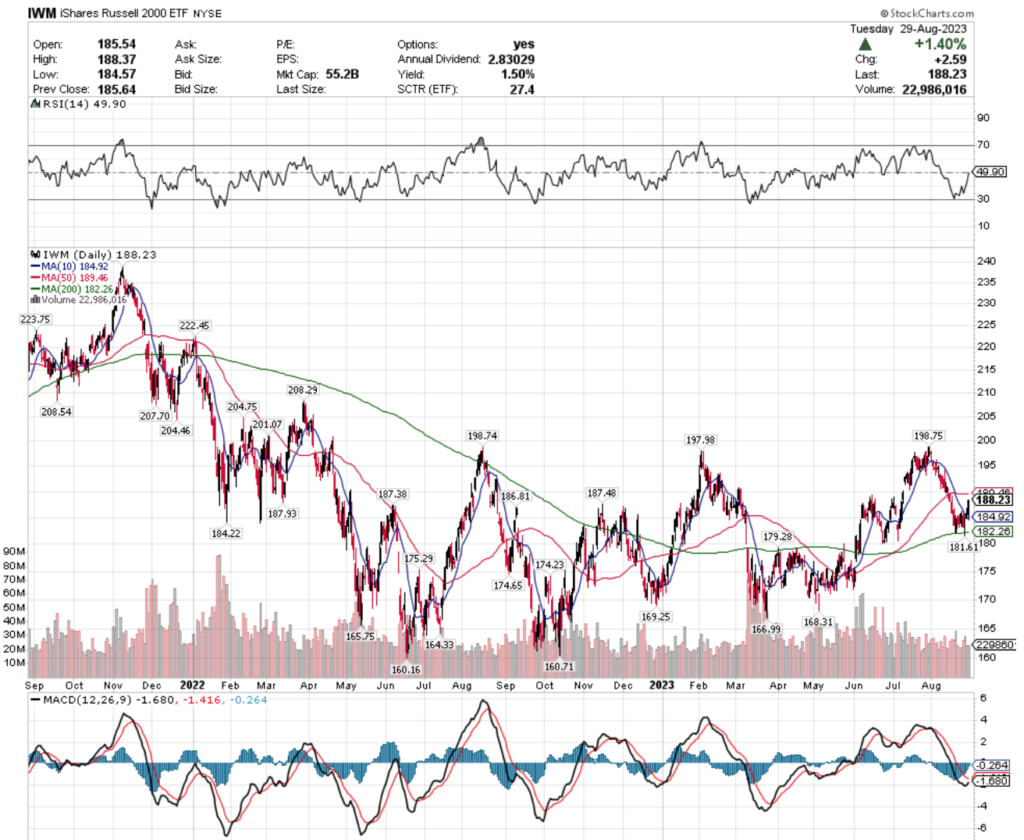
IWM ETF’s Technical Performance Over The Past Year
The Russell 2000 (IWM) is currently -5.29% below their 52-week high that occurred on July 31,2023.
Their RSI is neutral at 49.9, with a bearish MACD that is beginning to show signs of potentially completing a bullish crossover in the coming days.
Trading volumes for the past week have been -12.86% below average compared to the year prior (24,613,560 vs. 28,245,386.45) & the past month’s average volumes have been -12.29% below the year prior’s average (24,773,543.48 vs. 28,245,386.45).
This signal of waning enthusiasm also occurred during a steep decline for IWM from profit taking off of the 52-week high, however their support levels along the way did not show much signs of strength in the decline.
Friday’s long-legged doji signaled severe indecision to close out the week, on high volume compared to the other days & Monday’s session resulted in a shooting star candle, which signals bearish sentiment.
However, the shooting star was supported by the 10 day moving average, but that session & yesterday’s were both on mediocre volume, which does not confirm bullish sentiment behind either days’ advances.
IWM has traded at a much less accelerated pace compared to SPY & QQQ, so it has more support levels nearby than the previous two mentioned ETFs, but it too has begun to show signs of a bearish head & shoulders pattern since the middle of August.
Below are the lists of the volumes at each of the price levels IWM has traded at over the past 1-2 years, as well as a 2 year candlestick chart to help better visualize how their support levels may hold up in the coming weeks.
IWM ETF’s Technical Performance Over The Past 1-2 Years
IWM ETF’s Price:Volume Sentiment Over The Past 1-2 Years
IWM ETF’s Price:Volume Sentiment Over The Past 1-2 Years
IWM ETF’s Price:Volume Sentiment Over The Past 1-2 Years
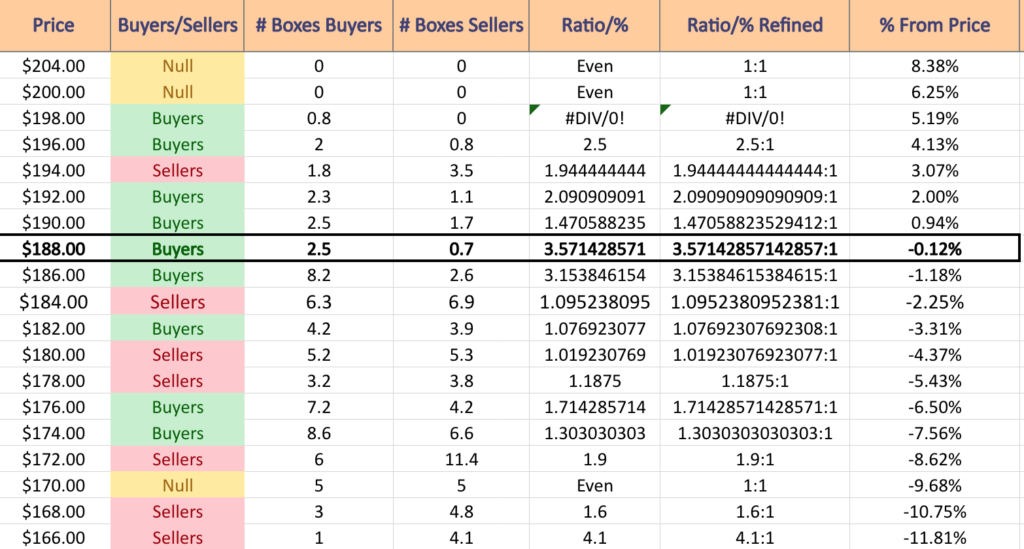
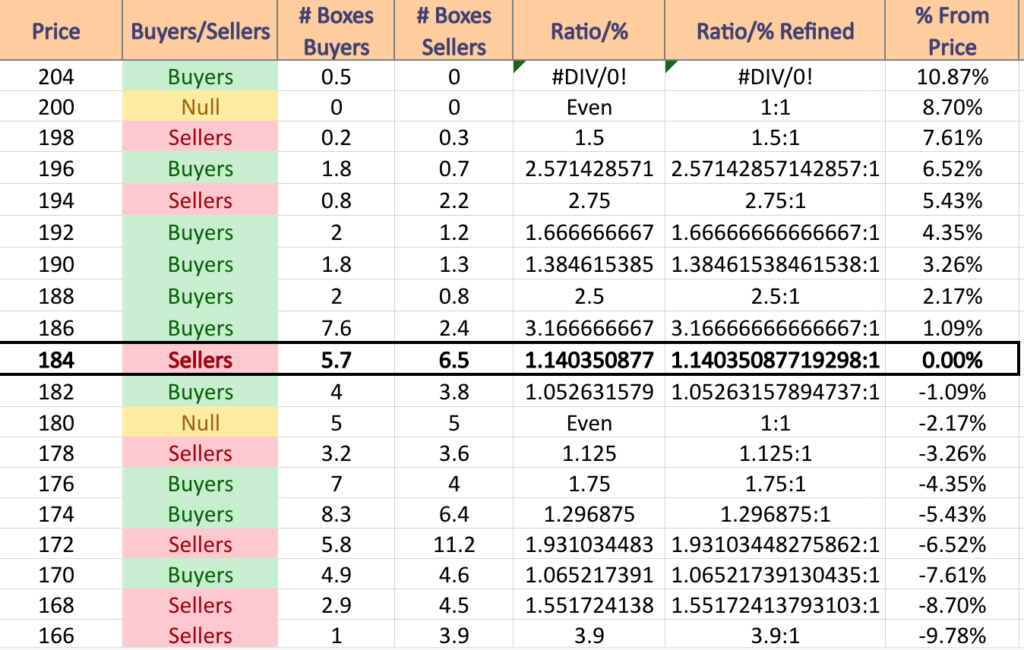
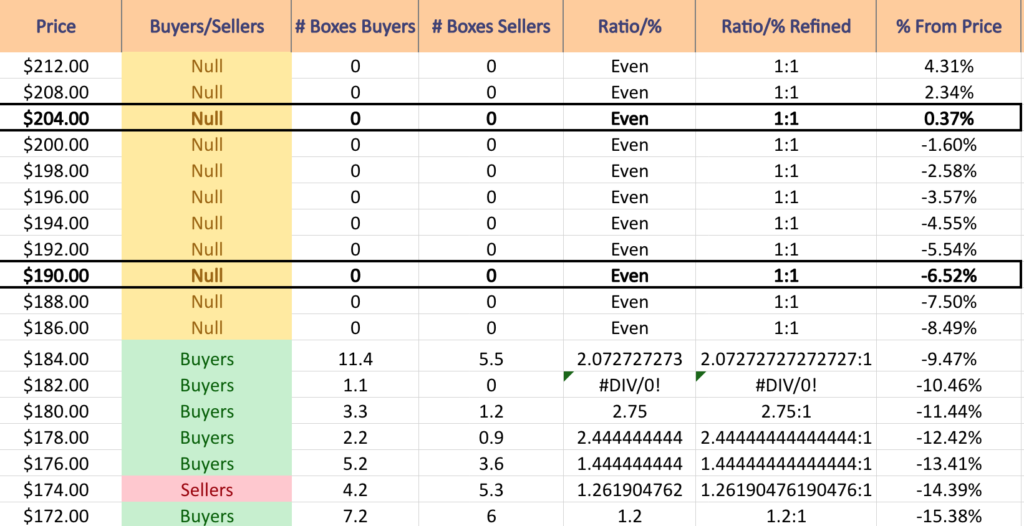
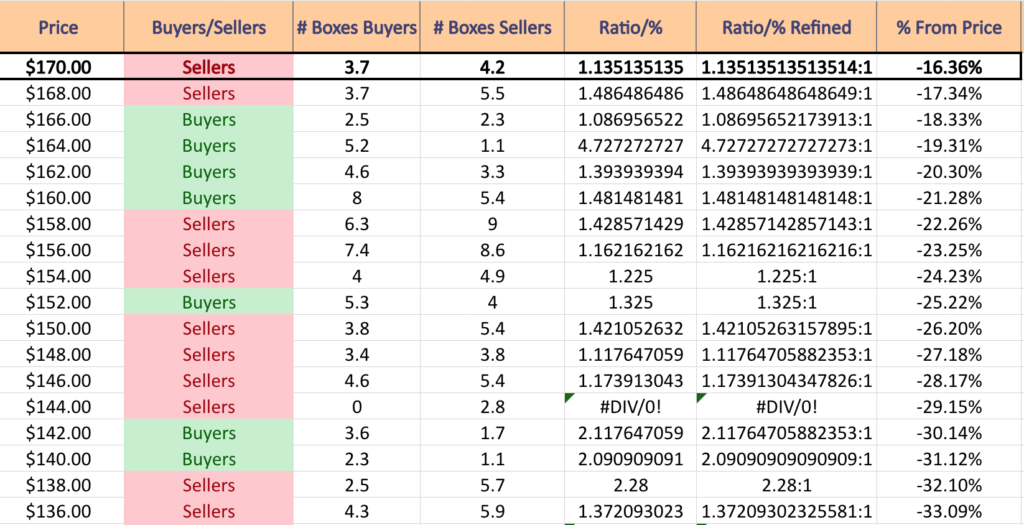
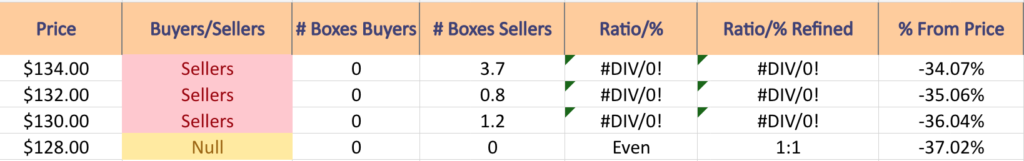
$204 – NULL – 0:0*; +8.38% From Current Price Level
$200 – NULL – 0:0*; +6.25% From Current Price Level
$198 – Buyers – 0.8:0*; +5.19% From Current Price Level
$196 – Buyers – 2.5:1; +4.13% From Current Price Level
$194 – Sellers – 1.94:1; +3.07% From Current Price Level
$192 – Buyers – 2.09:1; +2% From Current Price Level
$190 – Buyers – 1.47:1; +0.94% From Current Price Level
$188 – Buyers – 3.57:1; -0.12% From Current Price Level – Current Price Level & 50 Day Moving Average
$186 – Buyers – 3.15:1; -1.18% From Current Price Level
$184 – Sellers – 1.10:1; -2.25% From Current Price Level – 10 Day Moving Average
$182 – Buyers – 1.08:1; -3.31% From Current Price Level– 200 Day Moving Average
$180 – Sellers – 1.02:1; -4.37% From Current Price Level
$178 – Sellers – 1.19:1; -5.43% From Current Price Level
$176 – Buyers – 1.71:1; -6.5% From Current Price Level
$174 – Buyers – 1.3:1; -7.56% From Current Price Level
$172 – Sellers – 1.9:1; -8.62% From Current Price Level
$170 – Even – 1:1; -9.68% From Current Price Level
$168 – Sellers – 1.6:1; -10.75% From Current Price Level
$166 – Sellers – 4.1:1; -11.81% From Current Price Level
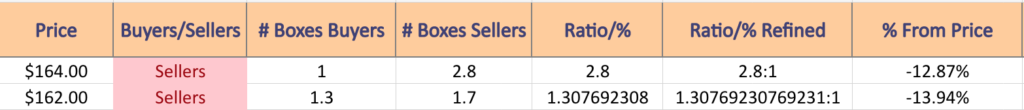
$164 – Sellers – 2.8:1; -12.87% From Current Price Level
$162 – Sellers – 1.31:1; -13.94% From Current Price Level
Technical Analysis & Price:Volume Sentiment Analysis Of The Dow Jones Industrial Average (DIA)
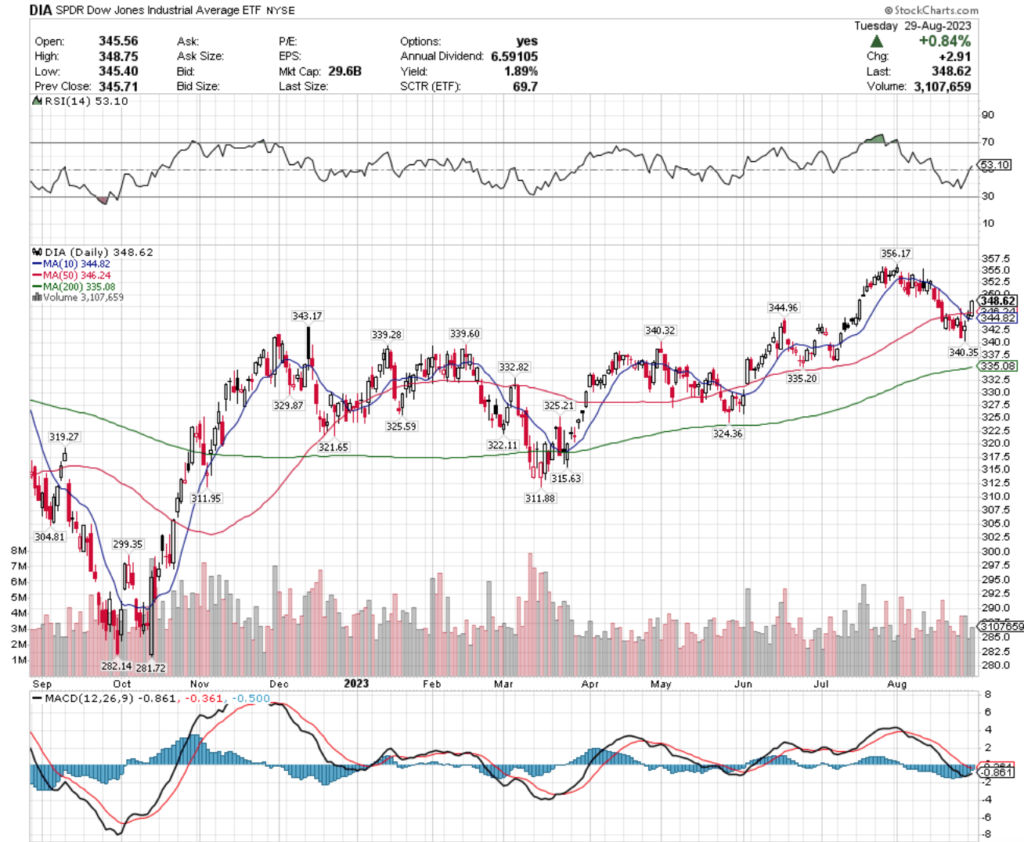
DIA ETF’s Technical Performance Over The Past Year
Their RSI is neutral at 53.1, with a bearish MACD that looks to be trying to turn bullish in the coming days if they can keep up the gains of the past few sessions.
Their trading volume over the past month has declined -10.55% compared to the average volume of the past year (3,275,478.26 vs. 3,661,896.81), with this past week’s volume falling even further to -13.69% below the year prior’s average (3,160,440 vs. 3,661,896.81).
Much like SPY & QQQ, DIA’s strongest volume days of the week were Friday & Monday.
Thursday they were unable to stay above their 10 & 50 day moving averages & ultimately closed below their open, and Friday resulted in a spinning top candlestick that tested lower lows than Thursday’s session.
Monday’s gap up with on very limited volume, which is also a sign of potential weakness on the horizon.
DIA’s 10 & 50 day moving averages are two of their next three levels of support, but do not look particularly strong.
The tables below outline their volume at each price level that they’ve traded at over the past 3-4 years & I have included a 4 year chart below as well.
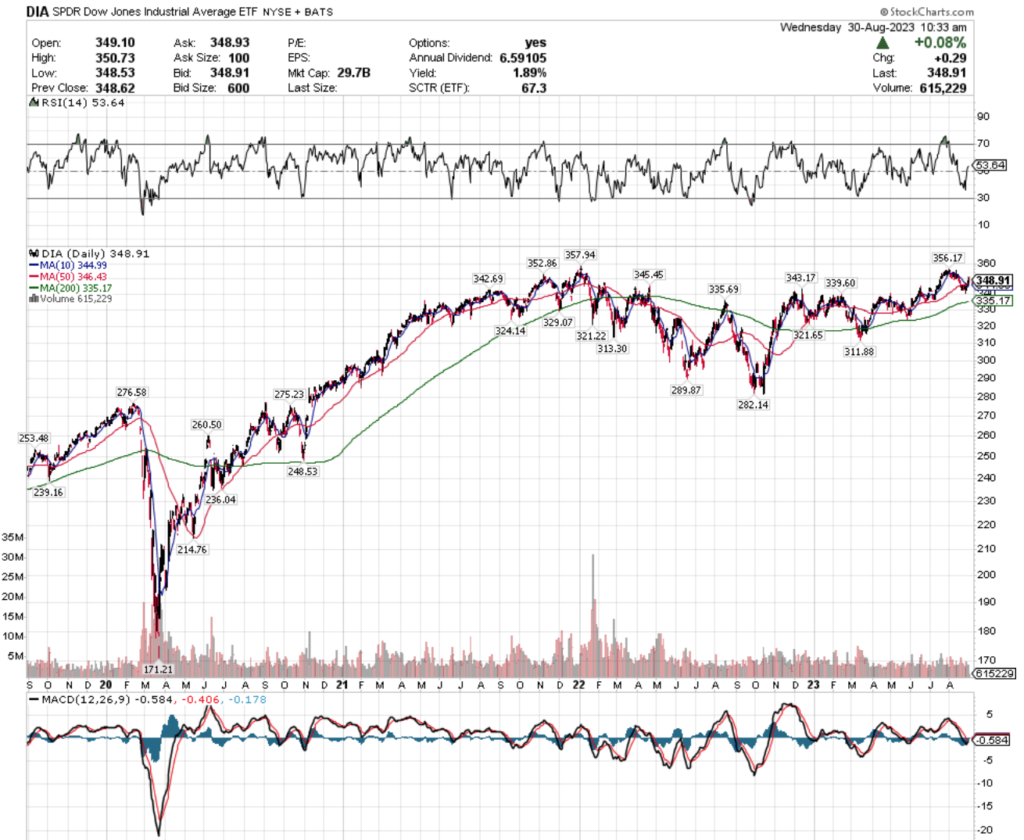
DIA ETF’s Technical Performance Over The Past 3-4 Years
DIA ETF’s Price:Volume Sentiment Over The Past 3-4 Years
DIA ETF’s Price:Volume Sentiment Over The Past 3-4 Years
DIA ETF’s Price:Volume Sentiment Over The Past 3-4 Years
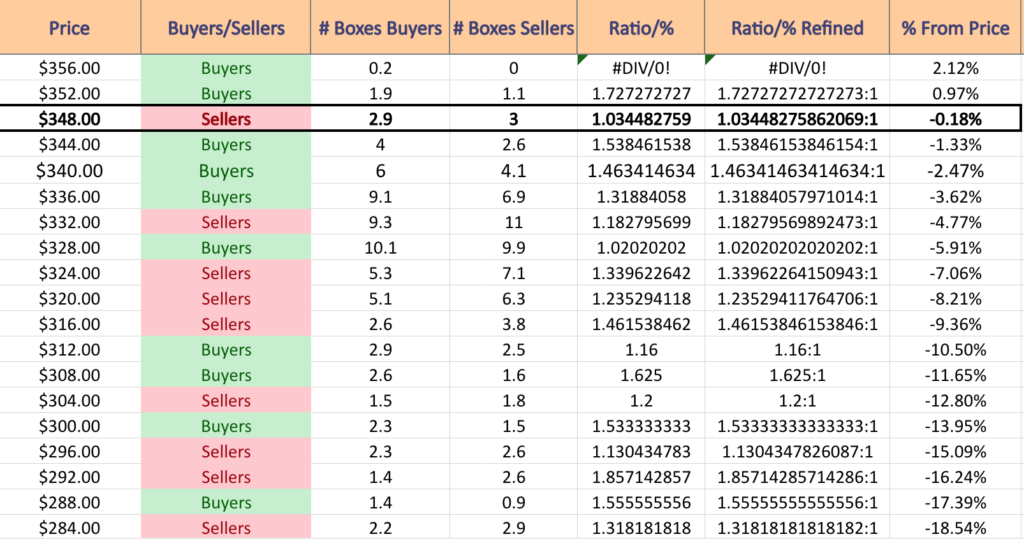
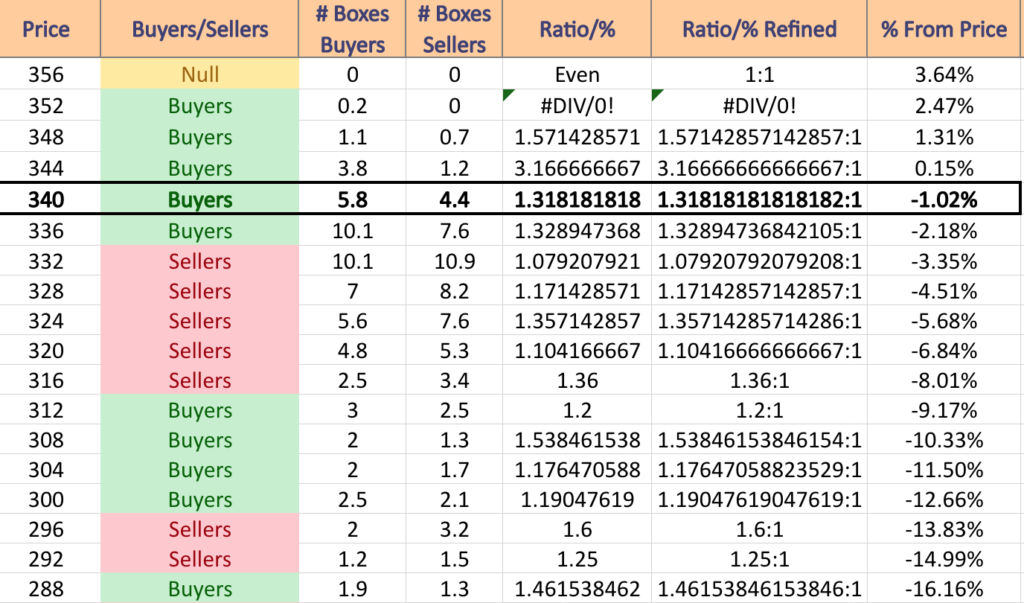
$356 – Buyers – 0.2:0*; +2.12% From Current Price Level
$352 – Buyers – 1.73:1; +0.97% From Current Price Level
$348 – Sellers – 1.03:1; -0.18% From Current Price Level – Current Share Price Level
$344 – Buyers – 1.54:1; -1.33% From Current Price Level – 10 & 50 Day Moving Average
$340 – Buyers – 1.46:1; -2.47% From Current Price Level
$336 – Buyers – 1.32:1; -3.62% From Current Price Level
$332 – Sellers – 1.18:1; -4.77% From Current Price Level – 200 Day Moving Average
$328 – Buyers – 1.02:1; -5.91% From Current Price Level
$324 – Sellers – 1.34:1; -7.06% From Current Price Level
$320 – Sellers – 1.24:1; -8.21% From Current Price Level
$316 – Sellers – 1.46:1; -9.36% From Current Price Level
$312 – Buyers – 1.16:1; -10.5% From Current Price Level
$308 – Buyers – 1.63:1; -11.65% From Current Price Level
$304 – Sellers – 1.2:1; -12.8% From Current Price Level
$300 – Buyers – 1.53:1; -13.95% From Current Price Level
$296 – Sellers – 1.13:1; -15.09% From Current Price Level
$292 – Sellers – 1.86:1; -16.24% From Current Price Level
$288 – Buyers – 1.56:1; -17.39% From Current Price Level
$284 – Sellers – 1.32:1; -18.54% From Current Price Level
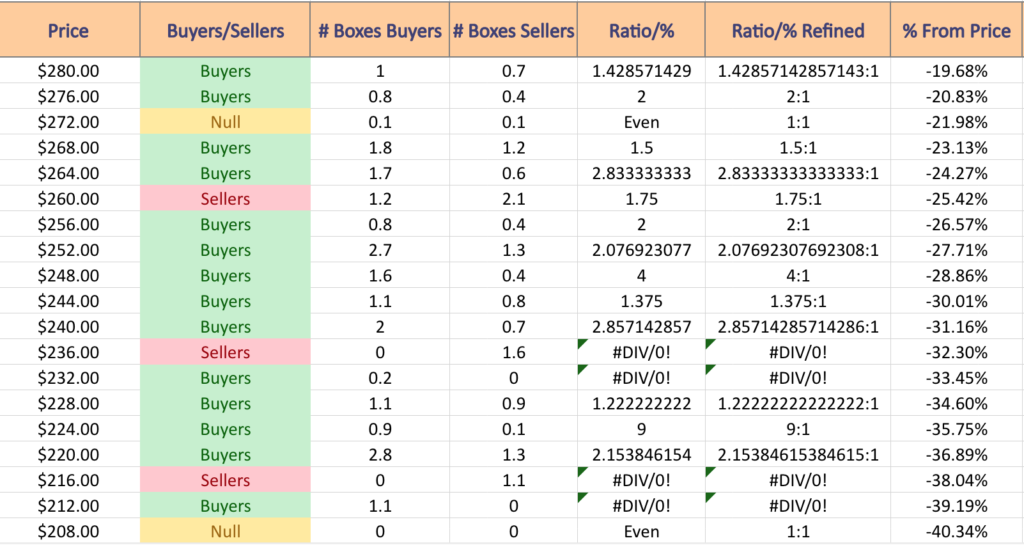
$280 – Buyers – 1.43:1; -19.68% From Current Price Level
$276 – Buyers – 2:1; -20.83% From Current Price Level
$272 – Even – 1:1; -21.98% From Current Price Level
$268 – Buyers – 1.5:1; -23.13% From Current Price Level
$264 – Buyers – 2.83:1; -24.27% From Current Price Level
$260 – Sellers – 1.75:1; -25.42% From Current Price Level
$256 – Buyers – 2:1; -26.57% From Current Price Level
$252 – Buyers – 2.08:1; -27.71% From Current Price Level
$248 – Buyers – 4:1; -28.86% From Current Price Level
$244 – Buyers 1.38:1; -30.01% From Current Price Level
$240 – Buyers – 2.86:1; -31.16% From Current Price Level
$236 – Sellers – 1.6:0*; -32.3% From Current Price Level
$232 – Buyers – 0.2:0*; -33.45% From Current Price Level
$228 – Buyers – 1.22:1; -34.6% From Current Price Level
$224 – Buyers – 9:1; -35.75% From Current Price Level
$220 – Buyers – 2.15:1; -36.89% From Current Price Level
$216 – Sellers – 1.1:0*; -38.04% From Current Price Level
$212 – Buyers – 1.1:0*; -39.19% From Current Price Level
$208 – NULL – 0:0*; -40.34% From Current Price Level
Tying It All Together
The lists & images above paint the picture as to how investors & traders have behaved at various price levels that SPY, QQQ, IWM & DIA have been at in recent history.
It is not meant to serve as investment/trading advice, and is simply a way to visualize what investor/trader sentiment has been like at each of the price levels mentioned, as well as what it was at levels of support & resistance that are denoted in the images & lists.
As always, do your own due diligence before making investing/trading decisions.
For more on the methodology on how the data was collected & put together, please refer to our original Price:Volume analysis.
*** I DO NOT OWN SHARES OF NOR OPTIONS CONTRACT POSITIONS IN SPY, QQQ, IWM, or DIA AT THE TIME OF PUBLISHING THIS ARTICLE ***
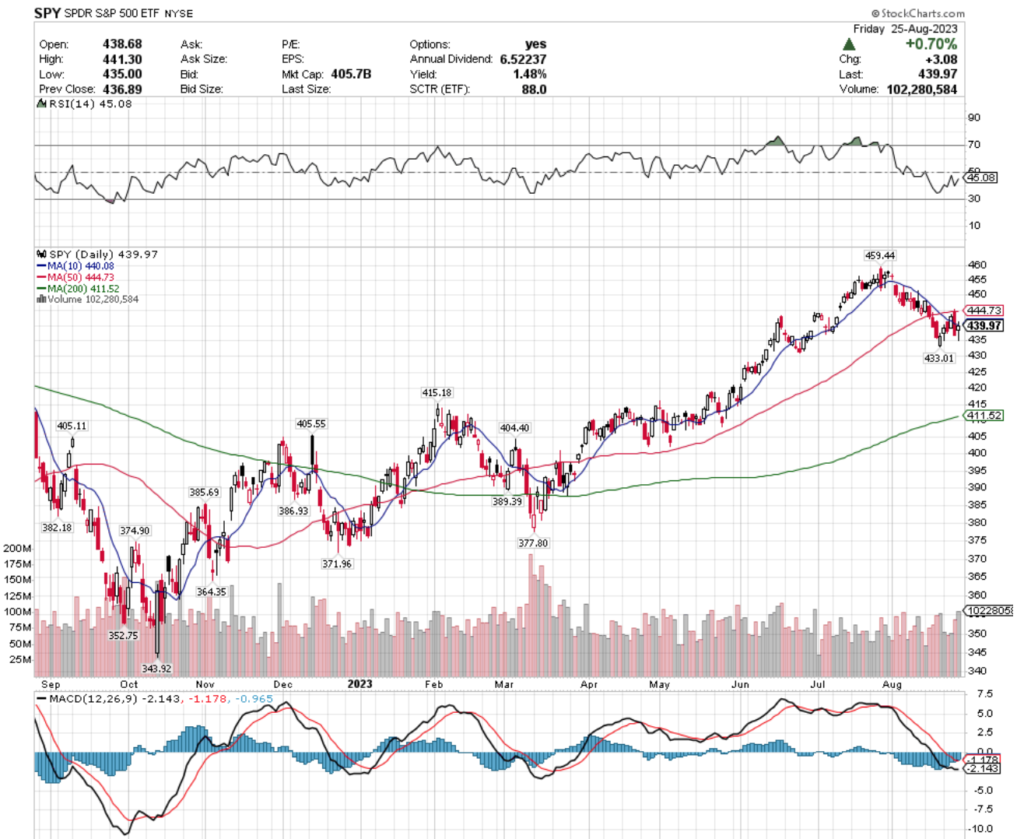
SPY ETF – The SPDR S&P 500 ETF’s Technical Performance Over The Past Year
Their RSI is trying to trend back to neutral & sits on the oversold end of neutral at 45.08, with a bearish MACD that is trying to curl up bullishly.
Volumes were -7.6% below the average for the year prior (78,304,857 vs. 84,743,675) signaling indecision among market participants, but the candlesticks tell a different story.
The week began & ended on spinning top candles, but Thursday’s bearish engulfing candlestick painted the picture that this week & next will likely see some cooling off in SPY’s share price.
The appearance of a bearish head & shoulders pattern is something to be watching out for from a technical perspective.
SPY has support at the $433.01 (Volume Sentiment: Buyers, 1.23:1), $415.18 (Volume Sentiment: Buyers, 1.57:1), $411.52 (200 Day Moving Average; Volume Sentiment: Buyers, 1.10:1) & $405.55/share (Volume Sentiment: Sellers, 1.78:1) price levels, with resistance at the $440.08 (Volume Sentiment: Buyers, 2.47:1), $444.73 (Volume Sentiment: Buyers, 1.43:1) & $459.44/share (Volume Sentiment: Buyers, 1.09:1) price levels.
SPY’s Price:Volume Sentiment Over The Past 1-2 Years
QQQ ETF – Invesco QQQ Trust ETF’s Technical Performance Over The Past Year
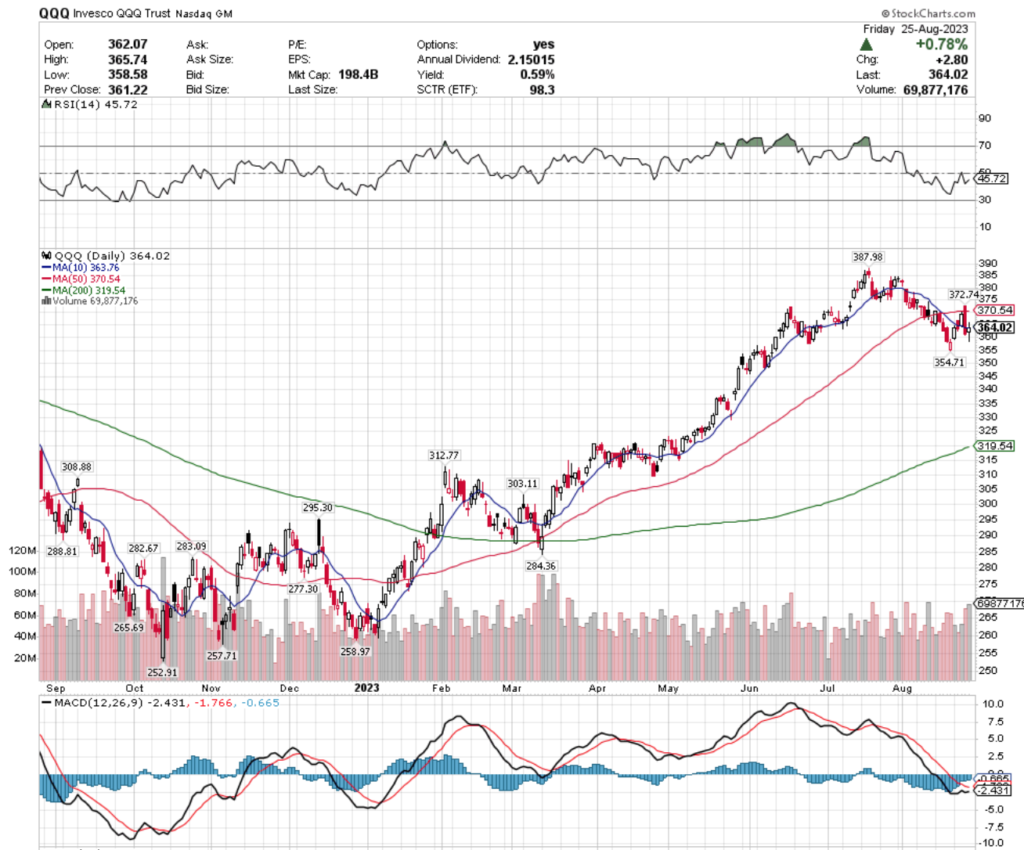
Their RSI is trending back towards neutral, but sits on the oversold end at 45.72, with a MACD that is trying to cross over bullishly in the coming days.
Volumes were +1.22% above average compared to the year prior (56,710,367 vs. 56,026,726), which is not particularly noteworthy.
However, Thursday’s bearish engulfing candle & Friday’s spinning top signal that there is hesitancy on the part of market participants & is signaling more near-term declines on the horizon.
QQQ is also beginning to show signs of developing a bearish head & shoulders pattern in the coming week or two, which is something to keep an eye on.
QQQ has support at the $363.76 (10 Day Moving Average; Volume Sentiment: Sellers, 1.06:1), $354.71 (Volume Sentiment: Buyers, 2.33:1), $319.54 (200 Day Moving Average; Volume Sentiment: Sellers, 1.29:1) & $312.77/share (Volume Sentiment: Sellers, 1.94:1) price levels, with resistance overhead at the $370.54 (50 Day Moving Average; Volume Sentiment: Buyers, 9.33:1), $372.74 (Volume Sentiment: Sellers, 2.9:0*) & $387.98/share (Volume Sentiment: Buyers, 0.7:0*) price levels.
QQQ ETF’s Price:Volume Sentiment Over The Past 1-2 Years
IWM, the iShares Russell 2000 ETF declined -0.21% this past week, faring worse than the S&P 500 & NASDAQ, but outperforming their larger cap peers of the DJIA.
IWM ETF – iShares Russell 2000 ETF’s Technical Performance Over The Past Year
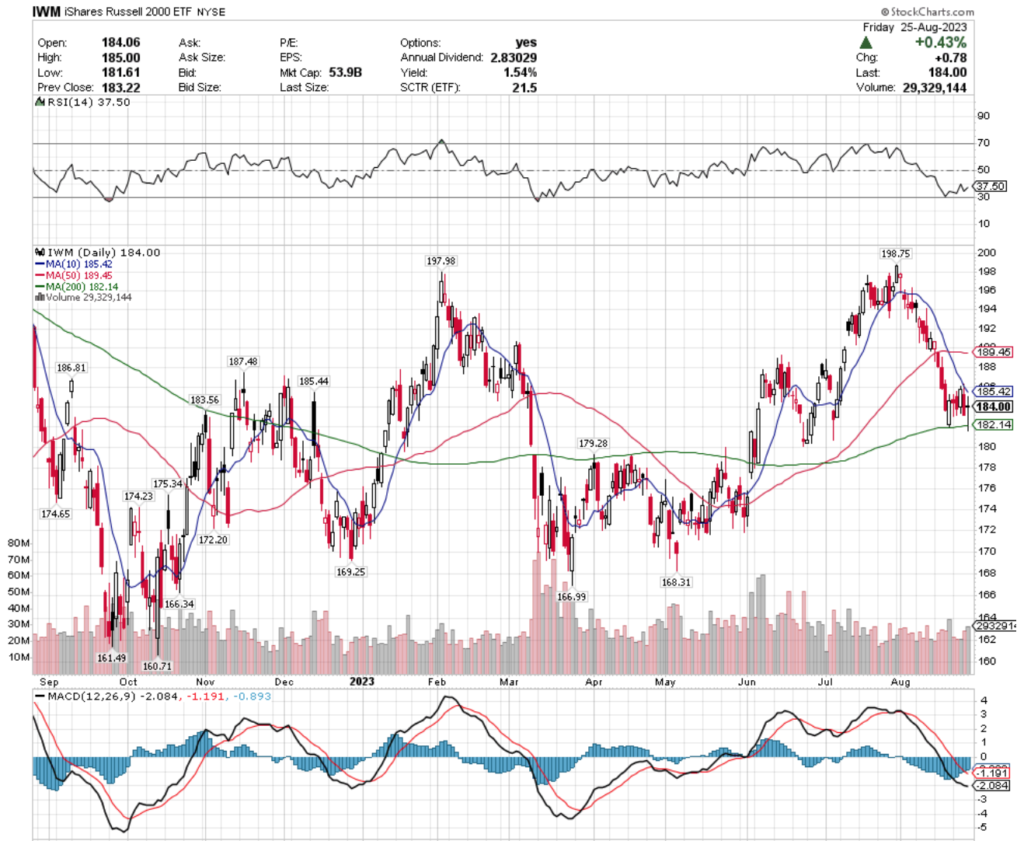
Their RSI is trying to trend back towards neutral, but sits currently at 37.5 with a bearish MACD that is attempting to smoothen out & cross over bullishly.
Volumes were -14.04% below average compared to the year prior (24,227,429 vs. 28,184,020) as investors were not feeling particularly up for taking risks in the week’s trading range.
Monday’s spinning top set the stage for uncertainty, while the week closed Friday with a dragonfly doji that temporarily broke below their 200 day moving average during the day’s session, indicating another leg lower may be on the horizon.
The downwards pressure of the 10 day moving average looks primed to force a harder test of the 200 DMA as support in the near-term, which may see us finding a third index with a bearish head & shoulders pattern in the coming weeks.
IWM has support at the $183.56 (Volume Sentiment: Buyers, 1.05:1), $182.14 (200 Day Moving Average; Volume Sentiment: Buyers, 1.05:1), $179.28 (Volume Sentiment: Sellers, 1.13:1) & $175.34/share (Volume Sentiment: Buyers, 1.30:1) price levels, with resistance at the $185.42 (10 Day Moving Average; Volume Sentiment: Sellers, 1.14:1) $185.44 (Volume Sentiment: Sellers, 1.14:1), $186.81 (Volume Sentiment: Buyers, 3.17:1) & $187.48/share (Volume Sentiment: Buyers, 3.17:1) price levels.
IWM ETF’s Price:Volume Sentiment Over The Past 1-2 Years
DIA, the SPDR Dow Jones Industrial Average ETF fell -0.34% this past week, as the larger cap stocks in this index fell the most out of favor in the market & many investors were eager to take profits & risk off of the table.
DIA ETF – SPDR Down Jones Industrial Average ETF’s Technical Performance Over The Past Year
Their RSI is trending back towards neutral & sits at 42.38 currently, but their MACD is still bearish.
Volumes were -10.98% below average compared to the year prior (3,261,314 vs. 3,663,626) as there had already been signs of profit taking in the weeks leading up to last week.
Monday kicked the week off with a hanging man candlestick, which is not a good sign & the index continued lower into the rest of the week, closing out on Friday with an indecisive spinning top candle following Thursday’s thwarted attempt to break out beyond the 10 & 50 day moving averages serving currently as resistance.
DIA has support at the $343.17 (Volume Sentiment: Buyers, 1.32:1), $340.32 (Volume Sentiment: Buyers, 1.32:1), $339.60 (Volume Sentiment: Buyers, 1.33:1) & $339.28/share (Volume Sentiment: Buyers, 1.33:1) price levels, with resistance at the $344.96 (Volume Sentiment: Buyers, 3.17:1), $345.57 (Volume Sentiment: Buyers, 3.17:1), $346.07 (Volume Sentiment: Buyers, 3.17:1) & $356.17/share (Volume Sentiment: NULL, 0:0*) price levels.
DIA ETF’s Price:Volume Sentiment Over The Past 2-3 Years
Dynamic Oil & Gas Services (PXJ), Homebuilders (XHB), Natural Gas (FCG) & Japan Hedged Equity (DBJP) Are All Bullishly Leading The Market
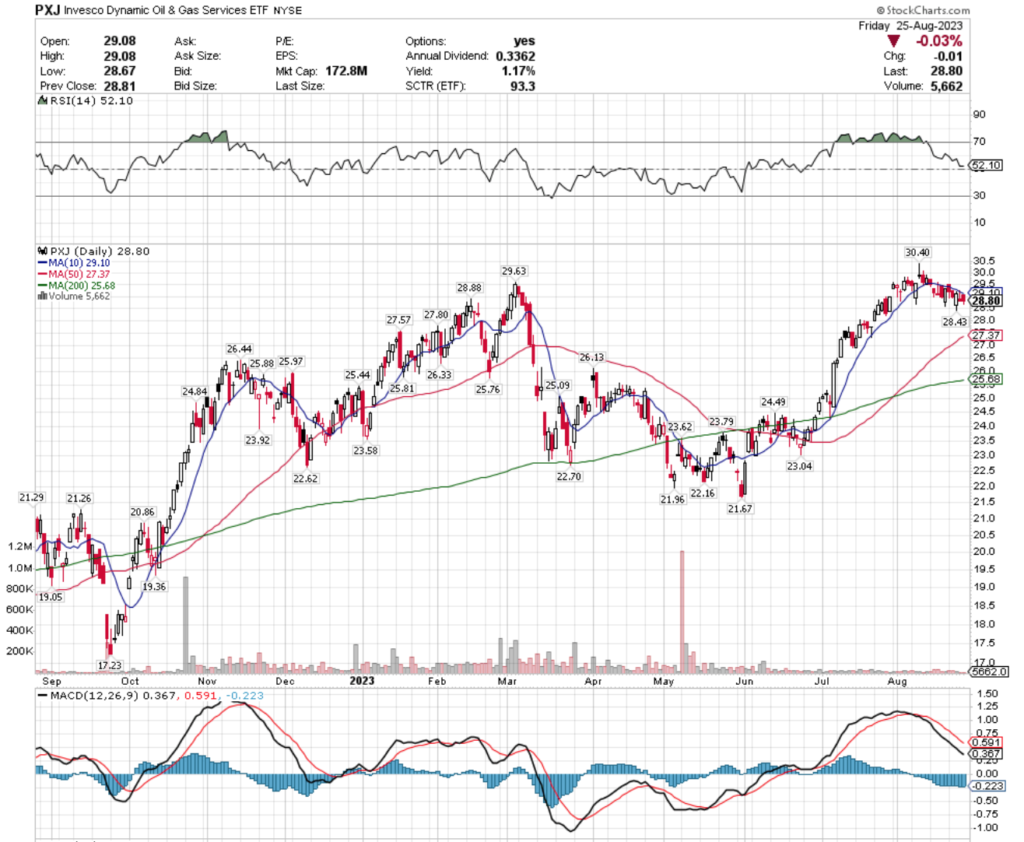
PXJ ETF – Invesco Dynamic Oil & Gas Services ETF’s Technical Performance Over The Past Year
Their MACD is bearish, with a neutral reading on their RSI at 52.1.
Last week’s volume was extremely light, -80.25% compared to the year prior’s average (13,511.6 vs. 68,428.64), as investors took a wait & see approach after the week prior’s profit taking from their recent 52-week high.
Their moving averages are going to be a key area to watch in the coming weeks, as their 10 DMA is adding downward pressure against their price & the 50 DMA will need to serve as a support level soon.
While they offer a 1.17% distribution yield, that is not much downside protection & investors should begin to think of hedging options in the event that the move to the downside continues, such as selling calls or buying puts.
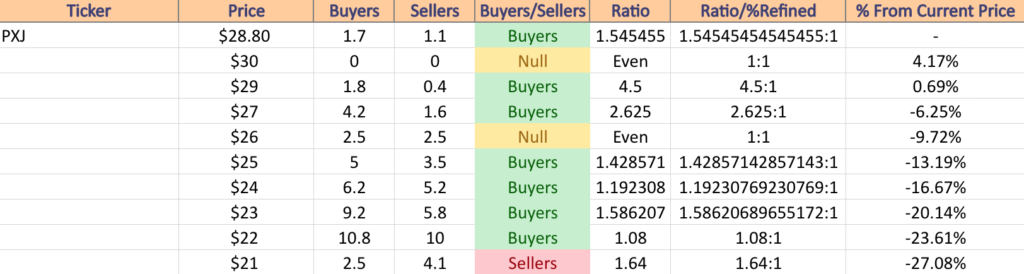
PXJ has support at the $28.43 (Volume Sentiment: Buyers, 1.55:1), $27.80 (Volume Sentiment: Buyers, 2.63:1), $27.57 (Volume Sentiment: Buyers, 2.63:1) & $27.37/share (50 Day Moving Average; Volume Sentiment: Buyers, 2.63:1), with resistance at the $28.88 (Volume Sentiment: Buyers, 1.55:1), $29.10 (10 Day Moving Average; Volume Sentiment: Buyers, 4.5:1), $29.63 (Volume Sentiment: Buyers, 4.5:1) & $30.40/share (52-Week High; Volume Sentiment: NULL, 0:0*) price levels.
PXJ ETF’s Price:Volume Sentiment Over The Past 4-5 Years
XHB, the SPDR S&P Homebuilders ETF has advanced +24.59% over the past year, climbing +49.71% since their 52-week low in October of 2022 (ex-distributions).
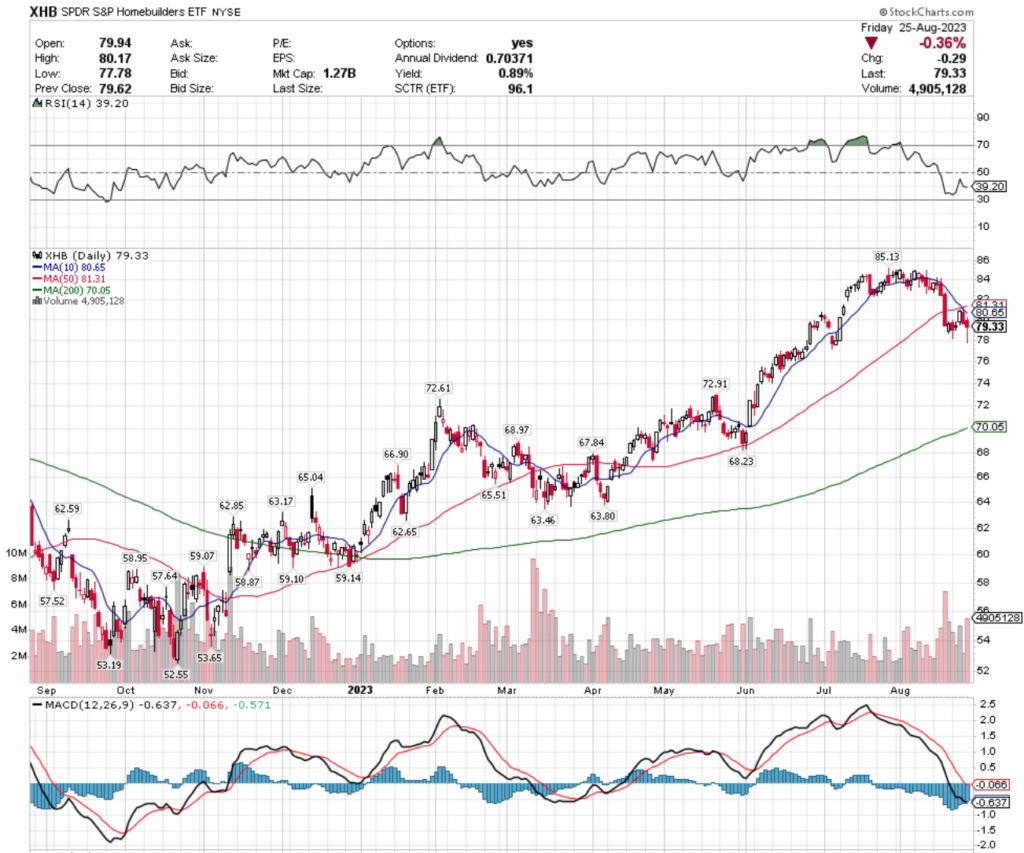
XHB ETF – SPDR S&P Homebuilders ETF’s Technical Performance Over The Past Year
Their RSI is trending towards oversold & currently sits at 39.2, with a bearish MACD.
Volumes jumped +16.78% this past week compared to the year prior’s average volume (3,666,170.4 vs. 3,139,319.25), but were not as severe as the prior week’s volumes when investors were taking profits from their recent 52-week high’s consolidation range.
Tuesday’s candlestick was a spinning top which signals indecision by investors & the week ended on an interesting note, as prices opened & closed near the highs of the day’s session, but did retreat below the $78 level for part of the day, which indicates that they may test that level again in the near-term.
It would be wise to look into a hedging strategy, such as selling calls or buying puts in the near-term, as their 0.89% distribution yield does not provide much protection against losses.
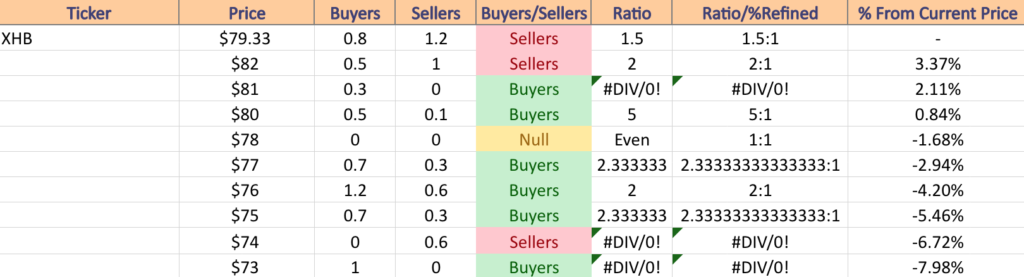
XHB has support at the $72.91 (Volume Sentiment: Buyers, 0.8:0*), $72.61 (Volume Sentiment: Buyers, 0.8:0*), $70.05 (200 Day Moving Average; Volume Sentiment: Buyers, 1.23:1) & $68.97/share (Volume Sentiment: Sellers, 2.05:1) price levels, with resistance at the $80.65 (10 Day Moving Average; Volume Sentiment: Buyers, 5:1), $81.31 (50 Day Moving Average; Volume Sentiment: Buyers, 0.3:0*) & $85.13/share (52-Week High; Volume Sentiment: Buyers, 0.2:0*) price levels.
XHB ETF’s Price:Volume Sentiment Over The Past 1-2 Years
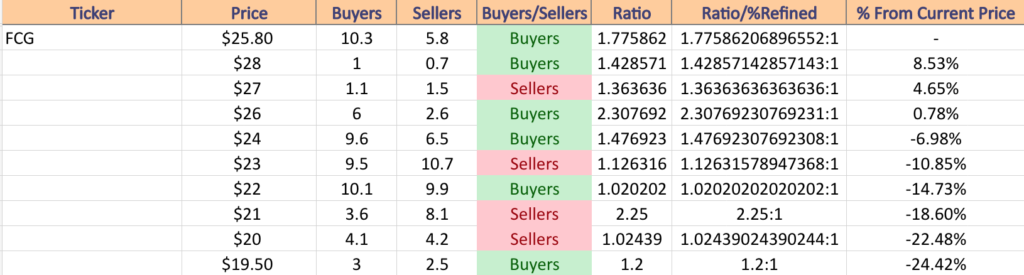
FCG, the First Trust Natural Gas ETF has dipped -2.05% over the past year, rising +26.97% from their 52-week low in March of 2023 (ex-distributions).
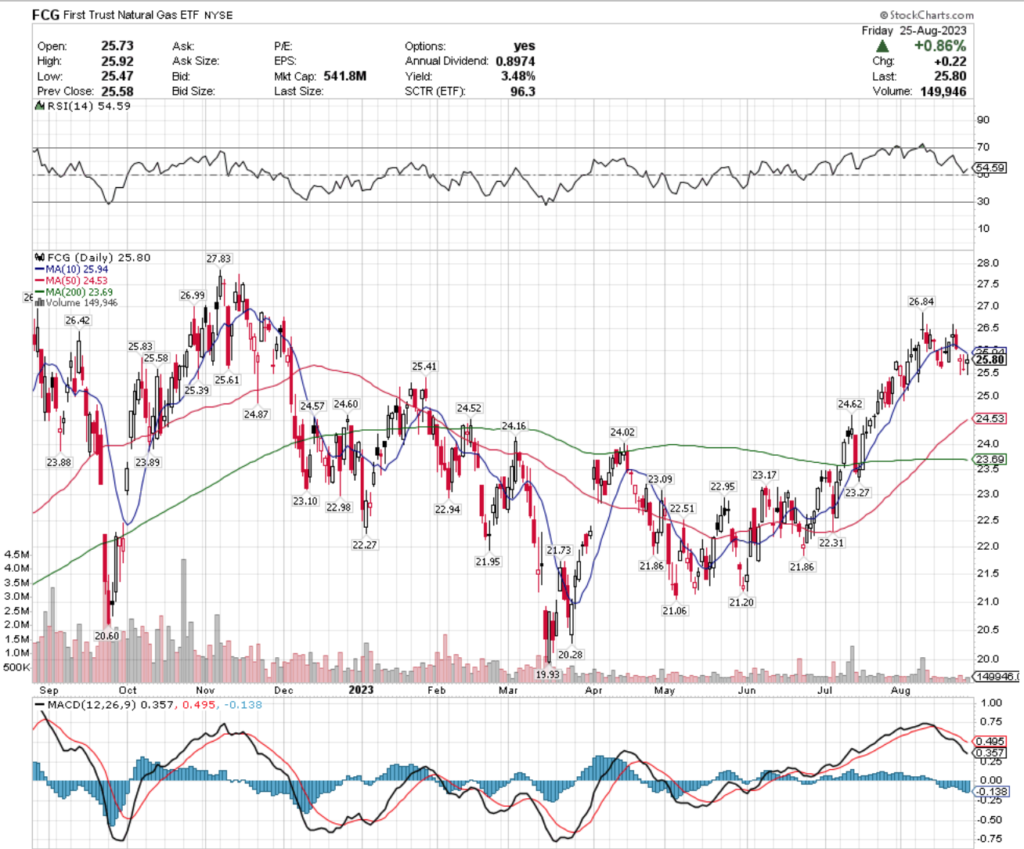
FCG ETF – First Trust Natural Gas ETF’s Technical Performance Over The Past Year
Their RSI is neutral at 54.59, but their MACD is bearish.
This past week’s volumes were -75.81% below average compared to the year prior (166,388.6 vs. 687,916.44) as investors took a breather to let the market sort out where FCG is currently valued.
Last week began on a spinning top, before a gap down on Wednesday that closed in a spinning top as there is still much uncertainty about their current value.
Thursday’s session closed in a gravestone doji which signals further declines are on the horizon & Friday’s spinning top’s high price was unable to penetrate the resistance of their 10-day moving average.
This makes it important to be looking for a near-term hedging strategy for any existing positions, as there are other signals of an impending decline on their chart.
FCG has support at the $25.61 (Volume Sentiment: Buyers, 1.78:1), $25.58 (Volume Sentiment: Buyers, 1.78:1), $25.41 (Volume Sentiment: Buyers, 1.78:1) & $25.39/share (Volume Sentiment Buyers, 1.78:1) price levels, with resistance at the $25.83 (Volume Sentiment: Buyers, 1.78:1), $25.94 (10 Day Moving Average; Volume Sentiment: Buyers, 1.78:1), $26.42 (Volume Sentiment: Buyers, 2.31:1) & $26.84/share (Volume Sentiment: Buyers, 2.31:1) price levels.
FCG ETF’s Price:Volume Sentiment Over The Past 6-7 Years
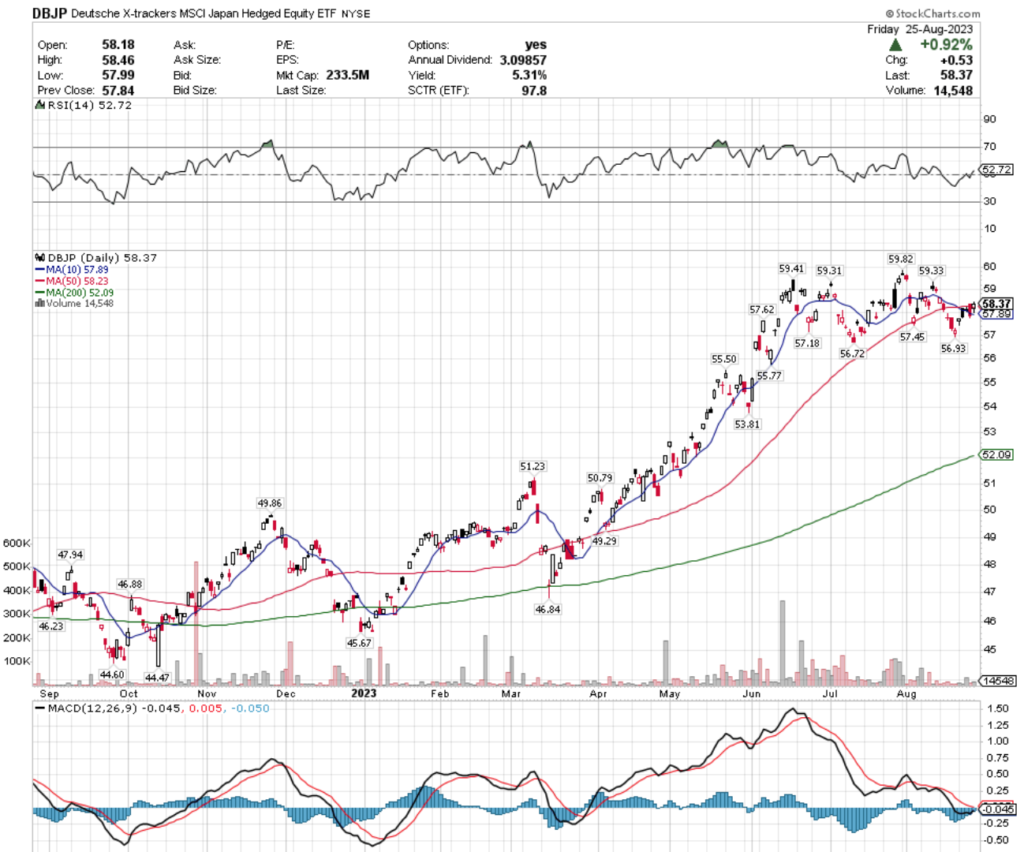
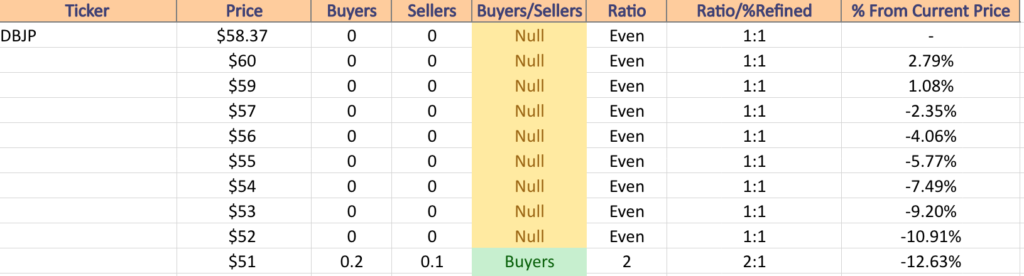
DBJP ETF – Deutsche X-trackers MSCI Japan Hedged Equity ETF’s Technical Performance Over The Past Year
Their RSI is currently neutral at 52.72 & their MACD is set to cross over bullishly in the coming days after they posted a positive week last week.
Volumes were down -48.76% this past week compared to the year prior (15,220.2 vs. 29,703.97) which casts a shadow of doubt on their performance last week, particular as Monday’s session kicked off with a gap up hanging man & Friday’s session ended in a spinning top.
Wednesday’s doji confirms additionally that there is still a lot to be uncertain about on the part of investors for DBJP.
Their 5.31% distribution yield for long-term holders is a decent amount of cushion against losses, but it would be wise to be vigilant & think about hedging options while waiting to see how they behave at their 10 & 50 day moving averages.
Their 10 DMA is currently below the price, but its angle does not look primed to provide much in the way of support, and the 50 DMA is acting as resistance.
DBJP has support at the $58.23 (50 Day Moving Average; Volume Sentiment: NULL, 0:0*), $57.89 (10 Day Moving Average; Volume Sentiment: NULL, 0:0*), $57.62 (Volume Sentiment: NULL, 0:0*) & $57.45/share (Volume Sentiment: NULL, 0:0*) price levels, with resistance at the $59.31 (Volume Sentiment: NULL, 0:0*), $59.33 (Volume Sentiment: NULL, 0:0*), $59.41 (Volume Sentiment: NULL, 0:0*) & $59.82/share (Volume Sentiment: NULL, 0:0*) price levels.
DBJP ETF’s Price:Volume Sentiment Over The Past 12-13 Years
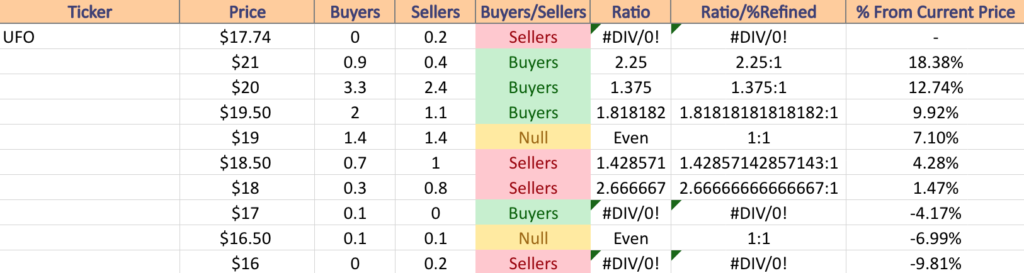
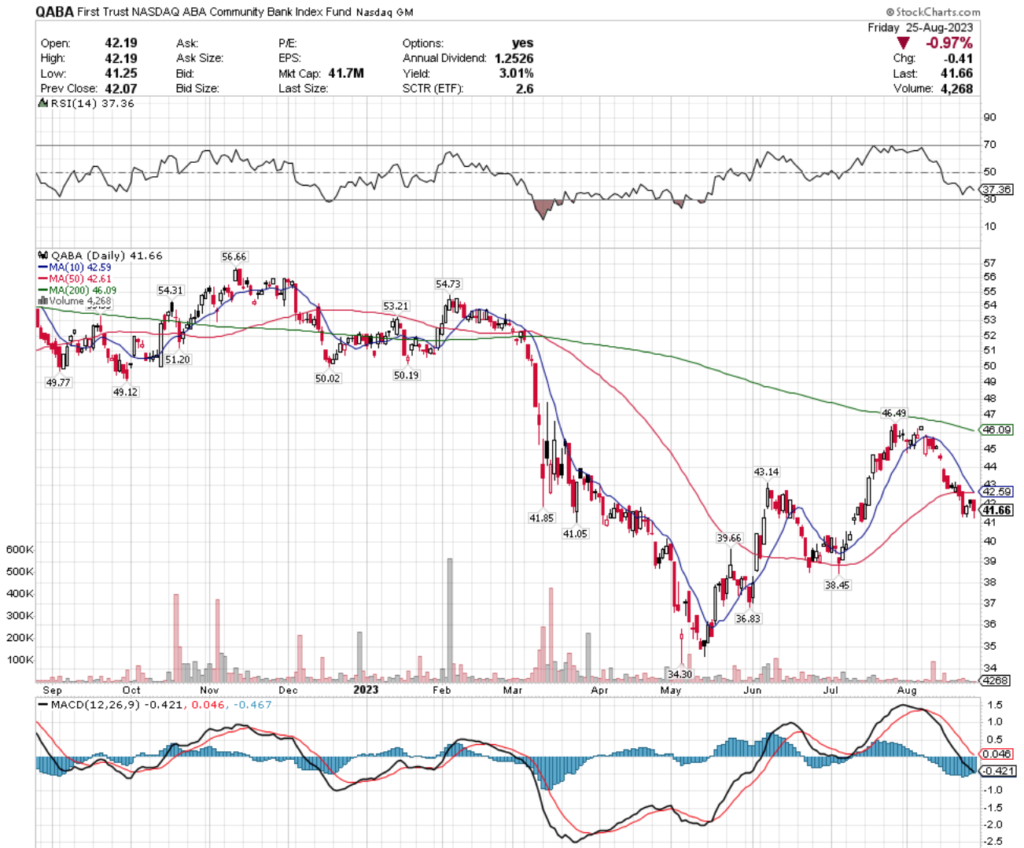
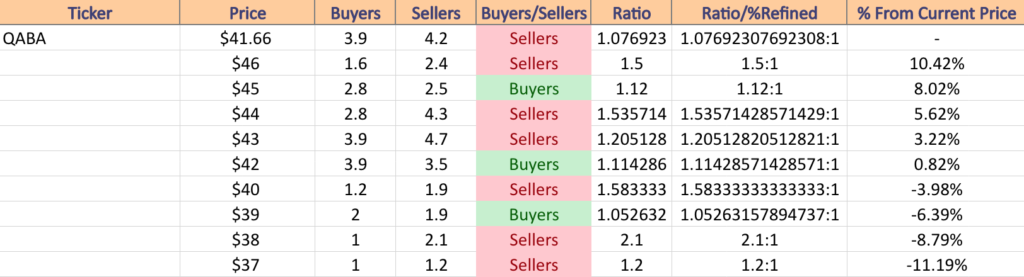
Real Estate (DRN), Hong Kong (EWH), Space (UFO) & Community Banks (QABA) Are All Bearishly Lagging The Market
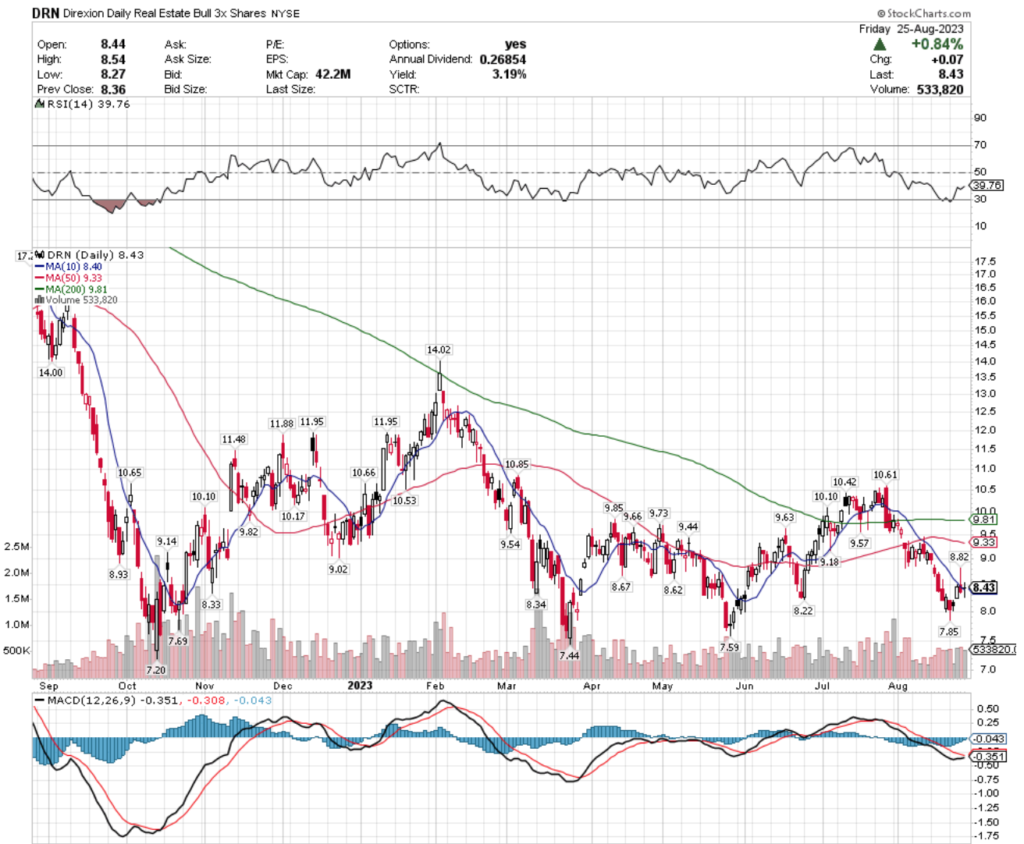
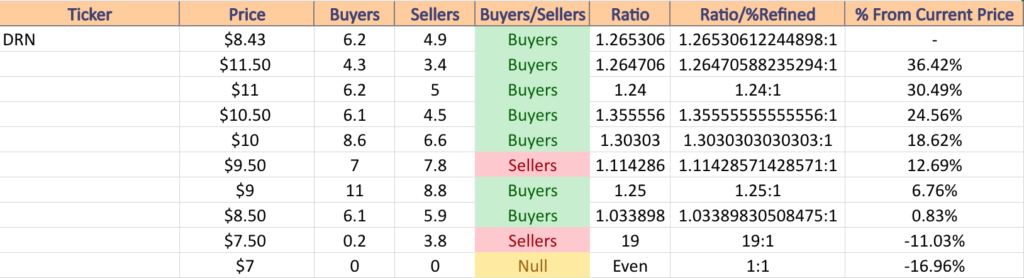
DRN, the Direxion Daily Real Estate Bull 3x ETF has fallen -51.12% over the past year, losing -52.51% since their 52-week high in August of 2022, but regaining +14.85% since their 52-week low in October of 2022 (ex-distributions).
DRN ETF – Direxion Daily Real Estate Bull 3x ETF’s Technical Performance Over The Past Year
Their RSI is currently trending back towards neutral after being oversold & sits at 39.76 & their MACD is primed to cross over bullishly in the coming days.
Last weeks trading volume was -13.58% below the past year’s average volume (500,369.2 vs. 578,975.18) which does little along the lines of confirming their rise in price.
Monday’s hammer candlestick paved the way for their short advance during the week, however Friday’s doji is not a sign of confidence among market participants for the near-term.
While they offer a 3.19% distribution yield, it would be smart to begin exploring what hedging options are available for the coming weeks.
DRN has support at the $8.40 (10 Day Moving Average; Volume Sentiment: Buyers, 1.27:1), $8.34 (Volume Sentiment: Buyers, 1.27:1), $8.33 (Volume Sentiment: Buyers, 1.27:1) & $8.22/share (Volume Sentiment: Buyers, 1.27:1) price levels, with resistance at the $8.62 (Volume Sentiment: Buyers, 1.03:1), $8.67 (Volume Sentiment: Buyers, 1.03:1), $8.82 (Volume Sentiment: Buyers, 1.03:1) & $8.93/share (Volume Sentiment: Buyers, 1.03:1) price levels.
DRN ETF’s Price:Volume Sentiment Over The Past 3-4 Years
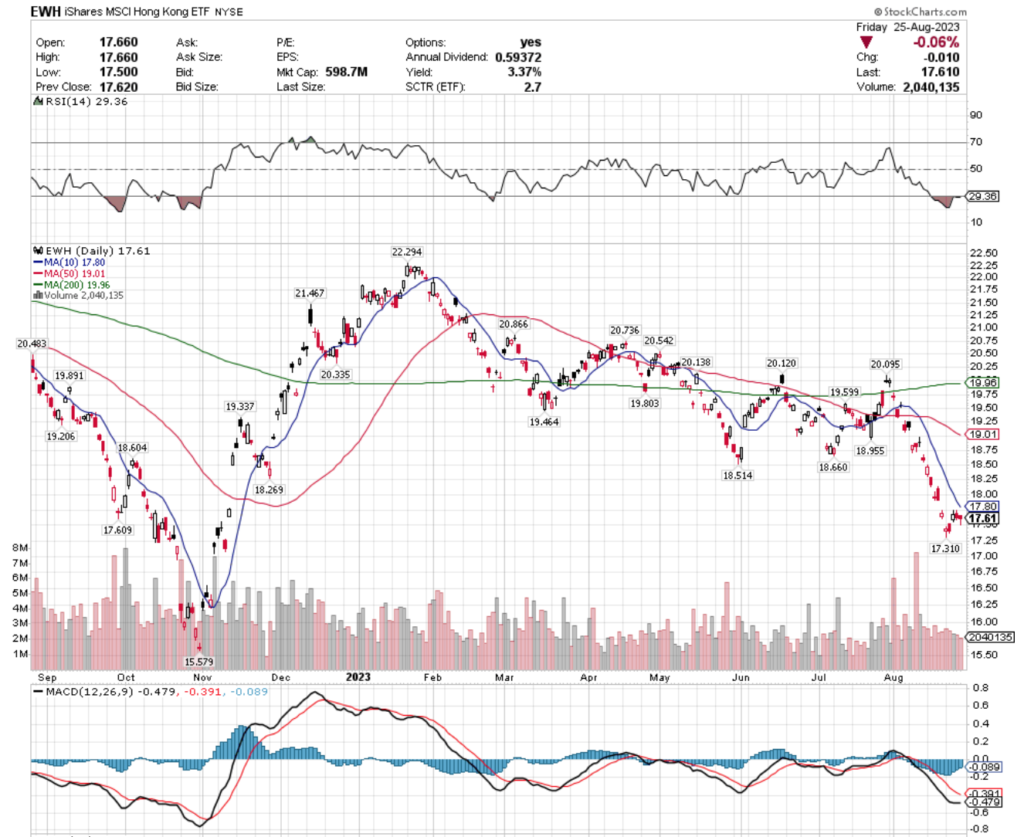
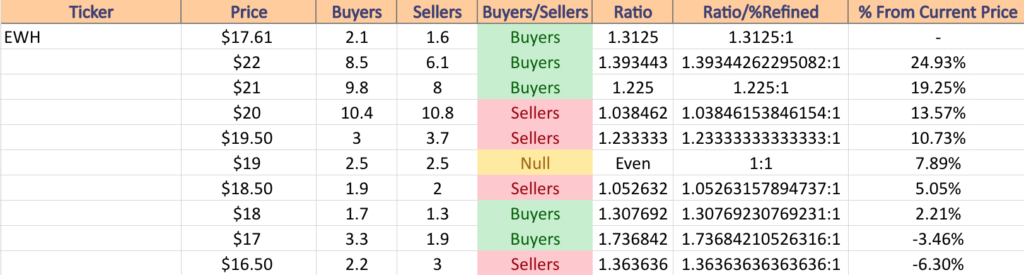
EWH, the iShares MSCI Hong Kong ETF has lost -13.29% over the past year, dropping -22.25% since their 52-week high in August of 2022, but reclaiming 9.79% since their 52-week low in October of 2022 (ex-distributions).
EWH ETF – iShares MSCI Hong Kong ETF’s Technical Performance Over The Past Year
Their RSI is in oversold territory at 29.36 with a bearish MACD after spending the month of August in decline.
Last week’s volume were -23.41% below par, compared to the past year’s average volume (2,385,526.6 vs. 3,114,788.62), as their share price was able to consolidate a bit & begin to establish a range to halt the decline.
Their 3.37% distribution yield provides some protection against further decline, but this is another instance of needing to tread lightly & wait & see where the market goes next while exploring hedging options.
EWH has support at the $17.60 (Volume Sentiment: Buyers, 1.31:1), $17.31 (Volume Sentiment: Buyers, 1.74:1) & $15.58/share (Volume Sentiment: Buyers, 1.03:1) price levels, with resistance at the $17.80 (10 Day Moving Average; Volume Sentiment: Buyers, 1.31:1), $18.27 (Volume Sentiment: Buyers, 1.31:1), $18.51 (Volume Sentiment: Sellers, 1.05:1) & $18.60/share (Volume Sentiment: Sellers, 1.05:1) price levels.
EWH ETF’s Price:Volume Sentiment Over The Past 19-20 Years
UFO, the Procure Space ETF has declined -16.98% over the past year, losing -18.92% since their 52-week high in August of 2022 & inching +0.74% from their recent 52-week low (ex-distributions).
UFO ETF – Procure Space ETF’s Technical Performance Over The Past Year
Their RSI is oversold at 26.61, with their MACD still in bearish freefall following a rough August.
Last week’s volume was -27.51% below the average volume for the past year (6,773 vs. 9,343.51), as investors became more cautious once their price got within 3% of their 52-week low.
Wednesday’s candle did flash a warning sign of additional declines as it was a gravestone doji, while we wait to see how Friday’s hammer candle sets the tone for this week.
They offer a 2.44% distribution yield, which will not provide much downside protection in the event that they do test their 52-week low in the near-term.
UFO has support at the $17.55 (Volume Sentiment: Sellers, 0.2:0*), $17.42 (Volume Sentiment: Buyers, 0.1:0*) & $17.35/share (Volume Sentiment: Buyers, 0.1:0*) price levels, with resistance at the $17.88 (Volume Sentiment: Sellers, 0.2:0*), $18.34 (Volume Sentiment: Sellers, 2.67:1), $18.36 (10 Day Moving Average; Volume Sentiment: Sellers, 2.67:1) & $18.45/share (Volume Sentiment: Sellers, 2.67:1) price levels.
UFO ETF’s Price:Volume Sentiment Over The Past 3-4 Years
QABA ETF – First Trust NASDAQ ABA Community Bank Index Fund ETF’s Technical Performance Over The Past Year
Their RSI is trending towards oversold territory & currently sits at 37.36 & their MACD is bearish.
Last week’s volume was -76.95% below the past year’s average (8,712.6 vs. 37,796.28), as investors mostly stood on the sidelines & watched their price dip under their 50 DMA & consolidate into a range just beneath it.
The 10 DMA is applying pressure from above which will be something to keep an eye on in the coming week.
Their 3.01% distribution yield offers some relief from further losses, but with their current chart layout this seems better suited to be watched for a while or to pursue hedging options to protect existing positions.
QABA has support at the $41.05 (Volume Sentiment: Sellers, 1.08:1), $39.66 (Volume Sentiment: Buyers, 1.05:1), $38.45 (Volume Sentiment: Sellers, 2:1) & $36.83/share (Volume Sentiment: Sellers, 10:1) price levels, with resistance at the $41.85 (Volume Sentiment: Sellers, 1.08:1), $42.59 (10 Day Moving Average; Volume Sentiment: Buyers, 1.11:1), $42.61 (50 Day Moving Average; Volume Sentiment: Buyers, 1.11:1) & $43.14/share (Volume Sentiment: Sellers, 1.21:1) price levels.
QABA ETF’s Price:Volume Sentiment Over The Past 4-5 Years
Tying It All Together
Monday has no economic data set to be reported, but HEICO will be reporting earnings.
Tuesday kicks the week off on the economic data front with S&P Case Shiller Home Price Index (20 Cities) at 9 am, followed by Job Openings & Consumer Confidence at 10 am.
Ambarella, American Woodmark, Best Buy, Big Lots, Box, Catalent, Donaldson, Hewlett Packard Enterprise, HP, J.M. Smucker, Malibu Boats, NIO, Pinduoduo, PVH & ZTO Express are all reporting earnings on Tuesday.
Wednesday starts with ADP Employment data at 8:15 am, followed by GDP (revision), Advanced U.S. Trade Balance In Goods, Advanced Retail Inventories & Advanced Wholesale Inventories data at 8:30 am & closes out with Pending Home Sales data at 10 am.
Salesforce, Brown-Forman, Chewy, Conn’s, Cooper, CrowdStrike, Five Below, MasterCraft, Okta, Patterson Companies, Veeva Systems & Victoria’s Secret all report earnings on Wednesday.
Thursday morning is a busy one, with Initial Jobless Claims, Personal Income (nominal), Personal Spending (nominal), PCE Index, Core PCE Index, PCE (year-over-year) & Core PCE (year-over-year) at 8:30 am & Chicago Business Barometer data at 9:45 am.
Thursday’s earnings calls include Dell Technologies, Lululemon Athletica, Academy Sports + Outdoors, Broadcom, BRP, Caleres, Campbell Soup, Dollar General, Genesco, Hello Group, Hormel Foods, MongoDB, Nutanix, Ollie’s Bargain Outlet, Signet Jewelers, Titan Machinery, VMWare & UBS.
Friday delivers the U.S. Nonfarm Payroll, U.S. Unemployment Rate, U.S. Hourly Wages, & Hourly Wages Year-over-Year data at 8:30 am, followed by ISM Manufacturing & Construction Spending data at 10 am & no scheduled major earnings reports.
See you back here next week!
**** I DO NOT OWN SHARES OR HAVE OPTIONS CONTRACT POSITIONS IN SPY, QQQ, IWM, DIA, PXJ, XHB, FCG, DBJP, DRN, EWH, UFO, or QABA AT THE TIME OF PUBLISHING THIS ARTICLE ***
Marriott International, Inc. stock trades under the ticker MAR & has had an excellent 2023, advancing +51.13% since their 52-week low in September of 2022.
They’ve declined -3.42% off of their 52-week high set in August of 2023, making it a great time to look at their current support levels & how strong investor sentiment was at each.
Given that there are only 2 support touch points between their current price & the next support zone, it will help market participants to understand how their price action moves in the coming days-to-weeks.
The Price:Volume analysis below seeks to display the volume at specific share-price levels from over the past one-to-two years & is intended to serve as a reference point for how investors viewed MAR stock’s value at each level.
It also includes a list of moving averages, as well as support & resistance levels, which will be marked in bold.
Marriott International, Inc. MAR Stock’s Price:Volume Sentiment Broken Down
Marriott International, Inc. MAR Stock’s Technical Performance Over The Past Year
Their RSI is on the overbought end of neutral at 57.13, with a MACD signaling bearish decline following some profit taking after they hit their 52-week high a couple of weeks ago.
Their trading volume over the past week & a half has been +15.11% above average compared to the year prior (2,217,112.5 vs. 1,926,009.96), confirming that investors were eager to take profits after the rally that led to the top that began back in June.
Their ATR is just below its average & trending lower, implying that there are more declines to come in the near future.
This is important to recognize, as their next support levels are $198.59 (-2.29%) & $191.78 (50-Day Moving Average; -5.64%) before they reach a support zone ~10% below their current price.
By understanding how market participants behaved at each price level that MAR stock has traded at over the past 1-2 years, it is possible to gauge how they might behave in the face of additional near-term declines.
The following note outlines support/resistance levels from the past year, while also breaking down the ratio of buyers:sellers (or sellers:buyers) at each price level by percentage that they’ve traded at in the past 1-2 years.
The bold prices on the image below denote the moving average levels just listed & the bold entries in the list form of the analysis under the images include other levels of support.
Each corresponding price level using a ratio of Buyers:Sellers (or Sellers:Buyers), NULL values denote that there was not enough data, so the ratio would’ve been 0:0.
Ratios with a 0 for the denominator/constant are denoted with an *, but are reported as is, as we are accounting for volume/sentiment.
Marriott International, Inc. MAR Stock’s Support & Resistance Levels Over The Past 1-2 Years With Price:Volume Level Sentiment
Marriott International, Inc. MAR Stock’s Support & Resistance Levels Over The Past 1-2 Years With Price:Volume Level Sentiment
Marriott International, Inc. MAR Stock’s Support & Resistance Levels Over The Past 1-2 Years With Price:Volume Level Sentiment
Marriott International, Inc. MAR Stock’s Support & Resistance Levels Over The Past 1-2 Years With Price:Volume Level Sentiment
Marriott International, Inc. MAR Stock’s Volume By Price Level
$212 – NULL – 0:0*; +4.31% From Current Price Level
$208 – NULL – 0:0*; +2.34% From Current Price Level
$204 – NULL – 0:0*; +0.37% From Current Price Level – 10 Day Moving Average
$200 – NULL – 0:0*; -1.6% From Current Price Level
$198 – NULL – 0:0*; -2.58% From Current Price Level
$196 – NULL – 0:0*; -3.57% From Current Price Level
$194 – NULL – 0:0*; -4.55% From Current Price Level
$192 – NULL – 0:0*; -5.54% From Current Price Level
$190 – NULL – 0:0*; -6.52% From Current Price Level – 50 Day Moving Average
$188 – NULL – 0:0*; -7.5% From Current Price Level
$186 – NULL – 0:0*; -8.49% From Current Price Level
$184 – Buyers – 2.07:1; -9.47% From Current Price Level
$182 – Buyers – 1.1:0*; -10.46% From Current Price Level
$180 – Buyers – 2.75:1; -11.44% From Current Price Level
$178 – Buyers – 2.44:1; -12.42% From Current Price Level
$176 – Buyers – 1.44:1; -13.41% From Current Price Level
$174 – Sellers – 1.26:1; -14.39% From Current Price Level
$172 – Buyers – 1.2:1; -15.38% From Current Price Level
$170 – Sellers – 1.35:1; -16.36% From Current Price Level – 200 Day Moving Average
$168 – Sellers – 1.49:1; -17.34% From Current Price Level
$166 – Buyers – 1.09:1; -18.33% From Current Price Level
$164 – Buyers – 4.73:1; -19.31% From Current Price Level
$162 – Buyers – 1.39:1; -20.3% From Current Price Level
$160 – Buyers – 1.48:1; -21.28% From Current Price Level
$158 – Sellers – 1.43:1; -22.26% From Current Price Level
$156 – Sellers – 1.16:1; -23.25% From Current Price Level
$154 – Sellers – 1.23:1; -24.23% From Current Price Level
$152 – Buyers – 1.33:1; -25.22% From Current Price Level
$150 – Sellers – 1.42:1; -26.2% From Current Price Level
$148 – Sellers – 1.12:1; -27.18% From Current Price Level
$146 – Sellers – 1.17:1; -28.17% From Current Price Level
$144 – Sellers – 2.8:0*; -29.15% From Current Price Level
$142 – Buyers – 2.12:1; -30.14% From Current Price Level
$140 – Buyers – 2.09:1; -31.12% From Current Price Level
$138 – Sellers – 2.28:1; -32.1% From Current Price Level
$136 – Sellers – 1.37:1; -33.09% From Current Price Level
$134 – Sellers – 3.7:0*; -34.07% From Current Price Level
$132 – Sellers – 0.8:0*; -35.06% From Current Price Level
$130 – Sellers – 1.2:0*; -36.04% From Current Price Level
$128 – NULL – 0:0*; -37.02% From Current Price Level
Tying It All Together
The list & image above paint the picture as to how investors & traders have behaved at various price levels that MAR has been at over the past one-to-two years.
It is not meant to serve as investment/trading advice, and is simply a way to visualize what investor/trader sentiment has been like at each of the price levels mentioned, as well as what it was at levels of support & resistance that are denoted in the image & list.
As always, do your own due diligence before making investing/trading decisions.
For more on the methodology on how the data was collected & put together, please refer to our original Price:Volume analysis.
*** I DO NOT OWN SHARES OR OPTIONS CONTRACT POSITIONS IN MAR AT THE TIME OF PUBLISHING THIS ARTICLE ***
Palo Alto Networks Inc. stock trades under the ticker PANW & has advanced +77.4% from their 52-week low in January of 2023.
August has been an interesting month for them, kicking off the month with an -8% gap down, but gapping up +14.75% this past Monday.
While they’re shy of their 52-week high, it is worthwhile to examine their volume sentiment at each price level that they’ve traded at in the past 1-2 years in order to get a better understanding of how their shares may trade in the coming months.
It is particularly important as it may give insight into how they’ll trade as their price approaches the windows created by the two aforementioned gaps.
The Price:Volume analysis below seeks to display the volume at specific share-price levels from over the past two-to-three years & is intended to serve as a reference point for how investors viewed PANW stock’s value at each level.
It also includes a list of moving averages, as well as support & resistance levels, which will be marked in bold.
Palo Alto Networks Inc. PANW Stock’s Price:Volume Sentiment Broken Down
Palo Alto Networks Inc. PANW Stock’s Technical Performance Over The Past Year
Their RSI is currently neutral at 54.2 & their MACD is slightly bullish following Monday’s gap up session.
Their average true range is signaling that they will see a decline in the near-term, or at least some rangebound activity around their current price level.
Volumes over the past week & a half have been +51.82% higher than the average volume for the past year (7,307,033.51 vs. 4,812,866.01), signaling that investor sentiment was strong on last Friday & Monday of this week, which may lead to some profit taking in the near-term.
Looking in the windows created by the gap we can see that there are 2 support levels that are near the current price level, with the nearest support near the bottom of the gap getting help from the 10 day moving average in the coming week, which may help them in the event of decline.
Yesterday’s bearish engulfing candlestick is a cause for concern however & market participants would be wise to keep a close eye on PANW in the coming days-to-weeks.
The bold prices on the image below denote the moving average levels just listed & the bold entries in the list form of the analysis under the images include other levels of support.
Each corresponding price level using a ratio of Buyers:Sellers (or Sellers:Buyers), NULL values denote that there was not enough data, so the ratio would’ve been 0:0.
Ratios with a 0 for the denominator/constant are denoted with an *, but are reported as is, as we are accounting for volume/sentiment.
Palo Alto Networks Inc. PANW Stock’s Support & Resistance Levels Over The Past 1-2 Years With Price:Volume Level Sentiment
Palo Alto Networks Inc. PANW Stock’s Support & Resistance Levels Over The Past 1-2 Years With Price:Volume Level Sentiment
Palo Alto Networks Inc. PANW Stock’s Support & Resistance Levels Over The Past 1-2 Years With Price:Volume Level Sentiment
Palo Alto Networks Inc. PANW Stock’s Support & Resistance Levels Over The Past 1-2 Years With Price:Volume Level Sentiment
Palo Alto Networks Inc. PANW Stock’s Volume By Price Level
$260 – NULL – 0:0*; +10.85% From Current Price Level
$256 – Buyers – 0.8:0*; +9.14% From Current Price Level
$252 – Buyers – 1.5:1; +7.44% From Current Price Level
$248 – Buyers – 9.6:1; +5.73% From Current Price Level
$244 – Buyer s- 5.5:1; +4.02% From Current Price Level
$240 – Buyers – 1.46:1; +2.32% From Current Price Level
$236 – Buyers – 1.57:1; +0.61% From Current Price Level – 50 Day Moving Average
$232 – Sellers – 3.55:1; -1.09% From Current Price Level
$228 – Buyers – 1:0*; -2.8% From Current Price Level
$224 – Buyers – 2.78:1; -4.5% From Current Price Level
$220 – Buyers – 1.25:1; -6.21% From Current Price Level
$216 – Sellers – 1.29:1; -7.91% From Current Price Level – 10 Day Moving Average
$212 – Buyers – 1.26:1; -9.62% From Current Price Level
$208 – Buyers – 2.07:1; -11.32% From Current Price Level
$204 – Buyers 4.56:1; -123.03% From Current Price Level
$200 – Buyers – 2:1; -14.73% From Current Price Level
$198 – Buyer s- 2.5:0*; -15.59% From Current Price Level
$196 – Sellers – 1.13:1; -16.44% From Current Price Level
$194 – Buyers 2:1; -17.29% From Current Price Level
$192 – Buyers – 2.22:1; -18.14% From Current Price Level
$190 – Sellers – 1.07:1; -19% From Current Price Level – 200 Day Moving Average
$188 – Buyers – 1.91:1; -19.85% From Current Price Level
$186 – Sellers – 1.07:1; -20.7% From Current Price Level
$184 – Buyers 1.15:1; -21.56% From Current Price Level
$182 – Sellers – 1.73:1; -22.41% From Current Price Level
$180 – Buyers – 1.17:1; -23.26% From Current Price Level
$178 – Sellers – 1.14:1; -24.11% From Current Price Level
$176 – Buyers – 1.16:1; -24.97% From Current Price Level
$174 – Sellers – 1.5:1; -25.82% From Current Price Level
$172 – Sellers – 1.15:1; -26.67% From Current Price Level
$170 – Buyers – 1.12:1; -27.52% From Current Price Level
$168 – Sellers – 2.74:1; -28.38% From Current Price Level
$166 – Sellers – 1.16:1; -29.23% From Current Price Level
$164 – Sellers – 1.08:1; -30.08% From Current Price Level
$162 – Buyers – 5.64:1; -30.93% From Current Price Level
$160 – Sellers – 8.5:1; -31.79% From Current Price Level
$158 – Buyers – 2.08:1; -32.64% From Current Price Level
$156 – Sellers – 3.2:1; -33.49% From Current Price Level
$154 – Sellers – 2.18:1; -34.35% From Current Price Level
$152 – Sellers – 1:0*; -35.2% From Current Price Level
$150 – Buyers – 1.11:1; -36.05% From Current Price Level
$148 – Sellers – 2.78:1; -36.9% From Current Price Level
$146 – Buyers – 1.86:1; -37.76% From Current Price Level
$144 – Buyers – 1:0*; -38.61% From Current Price Level
$142 – Sellers – 2.7:1; -39.46% From Current Price Level
$140 – Sellers – 2.13:1; -40.31% From Current Price Level
$138 – Buyers – 1.13:1; -41.17% From Current Price Level
$136 – Sellers – 1.71:1; -42.02% From Current Price Level
$134 – Sellers – 2.88:1; -42.87% From Current Price Level
$132 – NULL – 0:0*; -43.72% From Current Price Level
Tying It All Together
The list & image above paint the picture as to how investors & traders have behaved at various price levels that PANW has been at over the past one-to-two years.
It is not meant to serve as investment/trading advice, and is simply a way to visualize what investor/trader sentiment has been like at each of the price levels mentioned, as well as what it was at levels of support & resistance that are denoted in the image & list.
As always, do your own due diligence before making investing/trading decisions.
For more on the methodology on how the data was collected & put together, please refer to our original Price:Volume analysis.
*** I DO NOT OWN SHARES OR OPTIONS CONTRACT POSITIONS IN PANW AT THE TIME OF PUBLISHING THIS ARTICLE ***
Akamai Technologies, Inc. stock trades under the ticker AKAM & has advanced +43.92% since their 52-week low in March of 2023.
After making a fresh new 52-week high last week & seeing their oscillators it is time to check in with how their volume has been at each price level that they’ve traded at in recent history (past 1-2 years).
Given the +8.47% gap up they experienced last week having limited support within the window (with exception to their 10 day moving average & a couple of other touch-points towards the lower end of the window), it becomes even more important to understand how market participants have viewed their valuation at various price levels, as there is otherwise unstable footing at their recent price levels.
The Price:Volume analysis below seeks to display the volume at specific share-price levels from over the past two-to-three years & is intended to serve as a reference point for how investors viewed AKAM stock’s value at each level.
It also includes a list of moving averages, as well as support & resistance levels, which will be marked in bold.
Akamai Technologies, Inc. AKAM Stock’s Price:Volume Sentiment Broken Down
Akamai Technologies, Inc. AKAM Stock’s Technical Performance Over The Past Year
As noted above, their oscillators are signaling impending declines with their RSI just returning from overbought levels at 67.61 & their MACD is beginning to curl over into a bearish reversal.
Their trading volumes over the past week & a half have increased by +90.59% compared to the past year’s average volume as market participants were eager to get involved in the gap up & have remained eager to take profits off of the table (2,938,294.5 vs. 1,541,687.92), which is flashing signals of an impending reversal in sentiment/a continuation of the past few days’ declines.
AKAM’s 50 day moving average is lagging their 10 day moving average by -6.4% & will likely not be able to provide extra support within the window unless they establish a temporary consolidation range in the meantime, leaving them limited support in the window, especially given that their second highest support level of the past 52-weeks will become less relevant by the end of the week as it is nearing 52-weeks old.
Their range for the gap-up day was very wide, but the real body of the candlestick for that day is a fraction of said range, followed by two bullish spinning tops that have upper wicks just slightly higher above being hanging man candles, indicating investors were becoming uncertain about their price level.
The declines began this week, with a dragonfly doji on Monday, followed by a decline Tuesday that was pumped up to have a higher close than open & Wednesday’s session’s real body indicates further declines on the horizon.
With all of these factors in mind, it becomes even more apparent that having an understanding of their price:volume sentiment is essential in the coming weeks.
The bold prices on the image below denote the moving average levels just listed & the bold entries in the list form of the analysis under the images include other levels of support.
Each corresponding price level using a ratio of Buyers:Sellers (or Sellers:Buyers), NULL values denote that there was not enough data, so the ratio would’ve been 0:0.
Ratios with a 0 for the denominator/constant are denoted with an *, but are reported as is, as we are accounting for volume/sentiment.
Akamai Technologies, Inc. AKAM Stock’s Support & Resistance Levels Over The Past 1-2 Years With Price:Volume Level Sentiment
Akamai Technologies, Inc. AKAM Stock’s Support & Resistance Levels Over The Past 1-2 Years With Price:Volume Level Sentiment
Akamai Technologies, Inc. AKAM Stock’s Support & Resistance Levels Over The Past 1-2 Years With Price:Volume Level Sentiment
Akamai Technologies, Inc. AKAM Stock’s Support & Resistance Levels Over The Past 1-2 Years With Price:Volume Level Sentiment
Akamai Technologies, Inc. AKAM Stock’s Volume By Price Level
$124 – NULL – 0:0*; +21.32% From Current Price Level
$122 – NULL – 0:0*; +19.36% From Current Price Level
$120 – Buyers – 2.92:1; +17.41% From Current Price Level
$118 – Sellers – 1.64:1; +15.45% From Current Price Level
$116 – Buyers – 2.53:1; +13.49% From Current Price Level
$114 – Sellers – 1.15:1; +11.54% From Current Price Level
$112 – Buyers – 1.86:1; +9.58% From Current Price Level
$110 – Buyers – 3.08:1; +7.62% From Current Price Level
$108 – Buyers – 2.85:1; +5.66% From Current Price Level
$106 – Sellers – 1.2:0*; +3.71% From Current Price Level
$104 – Sellers – 3:1; +1.75% From Current Price Level
$102 – Sellers – 1.93:1; -0.21% From Current Price Level
$100 – Sellers – 1.4:1; -2.16% From Current Price Level
$99 – Sellers – 1.5:1; -3.14% From Current Price Level
$98 – Buyers – 1.84:1; -4.12% From Current Price Level – 10 Day Moving Average
$97 – Sellers – 1.17:1; -5.1% From Current Price Level
$96 – Buyers – 2.85:1; -6.08% From Current Price Level
$95 – Buyers – 1.36:1; -7.05% From Current Price Level
$94 – Buyers – 3.45:1; -8.03% From Current Price Level
$93 – Buyers – 2.28:1; -9.01% From Current Price Level – 50 Day Moving Average
$92 – Sellers – 1.25:1; -9.99% From Current Price Level
$91 – Sellers – 1.94:1; -10.97% From Current Price Level
$90 – Sellers – 1.6:1; -11.95% From Current Price Level
$89 – Buyers – 1.61:1; -12.92% From Current Price Level
$88 – Buyers – 1.21:1; -13.9% From Current Price Level
$87 – Sellers – 1.32:1; -14.88% From Current Price Level
$86 – Sellers – 2.05:1; -15.86% From Current Price Level – 200 Day Moving Average
$85 – Sellers – 1.02:1; -16.84% From Current Price Level
$84 – Sellers – 1.02:1; -17.82% From Current Price Level
$83 – Buyers – 2.03:1; -18.79% From Current Price Level
$82 – Sellers – 2.3:1; -19.77% From Current Price Level
$81 – Buyers – 2.5:1; -20.75% From Current Price Level
$80 – Sellers – 1.19:1; -21.73% From Current Price Level
$79 – Sellers – 2.43:1; -22.71% From Current Price Level
$78 – Sellers – 2.83:1; -23.69% From Current Price Level
$77 – Sellers – 3.75:1; -24.66% From Current Price Level
$76 – Buyers – 2.33:1; -25.64% From Current Price Level
$75 – Buyers – 3.64:1; -26.62% From Current Price Level
$74 – Sellers – 3:0*; -27.6% From Current Price Level
$73 – Buyers – 5:1; -28.58% From Current Price Level
$72 – Sellers – 1.83:1; -29.56% From Current Price Level
$71 – Buyers – 1.27:1; -30.54% From Current Price Level
$70 – NULL – 0:0*
Tying It All Together
The list & image above paint the picture as to how investors & traders have behaved at various price levels that AKAM has been at over the past one-to-two years.
It is not meant to serve as investment/trading advice, and is simply a way to visualize what investor/trader sentiment has been like at each of the price levels mentioned, as well as what it was at levels of support & resistance that are denoted in the image & list.
As always, do your own due diligence before making investing/trading decisions.
For more on the methodology on how the data was collected & put together, please refer to our original Price:Volume analysis.
*** I DO NOT OWN SHARES OR OPTIONS CONTRACT POSITIONS IN AKAM AT THE TIME OF PUBLISHING THIS ARTICLE ***
Eli Lilly & Co. stock trades under the ticker LLY & has had a remarkable past year, climbing 84.69% from their 52-week low in September of 2022 (ex-yields).
LLY has continued to climb higher after last week’s large gap up session & continues to establish new 52-week highs, making it an important time to check in & see how market participant sentiment has been at the various price levels they have traded at over the past one-to-two years.
By doing so, it will be easier to visualize what support levels may be stronger than others when LLY’s price corrects & people begin to take their profits down from the table.
The Price:Volume analysis below seeks to display the volume at specific share-price levels from over the past two-to-three years & is intended to serve as a reference point for how investors viewed LLY stock’s value at each level.
It also includes a list of moving averages, as well as support & resistance levels, which will be marked in bold.
Eli Lilly & Co. LLY Stock’s Price:Volume Sentiment Broken Down
Eli Lilly & Co. LLY Stock’s Technical Performance Over The Past Year
Their RSI is overbought following last week’s gap up session & their MACD is signaling very bullish & standing almost vertical.
One note on their RSI, earlier this year LLY traded from early April until almost the end of May with an RSI that was in overbought territory, however this was on steady day-over-day climbing & not due to a large gap up.
Last week’s volumes were 97.1% higher than the average volume for the past year (5,909,900 vs. 2,998,360), a signal of strength & conviction that confirms that 11.43% price gap up & continued strength.
It will be interesting to see what support levels look like by the time that the 10 day moving average comes closer to their share price, as the 10 DMA is currently about halfway through the gap traveling towards the price, while the 50 DMA still has yet to reach the window.
In the event of a correction in price that may pose a problem for market participants if the price is able to break below the 10 day moving average as there will not be support to stop the gap from filling.
Following Tuesday’s gap up, Wednesday continued the climb higher but ended on a spinning top, with Thursday’s inverted hammer sending the share price higher again on Friday & today.
Given everything mentioned above & that a 10% correction from the current price levels puts LLY at ~$484/share with only the 10 day moving average to act as support, it is important to have a breakdown of how they’ve traded at different price levels to see if that can provide clues to market behavior when there are no true support levels nearby.
The bold prices on the image below denote the moving average levels just listed & the bold entries in the list form of the analysis under the images include other levels of support.
Each corresponding price level using a ratio of Buyers:Sellers (or Sellers:Buyers), NULL values denote that there was not enough data, so the ratio would’ve been 0:0.
Ratios with a 0 for the denominator/constant are denoted with an *, but are reported as is, as we are accounting for volume/sentiment.
Eli Lilly & Co. LLY Stock’s Support & Resistance Levels Over The Past 1-2 Years With Price:Volume Level Sentiment
Eli Lilly & Co. LLY Stock’s Support & Resistance Levels Over The Past 1-2 Years With Price:Volume Level Sentiment
Eli Lilly & Co. LLY Stock’s Support & Resistance Levels Over The Past 1-2 Years With Price:Volume Level Sentiment
Eli Lilly & Co. LLY Stock’s Support & Resistance Levels Over The Past 1-2 Years With Price:Volume Level Sentiment
Eli Lilly & Co. LLY Stock’s Volume By Price Level
$540 – NULL – 0:0*; +2.22% From Current Price Level
$535 – NULL – 0:0*; +1.27% From Current Price Level
$530 – NULL – 0:0*; +0.33% From Current Price Level
$525 – Buyers – 1.8:0*; -0.62% From Current Price Level
$520 – Buyers – 5:0*; -1.57% From Current Price Level
$515 – NULL – 0:0*; -2.51% From Current Price Level
$510 – NULL – 0:0*; -3.46% From Current Price Level
$505 – NULL – 0:0*; -4.41% From Current Price Level
$500 – NULL – 0:0*; -5.35% From Current Price Level
$496 – NULL – 0:0*; -6.11% From Current Price Level
$492 – NULL – 0:0*; -6.87% From Current Price Level
$488 – NULL – 0:0*; -7.62% From Current Price Level
$484 – NULL – 0:0*; -8.38% From Current Price Level
$480 – NULL – 0:0*; -9.14% From Current Price Level – 10 Day Moving Average
$476 – NULL – 0:0*; -9.9% From Current Price Level
$472 – NULL – 0:0*; -10.65% From Current Price Level
$468 – Sellers – 1.1:0*; -11.41% From Current Price Level
$464 – Buyers – 2.8:0*; -12.17% From Current Price Level
$460 – Sellers – 2:1; -12.92% From Current Price Level
$456 – Buyers – 1.36:1; -13.68% From Current Price Level – 50 Day Moving Average
$452 – Buyer s- 1.31:1; -14.44% From Current Price Level
$448 – Buyers – 3.88:1; -15.2% From Current Price Level
$444 – Buyers – 1.07:1; -15.95% From Current Price Level
$440 – Buyers – 10:1; -16.71% From Current Price Level
$436 – Buyers – 1.48:1; -17.47% From Current Price Level
$432 – Sellers – 1.03:1; -18.23% From Current Price Level
$428 – Buyers – 5.3:0*; -18.98% From Current Price Level
$424 – Sellers – 1.39:1; -19.74% From Current Price Level
$420 – Sellers – 1.5:0*; -20.5% From Current Price Level
$416 – NULL – 0:0*; -21.25% From Current Price Level
$412 – NULL – 0:0*; -22.01% From Current Price Level
$408 – NULL – 0:0*; -22.77% From Current Price Level
$404 – Buyers – 1.3:0*; -23.53% From Current Price Level
$400 – Sellers – 1.2:0*; -24.28% From Current Price Level
$396 – NULL – 0:0*; -25.04% From Current Price Level
$392 – Buyers – 1.8:0*; -25.8% From Current Price Level
$388 – Buyers – 1.7:0*; -26.55% From Current Price Level
$384 – Buyers – 1.2:0*; -27.31% From Current Price Level – 200 Day Moving Average
$380 – Buyers – 1.67:1; -28.07% From Current Price Level
$376 – NULL – 0:0*; -28.83% From Current Price Level
$372 – Buyers – 1.47:1; -29.58% From Current Price Level
$368 – Buyers – 1.43:1; -30.34% From Current Price Level
$364 – Buyers – 2.2:1; -31.1% From Current Price Level
$360 – Buyers – 1.38:1; -31.85% From Current Price Level
$356 – Sellers – 1.08:1; -32.61% From Current Price Level
$352 – Sellers – 1.03:1; -33.37% From Current Price Level
$348 – Sellers – 1.03:1; -34.13% From Current Price Level
$344 – Sellers – 2.04:1; -34.88% From Current Price Level
$340 – Sellers – 1.26:1; -35.64% From Current Price Level
$336 – Buyers – 7.78:1; -36.4% From Current Price Level
$332 – Sellers – 1.43:1; -37.15% From Current Price Level
$328 – Buyers – 1.14:1; -37.91% From Current Price Level
$324 – Buyers – 1.29:1; -38.67% From Current Price Level
$320 – Buyers – 2.15:1; -39.43% From Current Price Level
$316 – Sellers – 1.11:1; -40.18% From Current Price Level
$312 – Sellers – 1.51:1; -40.94% From Current Price Level
$308 – Buyers – 2.5:1; -41.7% From Current Price Level
$304 – Sellers – 1.8:1; -42.45% From Current Price Level
$300 – Sellers – 1.41:1; -43.21% From Current Price Level
$296 – Sellers – 1.6:1; -43.97% From Current Price Level
$292 – Sellers – 1.4:1; -44.73% From Current Price Level
$288 – Buyers – 0.7:0*; -45.48% From Current Price Level
$284 – Sellers – 1.27:1; -46.24% From Current Price Level
$280 – NULL – 0:0*; -47% From Current Price Level
$276 – NULL – 0:0*; -47.75% From Current Price Level
Tying It All Together
The list & image above paint the picture as to how investors & traders have behaved at various price levels that LLY has been at over the past one-to-two years.
It is not meant to serve as investment/trading advice, and is simply a way to visualize what investor/trader sentiment has been like at each of the price levels mentioned, as well as what it was at levels of support & resistance that are denoted in the image & list.
As always, do your own due diligence before making investing/trading decisions.
For more on the methodology on how the data was collected & put together, please refer to our original Price:Volume analysis.
*** I DO NOT OWN SHARES OR OPTIONS CONTRACT POSITIONS IN LLY AT THE TIME OF PUBLISHING THIS ARTICLE ***