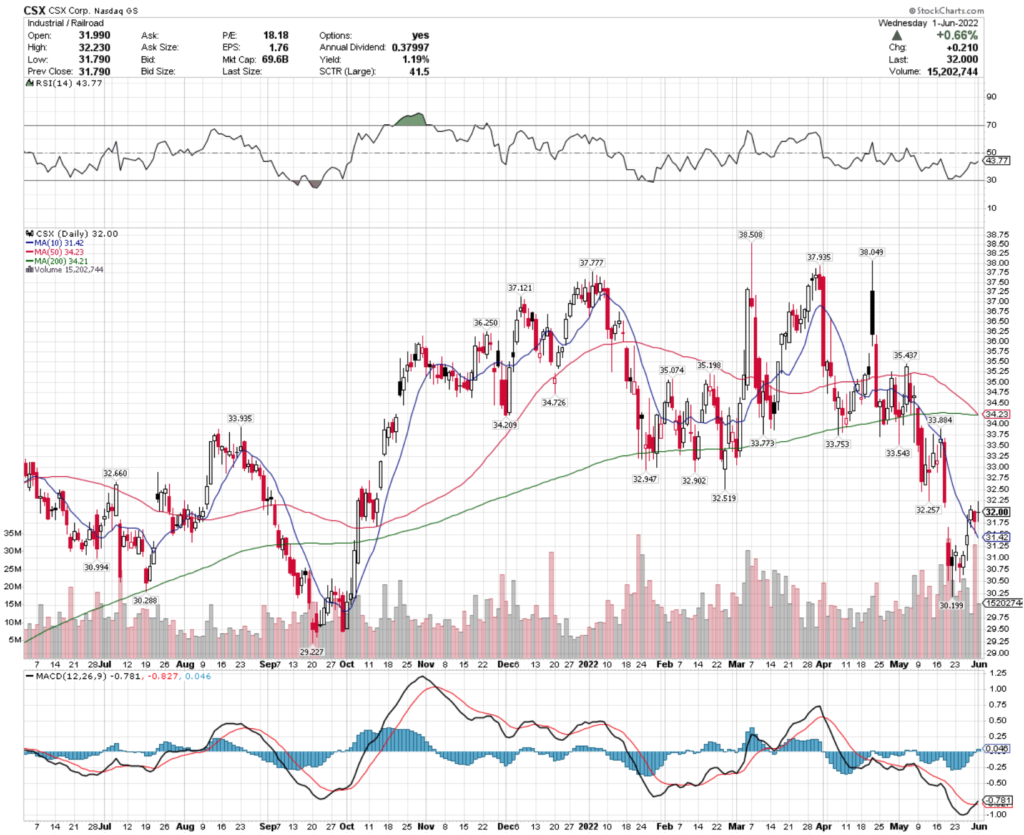
Yesterday, CSX stock completed a bullish MACD crossover, trading on higher than average volume compared to the year prior.
Their RSI is still on the oversold side of neutral, after gapping down a couple of weeks ago, signaling that there may be more momentum to come in the near-term.
They will need to break above the $32.257, $32.51 & $32.90/share resistance levels as they continue to climb higher.
CSX Corp. CSX Stock As A Long-Term Investment
Long-term focused investors will like CSX stock’s P/E (ttm) of 17.58, but may find their 5.1 P/B (mrq) to be a bit higher than they would like.
They recently reported 21.3% Quarterly Revenue Growth Y-o-Y, with 21.7% Quarterly Earnings Growth Y-o-Y.
Their balance sheet will require additional research, with $2.03B of Total Cash (mrq) & $16.81B in Total Debt (mrq).
CSX stock pays a 1.2% dividend yield, which looks sustainable in the long-term, as their payout ratio is 21.55%.
76.42% of CSX stock’s outstanding share float is owned by institutional investors.
CSX Corp. CSX Stock As A Short-Term Trade Using Options
Short-term oriented traders can use options to profit from movements in CSX stock’s price, while hedging against broader market volatility.
I am looking at the contracts with the 6/17 expiration date.
The $29.17, $30 & $30.83 call options all look appealing, although the former is the only strike price with over 1,000 contracts of open interest.
The $33.33, $33 & $32.50 put options also are worth looking into, with the $33 strike being the only sub-3,000 level open interest level of the three strike prices.
Tying It All Togther
CSX stock has many attributes that traders & investors are sure to like.
Investors will like their valuation & dividend yield, but may want to dig deeper into their balance sheet before beginning or adding to a position.
Traders will like their current momentum, and will be pleased with the liquidity of their options.
All-in-all, CSX stock is worth taking a closer look at to see how it fits into your portfolio strategy.
*** I DO NOT OWN SHARES OF CSX AT THE TIME OF PUBLISHING THIS ARTICLE ***
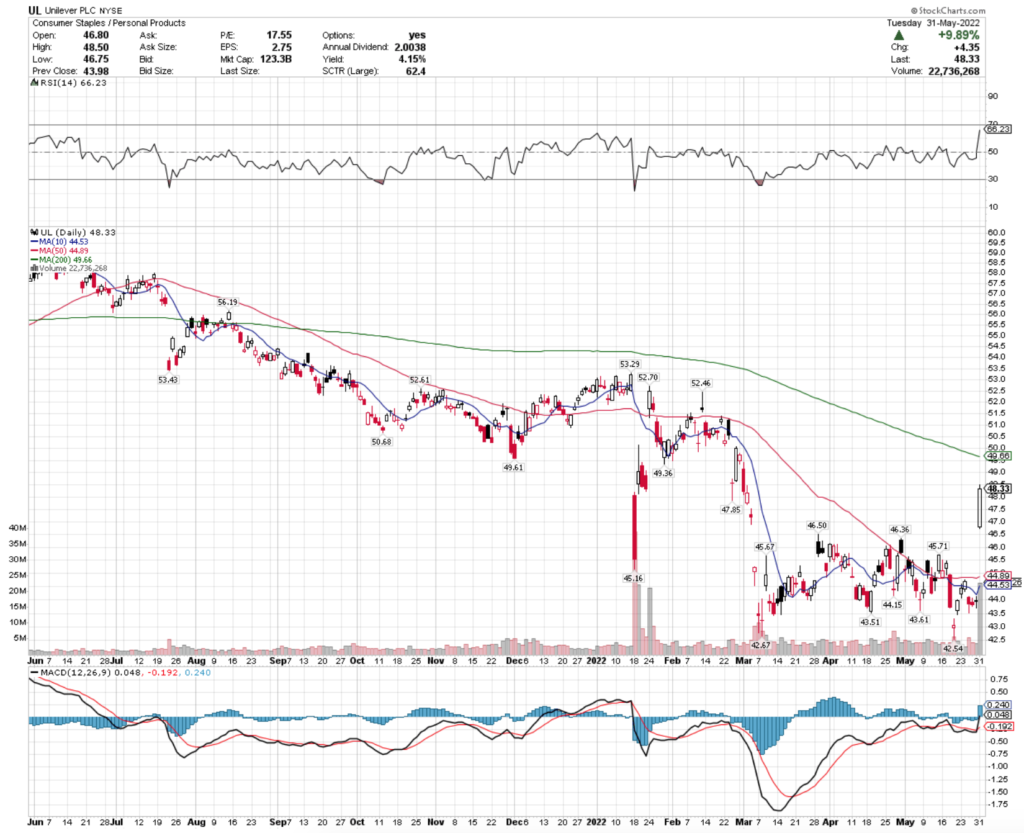
Unilever PLC stock trades under the ticker UL & has shown recent bullishness that traders & investors should take a closer look into.
UL stock closed at $48.33/share on 5/31/2022.
Unilever PLC UL Stock’s Technical Performance Broken Down
UL Stock Price: $48.33
10 Day Moving Average: $44.53
50 Day Moving Average: $44.89
200 Day Moving Average: $49.66
RSI: 66.23
MACD: -0.192
UL stock recently completed a bullish MACD crossover, and has been trading on above average volume in the last few months, compared to the year prior.
Yesterday’s 9.89% gap up brought their RSI to be much closer to overbought than it was the day before, and their 10 day moving average is <1% from their 50 day MA, signaling more bullish momentum to come in the near-term as they establish a new price range.
They will have to break above the $49.36 & $50.50/share resistance levels as it continues to climb higher.
Unilever PLC UL Stock As A Long-Term Investment
Long-term oriented investors will like UL stock’s P/E (ttm) of 18.25, but may find their P/B (mrq) of 6.33 to be a bit rich.
They recently reported 6.6% Quarterly Revenue Growth Y-o-Y, with 27.5% Quarterly Earnings Growth Y-o-Y.
Their balance sheet is worth taking a closer look into before making an investment, with $4.86B of Total Cash (mrq) & $30.13B in Total Debt (mrq).
UL stock pays a 3.95% dividend yield, which may become unstable over time, as their payout ratio is 73.44%.
9.55% of UL stock’s outstanding share float is owned by institutional investors.
Unilever PLC UL Stock As A Short-Term Trade Using Options
Short-term oriented traders can trade options to profit from UL stock’s price movements, while providing protection against losses.
I am looking at the contracts with the 6/17 expiration date.
The $47.50, $45 & $42.50 call options all look appealing, although the $42.50 strike is relatively illiquid compared to the other two.
The $55, $52.50 & $50 puts also look interesting, but are extremely illiquid with <300 contracts of open interest between the 3 strike prices.
Tying It All Together
UL stock has many interesting characteristics that traders & investors should find appealing.
Investors will like their dividend yield, although they may want to look closer into their balance sheet structure to see how their payout ratio may be impacted in the mid-to-long term.
Short-term traders will like UL stock’s current momentum, but will be disappointed by some of the open interest levels of some of their strike prices.
All-in-all, UL stock is worth taking a closer look into, to see how it fits into your portfolio strategy.
*** I DO NOT OWN SHARES OF UL STOCK AT THE TIME OF PUBLISHING THIS ARTICLE ***
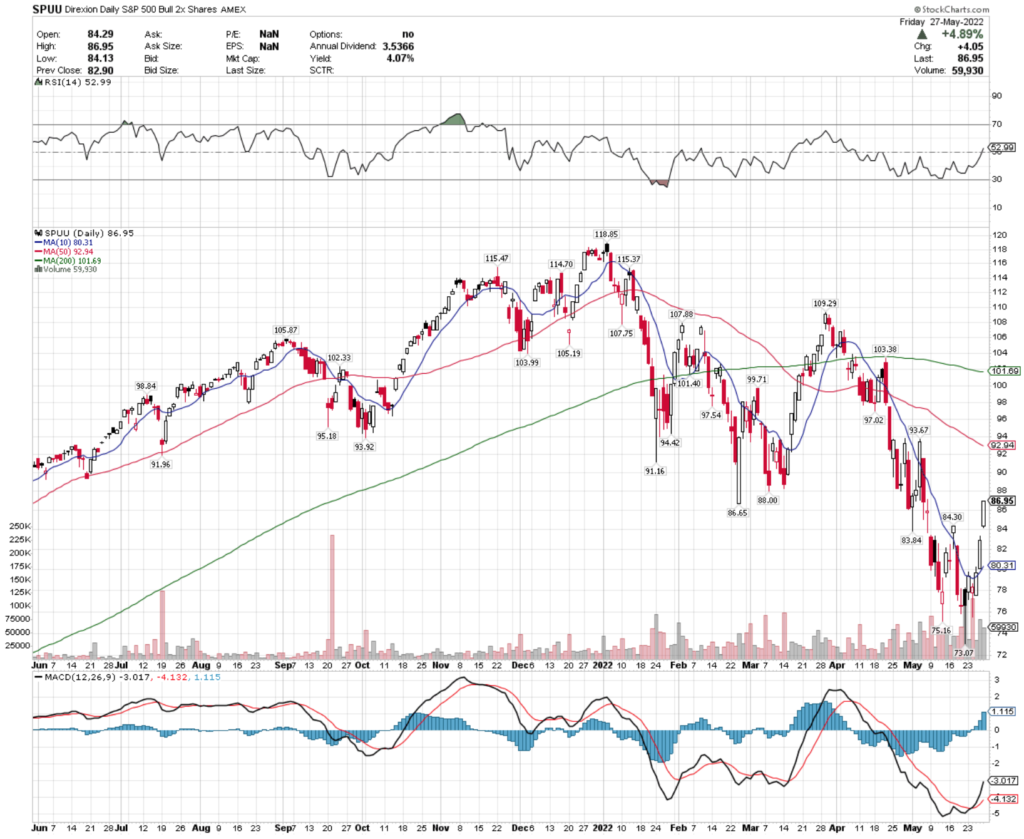
Last week we saw the major market indexes turn around a positive week for the first time in nearly 2 months.
While data being reported & earnings calls did not sound particularly more upbeat, investors felt more confident in taking on more risk, causing markets to rise.
While there was temporary relief, their chart does not look to be out of the woods just yet, and this upcoming week looks like we will see more selling than buying.
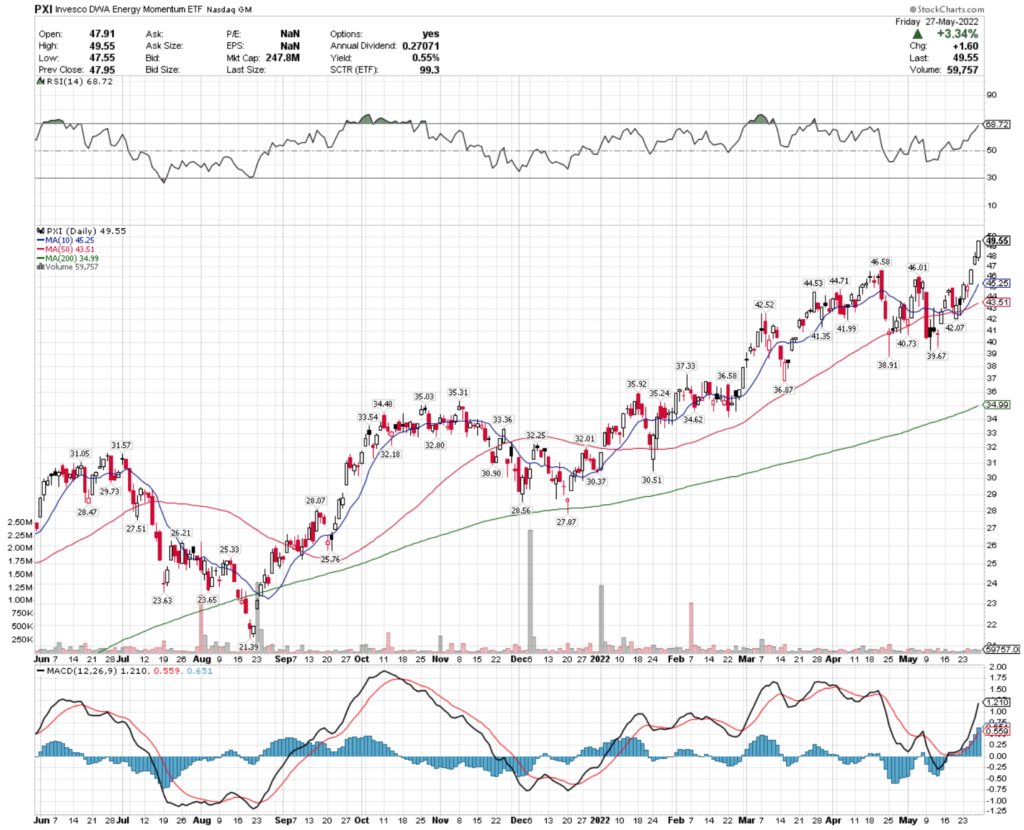
PXI does look to be cooling off though, as their 10 & 50 day moving averages are pulling tighter together, and their RSI is about to enter into overbought territory.
They look to be due for a shakeout in the near-term, which can be navigated using options as hedging protection, as long-only shares only provide a .55% cushion through their dividend for those who hold the position for a year.
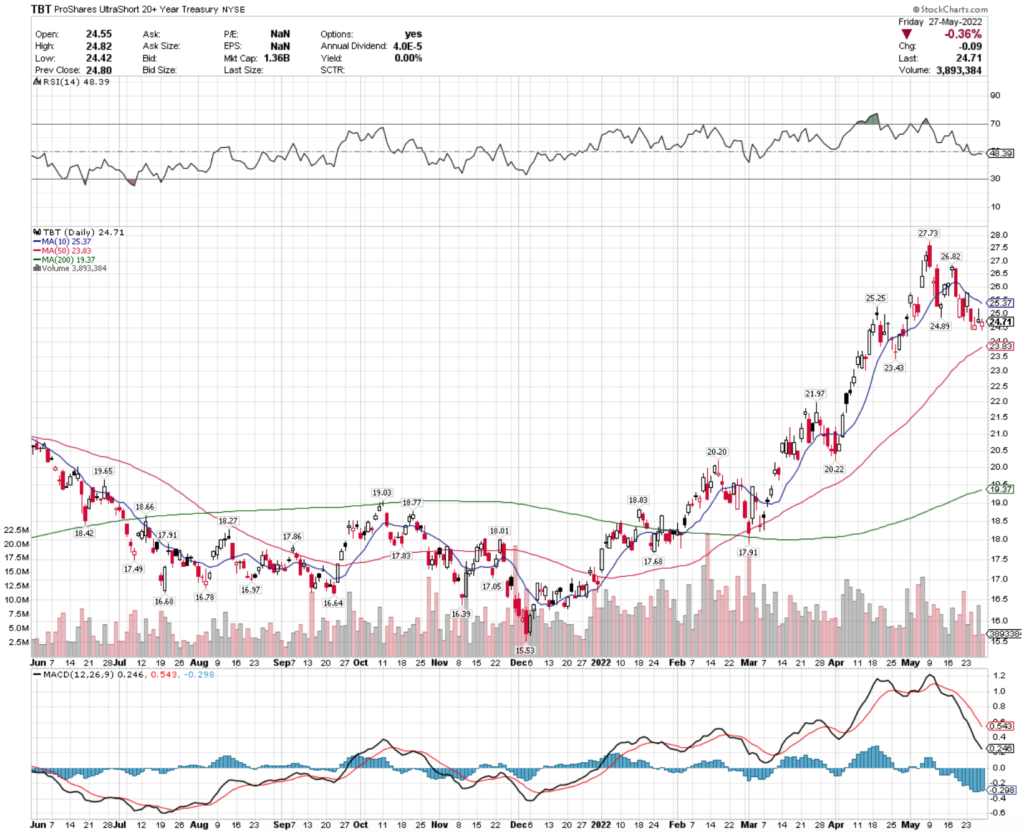
TBT ETF – ProShares UltraShort 20+ Year Treasury ETF
While they’ve cooled off in May, their trading volume has gone down from the rest of 2022, signaling a lack of investor confidence.
TBT’s MACD has been signaling bearish since the beginning of May & their RSI has gone back to neutral, showing that they may be ready to begin climbing higher again in the near-term.
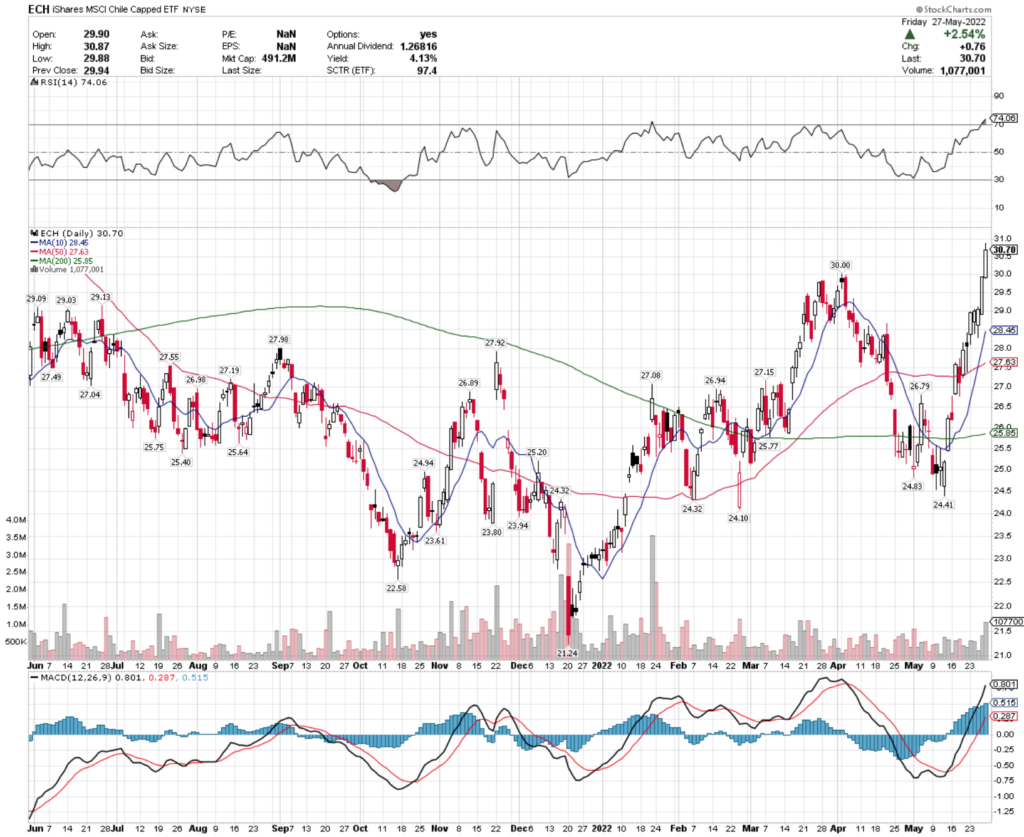
ECH offers a 4.13% dividend yield that investors can use as a cushion to protect against future losses, and they also have options that traders can use to reduce risk.
They look primed for a pullback in the near-term, with an overbought RSI, which may present a buying opportunity for some investors.
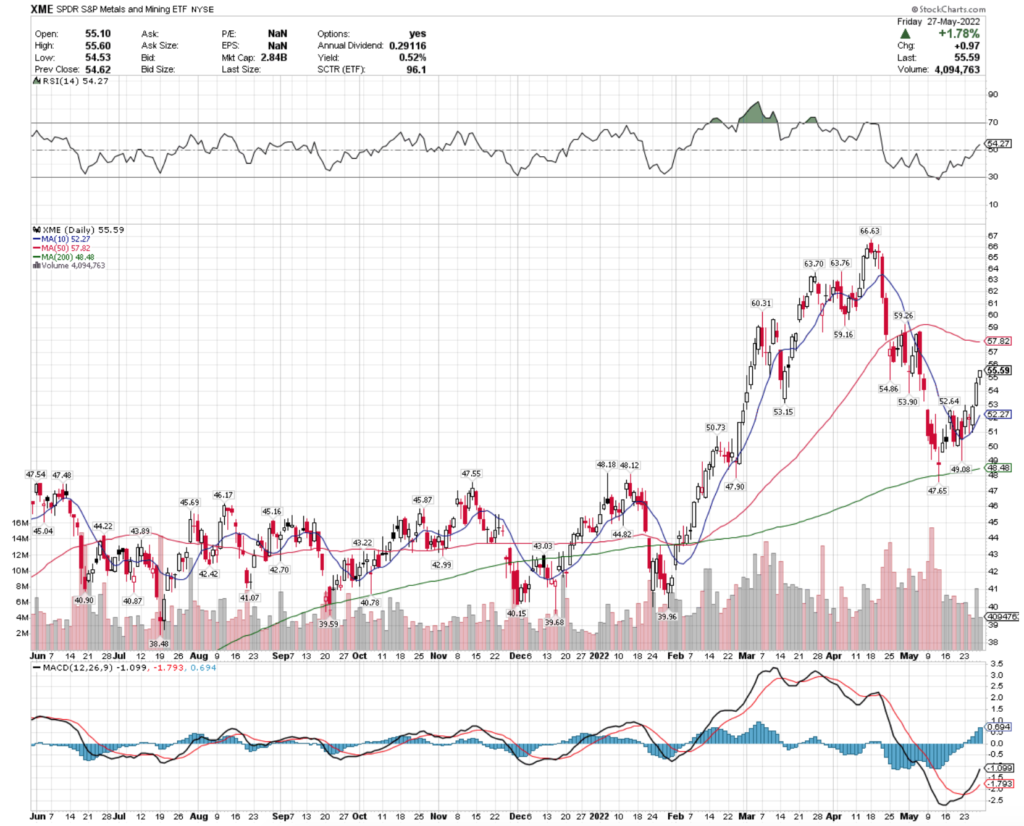
They look to have momentum to continue climbing in the coming weeks, should their MACD not roll over & begin to turn bearish, as their RSI is currently neutral.
Investors looking to buy into XME should reduce the risks associated in this volatile market environment by leveraging their options, as their dividend yield does not provide much protection from any downside risks.
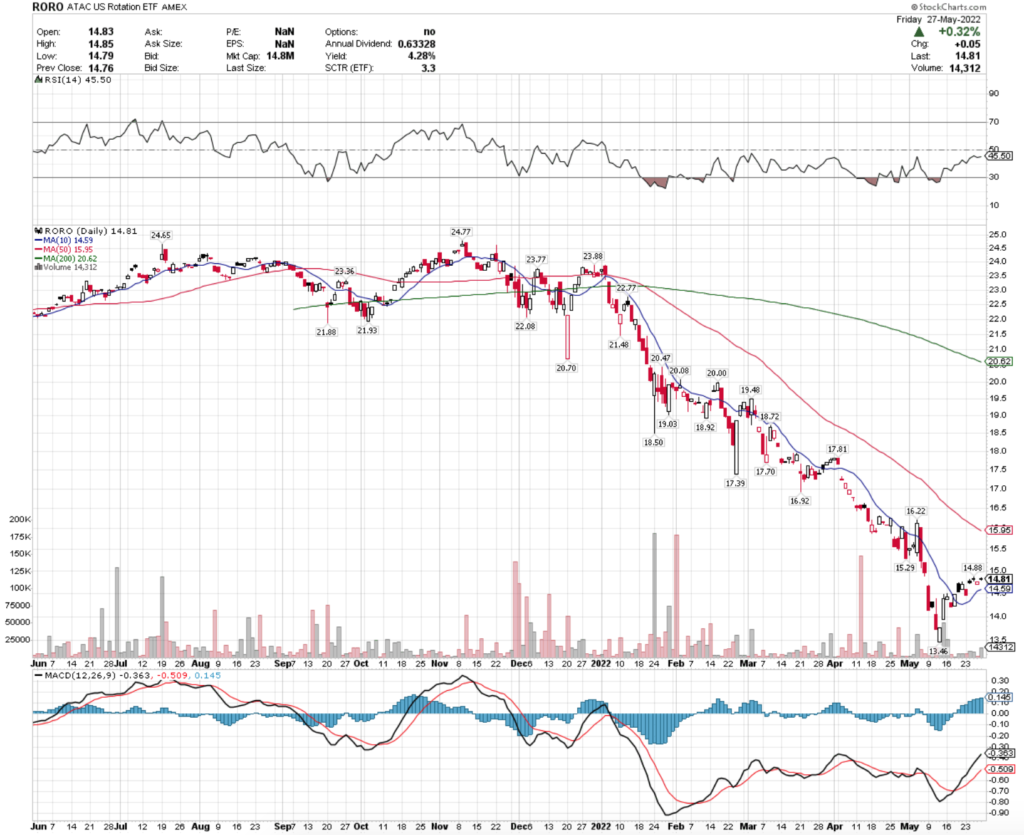
US Rotation (RORO), Telemedicine & Digital Health (EDOC), Gerber Kawasaki (GK) & Dry Bulk Shipping (BDRY) All Bearishly Lagging The Market
As their RSI begins to return to neutral, investors may begin to think about rotating into a RORO position, as holding the shares for the year ahead yields a 4.3% dividend.
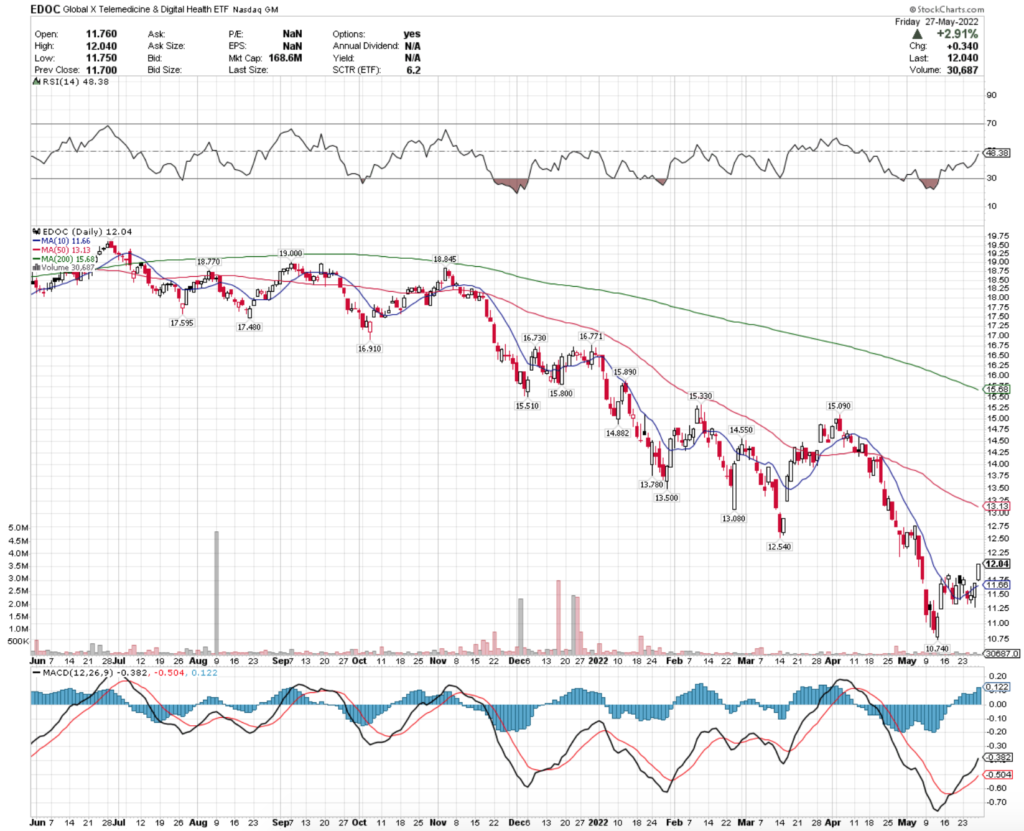
EDOC ETF – Global X Telemedicine & Digital Health ETF
While they look to be establishing a new floor to build from, there is no dividend yield to provide additional returns for long-term shareholders who establish a new position now.
Their MACD looks like that it may becoming bearish in the near-term, so this is something investors may want to monitor closely in the coming weeks before purchasing shares.
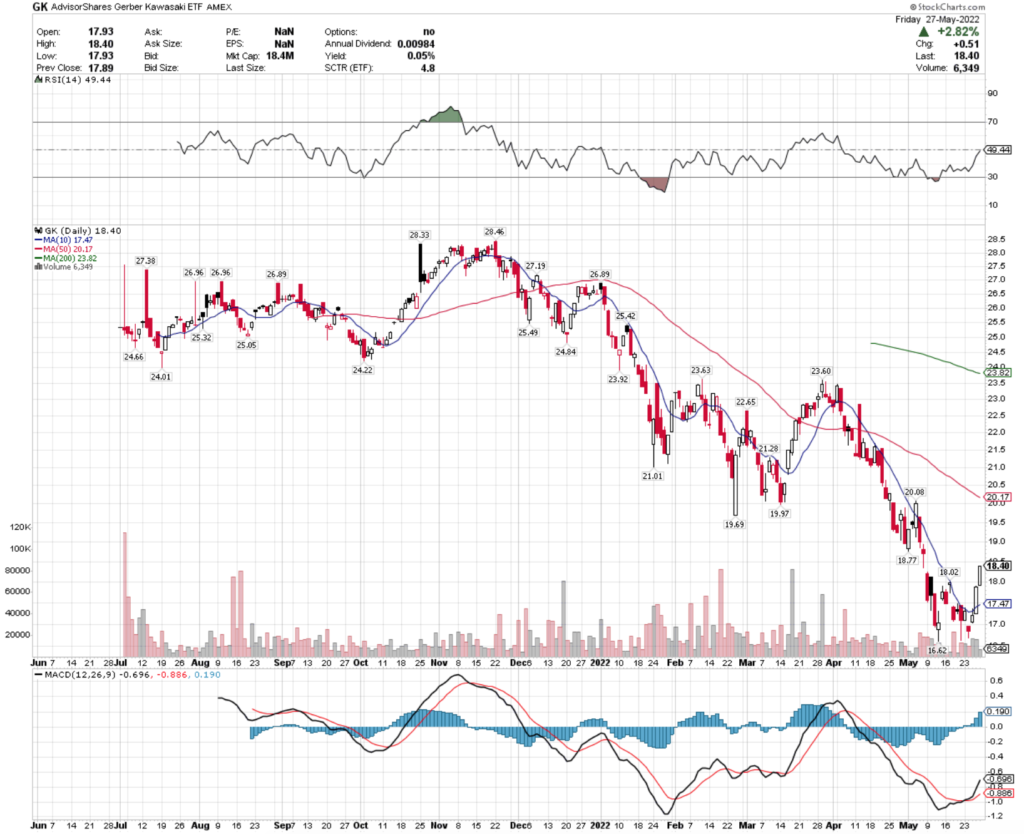
While their RSI is approaching neutral & their MACD looks bullish, this is a name that will experience more near-term pain & is not worth considering entry into a new position in at this time.
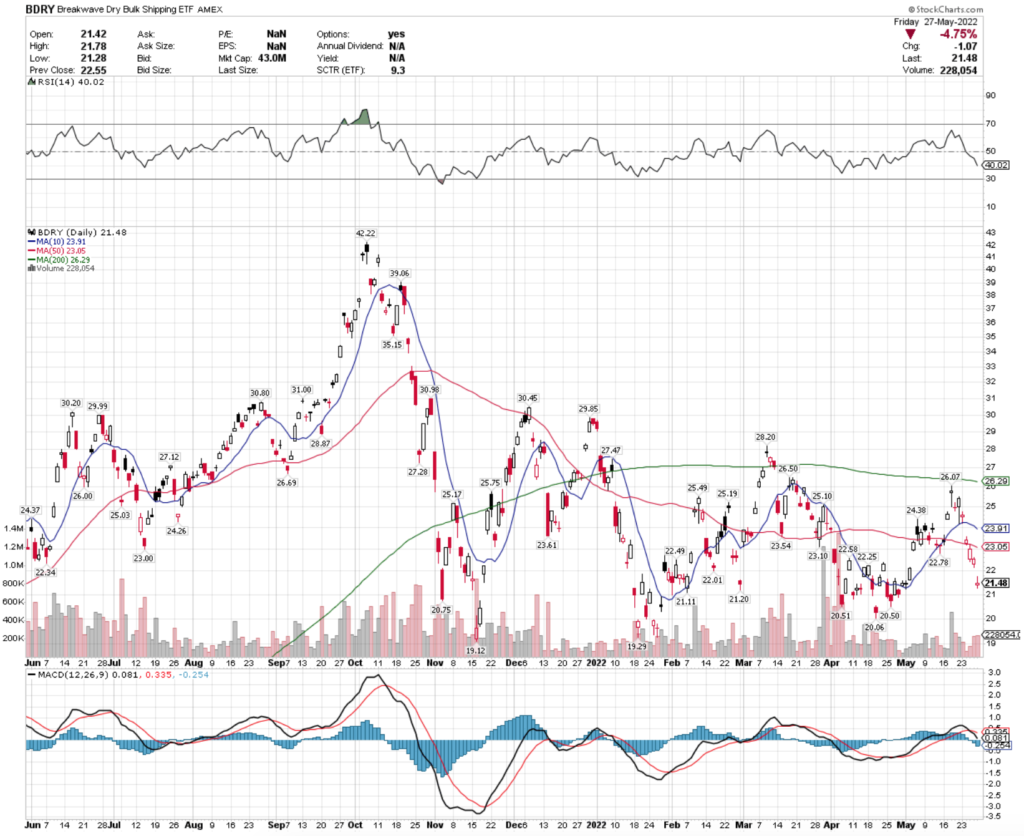
Their MACD is currently bearish, and their 10 day moving average is set to break through the 50 day MA, signaling more pain on the near-horizon.
As they offer no dividend yield, this does not appear to be a good time to begin buying into BDRY.
Tying It All Together
This upcoming week looks to have more volatility in store, after major averages had their first positive week last week in months.
Investors will be interested in PMI data, job openings, jobless claims, construction spending & factory orders data, as well as the Fed’s Beige Book.
Earnings calls will also continue, where guidance offered will help mold future expectations for market performance in the coming year.
Volatility looks to continue, which can offer some discounts for investors willing to take on more risk while purchasing new assets or building on existing positions.
*** I DO NOT OWN SHARES OF SPUU, TQQQ, PXI, TBT, ECH, XME, RORO, EDOC, GK, OR BDRY AT THE TIME OF PUBLISHING THIS ARTICLE ***
Packaging Corp of America stock trades under the ticker PKG & has recently shown bullish behavior in a time of market volatility.
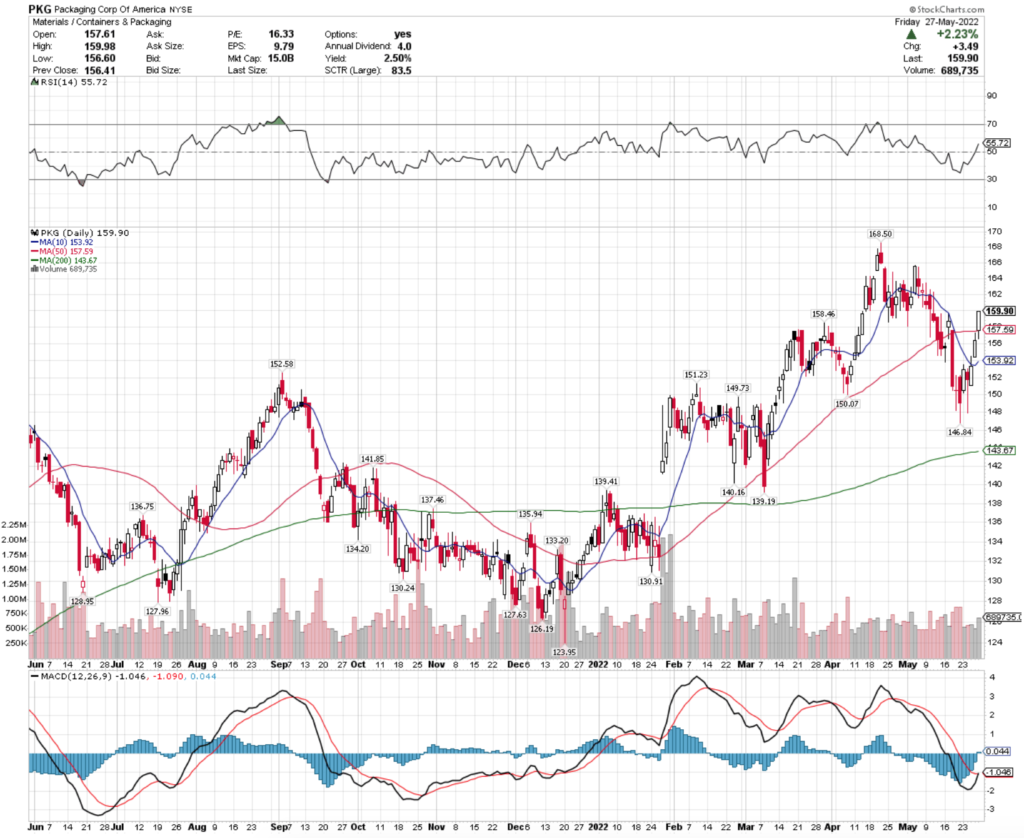
PKG stock closed at $159.90/share on 5/27/2022.
Packaging Corp of America PKG Stock’s Technical Performance Broken Down
PKG Stock Price: $159.90
10 Day Moving Average: $153.92
50 Day Moving Average: $157.59
200 Day Moving Average: $143.67
RSI: 55.72
MACD: -1.046
On Friday, PKG stock completed a bullish MACD crossover, while breaking out above its 50 day moving average.
While their recent trading volumes have been about average compared to the year prior, there is only 2.4% between their 10 & 50 day moving averages, and their RSI is still neutral, signaling that there may be more near-term bullish momentum.
They will need to test the $165.72/share resistance level, before testing the $168.50/share level.
Packaging Corp of America PKG Stock As A Long-Term Investment
Long-term oriented investors will like PKG stock’s P/E (ttm) of 15.24, but may find their P/B (mrq) of 3.7 to be a bit too rich.
They recently reported 18.2% Quarterly Revenue Growth Y-o-Y, with 52.7% Quarterly Earnings Growth Y-o-Y.
Their balance sheet may require a closer review, with a reported $709.9M of Total Cash (mrq), along with $2.76B of Total Debt (mrq).
PKG stock pays a 2.56% dividend yield, which appears stable in the long-run, as their payout ratio is 40.9%.
95.49% of PKG stock’s outstanding share float is owned by institutional investors.
Packaging Corp of America PKG Stock As A Short-Term Trade Using Options
Short-term oriented traders can use options to capitalize on PKG stock’s price movements, while also hedging against broader market volatility.
I am looking at the contracts with the 6/17 expiration date.
The $145, $150 & $155 call options are all in-the-money, but are very illiquid with only 238 contracts between the three strike prices.
The $175, $170 & $165 put options are also all in-the-money, but have severely illiquid open interest levels (3 contracts)
Tying It All Together
PKG stock has a lot of characteristics that make it an interesting potential addition to your portfolio strategy.
Investors will like their valuation metrics & dividend yield, but may want to do more digging into their balance sheet before buying.
Traders will like their current momentum in this environment, but will likely be disappointed by the liquidity of their options contracts.
All-in-all, it is worth taking a closer look at PKG stock to see how it can fit into your portfolio’s strategy.
*** I DO NOT OWN SHARES OF PKG STOCK AT THE TIME OF PUBLISHING THIS ARTICLE ***
HP Inc. stock trades under the ticker HPQ & has recently shown bullishness that traders & investors should research further.
HPQ stock closed at $38.75/share on 5/27/2022.
HP Inc. HPQ Stock’s Technical Performance Broken Down
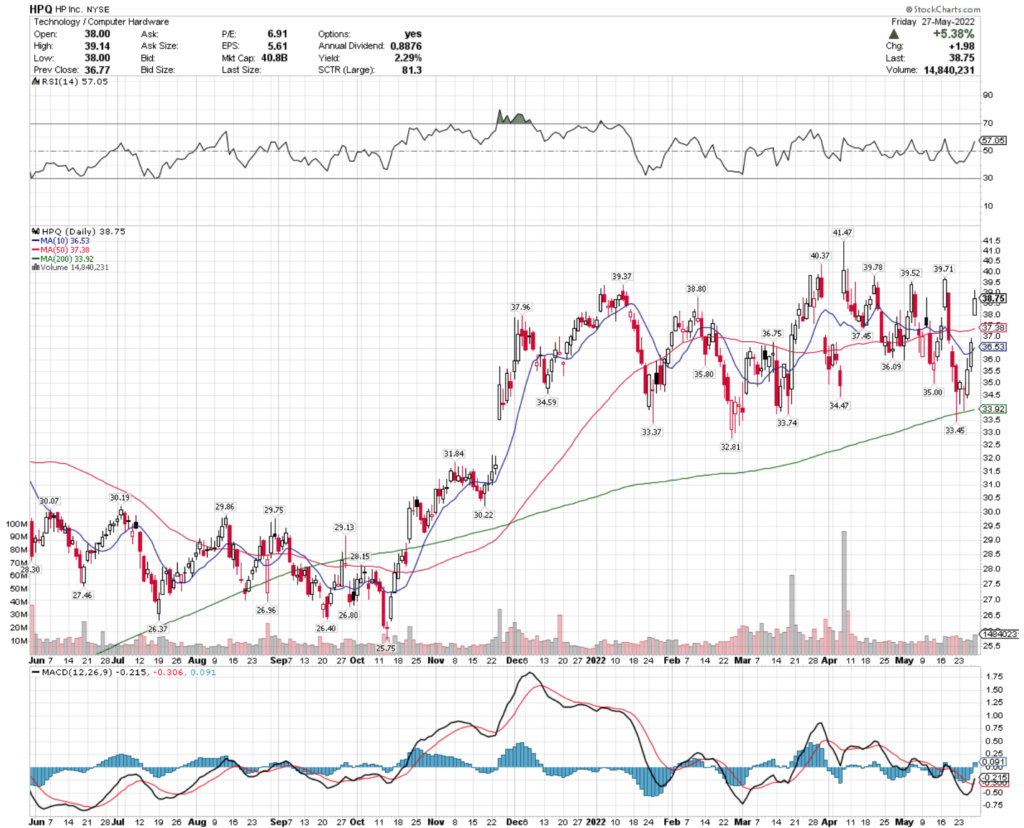
HPQ Stock Price: $38.75
10 Day Moving Average: $36.53
50 Day Moving Average: $37.38
200 Day Moving Average: $33.92
RSI:57.1
MACD: -0.215
HPQ completed a bullish MACD crossover on Friday, while gapping up 5.38% & breaking out above its 50 day moving average.
Recent trading volumes have been slightly above average compared with the year prior, and their RSI is still in the mid-high neutral range.
With only 2.3% between HPQ stock’s 10 & 50 day moving averages, there looks to be more bullish momentum to come in the near-term.
They will need to test & break above the $39.84 resistance level, before going on to test $41.47/share.
HP Inc. HPQ Stock As A Long-Term Investment
Long-term oriented investors will like HPQ stock’s 6.71 P/E (ttm).
They recently reported 8.8% Quarterly Revenue Growth Y-o-Y, with 1.7% Quarterly Earnings Growth Y-o-Y.
Their balance sheet is worth taking a closer review of before investment though, as they have a reported $3.4B in Total Cash (mrq) & $8.35B in Total Debt (mrq).
HPQ stock pays a 2.26% dividend yield, which appears sustainable in the long-term as their payout ratio is 15.14%.
88.9% of HPQ stock’s outstanding share float is owned by institutional investors.
HP Inc. HPQ Stock As A Short-Term Trade Using Options
Short-term oriented traders can use options to profit from HPQ stock’s price movements, while protecting themselves from broader market volatility.
I am looking at the contracts with the 6/17 expiration date.
The $37, $37.50 & $38 calls are all in-the-money & have sufficient levels of open interest.
The $41, $40 & $39 put options are also in-the-money, with the former being the less liquid of the three (261 contracts vs. 16,392 contracts for the other two strikes).
Tying It All Together
HPQ stock offers many unique characteristics that may make it a good addition to your porfolio.
Investors will like their valuation metrics & dividend yield, however they may want to research their balance sheet further before making an investment.
Traders will like their current momentum, as well as the liquidity of their options, and weekly expirations.
Overall, HPQ stock is worth taking a closer look at, to see how it fits into your portfolio strategy.
*** I DO NOT OWN SHARES OF HPQ STOCK AT THE TIME OF PUBLISHING THIS ARTICLE ***
Dollar Tree Inc. stock trades under the ticker DLTR & has recently shown bullishness that traders & investors should take a closer look into.
DLTR stock closed at $165/share on 5/27/2022.
Dollar Tree Inc. DLTR Stock’s Technical Performance Broken Down
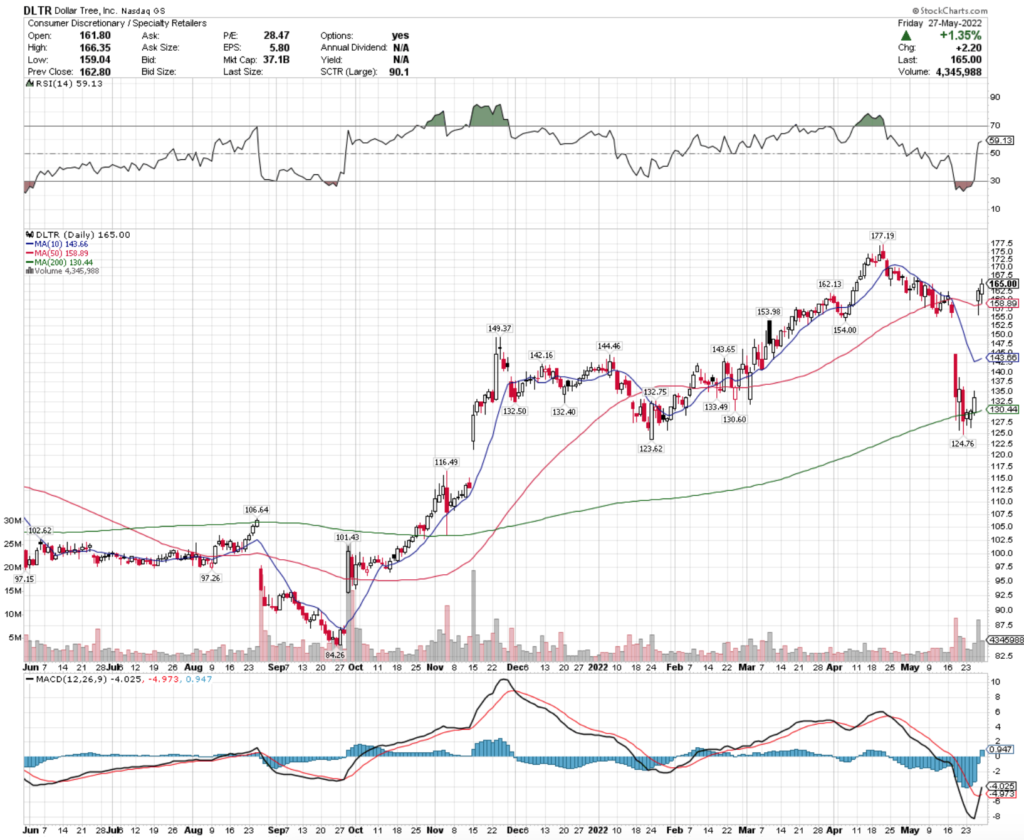
DLTR Stock Price: $165
10 Day Moving Average: $143.66
50 Day Moving Average: $158.89
200 Day Moving Average: $130.44
RSI: 59.13
MACD: -4.025
On Friday, DLTR stock completed a bullish MACD crossover, the day following a gap up that broke them out above their 10 & 50 day moving averages.
Their recent trading volumes have been above average, and their RSI is still mid-high neutral, signaling that there may be more near-term momentum for DLTR stock.
They will need to break above the $172.70 resistance level, before testing the $177.19/share level.
Dollar Tree Inc. DLTR Stock As A Long-Term Investment
Long-term oriented investors will like DLTR stock’s 23.07 P/E (ttm), although their 3.9 P/B (mrq) may be viewed unfavorably by some.
They recently reported 6.5% Quarterly Revenue Growth Y-o-Y, along with 43.2% Quarterly Earnings Growth Y-o-Y.
Their balance sheet will require further examination before investing though, with reported $1.22B Total Cash (mrq) & $9.91B Total Debt (mrq).
Despite not paying a dividend, DLTR stock is still has 96.7% of its outstanding share float owned by institutional investors.
Dollar Tree Inc. DLTR Stock As A Short-Term Trade Using Options
Short-term focused traders can use options to profit from DLTR stock’s price movements in any direction.
I am looking at the contracts with the 6/17 expiration.
The $145, $155 & $160 call options are all in-the-money & have sufficient levels of open interest.
The $180, $175 & $170 puts also are in-the-money, but are very illiquid, signaling that the market has near-term bullish sentiment for DLTR stock.
Tying It All Together
DLTR stock has many interesting characteristics that traders & investors will want to research further.
Investors will like their valuation metrics, but will be disappointed by their lack of a dividend yield & may want to look closer into their balance sheet.
Traders will like their current momentum, weekly option expiration dates & how liquid their contracts are.
Overall, DLTR stock is worth taking a closer look into to see how it fits into your portfolio strategy.
*** I DO NOT OWN SHARES OF DLTR STOCK AT THE TIME OF PUBLISHING THIS ARTICLE ***
Cheniere Energy Partners L.P. stock trades under the ticker CQP & has shown recent bullishness that traders & investors should take a closer look into.
CQP stock closed at $54.40/share on 5/25/2022.
Cheniere Energy Partners L.P. CQP Stock’s Technicals Broken Down
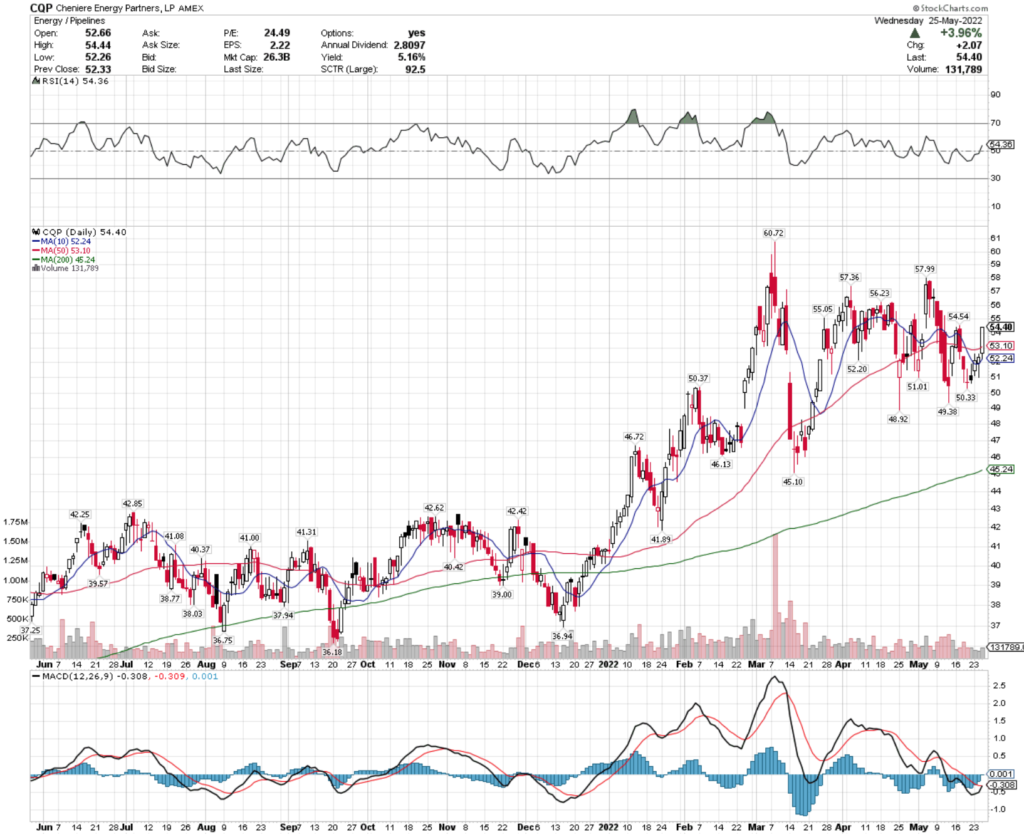
CQP Stock Price: $54.40
10 Day Moving Average: $52.24
50 Day Moving Average: $53.10
200 Day Moving Average: $45.24
RSI: 54.4
MACD: -0.308
Yesterday, CQP stock completed a bullish MACD crossover, while breaking out above its 50 day moving average.
Despite trading on lighter than average volume, they look to have more near-term momentum, as their RSI is neutral & they have completed 4 consecutive days of gains.
They will need to break above the $54.44, $54.54 & $55.23/share resistance levels as they continue to climb higher.
Cheniere Energy Partners L.P. CQP Stock As A Long-Term Investment
Long-term oriented investors will like CQP stock’s P/E (ttm) of 22.6, but may be weary of their P/B (mrq).
They recently reported 69.5% Quarterly Revenue Growth Y-o-Y, although -54.2% Quarterly Earnings Growth Y-o-Y.
Their balance sheet will require a more thorough review, with $1.16B in Total Cash (mrq) & $17.28B in Total Debt (mrq).
CQP stock’s 5.39% dividend yield may not be sustainable in the long-run, as their payout ratio is reported >100%.
47.1% of CQP stock’s outstanding share float is owned by institutional investors.
Cheniere Energy Partners L.P. CQP Stock As A Short-Term Trade Using Options
Short-term oriented traders can use options to profit from CQP stock’s price movements, while hedging against broader market volatility.
I am looking at the contracts with the 6/17 expiration date.
The $48, $49 & $50 call options all look appealing, although they have relatively low levels of open interest.
The $60 & $55 puts are the only strike prices with open interest that are in-the-money, and are very illiquid.
Tying It All Together
CQP stock has many interesting attributes that make it worth considering as an addition to your portfolio.
Investors will like their P/E, however they may want to look closer into their balance sheet to see how debt may play a role in their size of their dividend in the years to come.
Traders will like their current momentum, but may be disappointed by the low levels of open interest of their options contracts.
Overall, CQP stock is worth taking a closer look into to see if it fits into your portfolio strategy.
*** I DO NOT OWN SHARES OF CQP STOCK AT THE TIME OF PUBLISHING THIS ARTICLE ***