Apple Inc. AAPL Stock Analysis

Apple Inc. stock trades under the ticker AAPL & has shown recent bullishness that traders & investors should take a closer look into.

AAPL stock closed at $163.98/share on Friday 3/18/2022.

Apple Inc. AAPL Stock’s Technicals Broken Down

Apple Inc. AAPL Stock's Technical Performance Over The Last Year

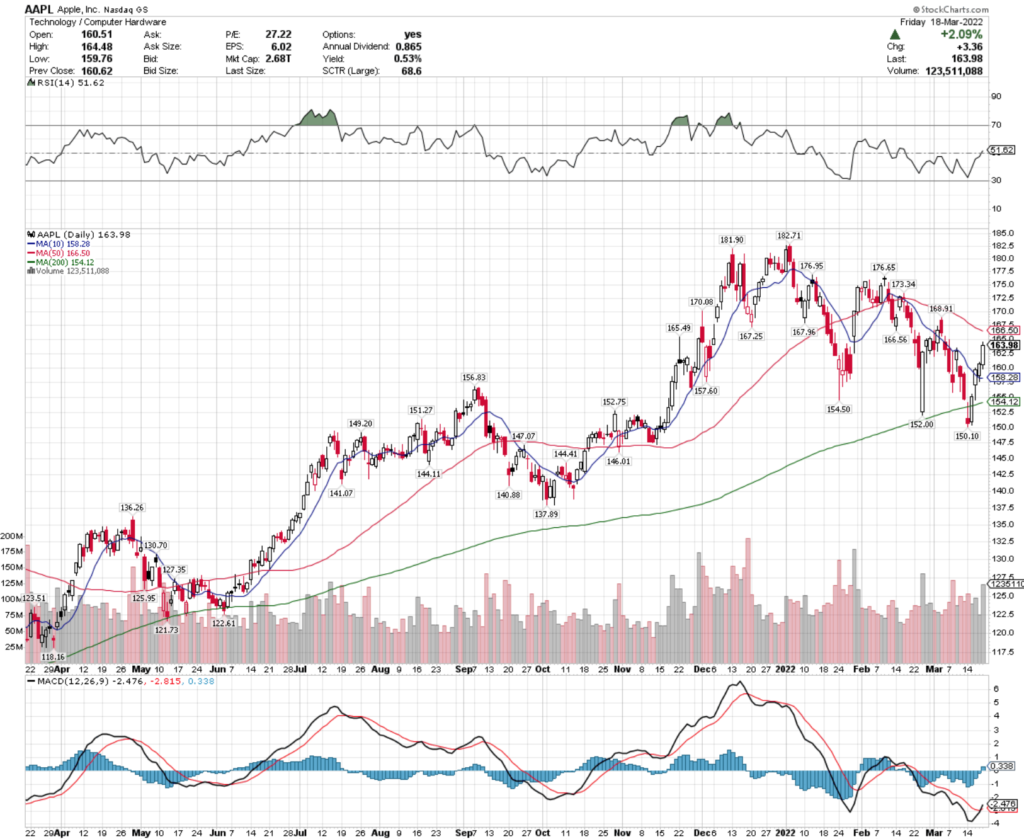
AAPL Stock Price: $163.98

10 Day Moving Average: $158.28

50 Day Moving Average: $166.50

200 Day Moving Average: $154.12

RSI: 51.62

MACD: -2.476

On Friday, AAPL stock completed a bullish MACD crossover, coming within 1.5% of breaking out above its 50 Day Moving Average.

They have been trading at above average volume in the last month compared to the year prior.

With a neutral RSI, there looks to be more momentum to the upside to come in the near-term for AAPL stock.

The $165.02, $165.55 & $168.91 price levels are areas to watch for resistance as they continue climbing.

Apple Inc. AAPL Stock As A Long-Term Investment

Long-term oriented investors may find AAPL stock’s P/E (ttm) of 25.66 appealing, but will find their P/B (mrq) of 35.1 to be a bit too rich.

Their most recent reporting showed 11.2% Quarterly Revenue Growth Y-o-Y, with 20.4% Quarterly Earnings Growth Y-o-Y.

AAPL stock’s balance sheet will warrant a closer review, with $63.91B in Total Cash (mrq) & Total Debt (mrq) f $122.81B.

AAPL stock offers a modest, but safe dividend yield of 0.54%, with a 14% payout ratio.

Only 59% of AAPL stock’s outstanding share float is held by institutional investors.

Apple Inc. AAPL Stock As A Short-Term Trade Using Options

Short-term oriented traders can use options to profit from AAPL stock’s price movement in any direction.

I am looking at the contracts with the 4/14 expiration date.

The $160 & $165 call options both look appealing, and very liquid.

The $170 & $175 puts also look appealing & have high levels of open interest.

Tying It All Together

Overall, AAPL stock has many characteristics that traders & investors alike will find appealing.

Investors will find their P/E (ttm) appealing, and will appreciate their modest dividend yield.

Traders will like the liquidity of their options contracts, as well as their current path of momentum.

AAPL stock is worth taking a closer look into, regardless of your trading style.

*** I DO NOT OWN SHARES OF AAPL STOCK ***

Polo Ralph Lauren Corp. RL Stock Analysis

Polo Ralph Lauren Corp. stock trades under the ticker RL & has shown recent bullishness that traders & investors should take a closer look into.

RL stock closed at $121.40/share on Friday 3/18/2022.

Polo Ralph Lauren Corp. RL Stock’s Technicals Broken Down

Polo Ralph Lauren Corp. RL Stock's Technical Performance Over The Last Year

RL Stock Price: $121.40

10 Day Moving Average: $109.84

50 Day Moving Average: $117.52

200 Day Moving Average: $117.15

RSI: 55.05

MACD: -1.866

On Friday, RL stock completed a bullish MACD crossover, on a fourth consecutive day of gains.

RL stock has traded on above average volume in the last month compared to the rest of the prior year.

With a neutral RSI, there looks to be more momentum in the near-term for RL stock.

The next resistance levels I am watching are $122.82, $123.26 & $128.88.

Ralph Lauren Corp. RL Stock As A Long-Term Investment

Long-term oriented investors may find RL stock’s valuation metrics appealing, with a P/E (ttm) of 16.12 & a P/B (mrq) of 2.81.

Their most recent reports show 26.7% Quarterly Revenue Growth Y-o-Y, with 81.7% Quarterly Earnings Growth Y-o-Y.

RL stock’s balance sheet looks healthy but should be reviewed before investing, with Total Cash (mrq) of $2.99B & $3.44B in Total Debt (mrq).

RL stock offers a 1.73% dividend yield, which appears safe in the long-term with a 30.92% payout ratio.

Ralph Lauren Corp. RL Stock As A Short-Term Trade Using Options

Short-term oriented traders can use options to capture profits from RL stock’s movement in any directions amid broader market volatility.

I am looking at the contracts with the 4/14 expiration date.

The $120 & $125 call options look interesting, although their open interest levels are a bit low.

The $130 & $135 puts also look appealing, but they are even less liquid.

Tying It All Together

Overall, RL stock offers many unique attributes that traders & investors are sure to like.

Investors will like their valuation, dividend & balance sheet, while traders will like their current momentum rates.

RL stock is worth taking a closer look into, regardless of your trading style.

*** I DO NOT OWN SHARES OF RL STOCK ***

Blackstone Group Inc. BX Stock Analysis

Blackstone Group Inc. stock trades under the ticker BX & has shown recent bullishness that traders & investors should research further.

BX stock closed at $122.85/share on 3/18/2022.

Blackstone Group Inc. BX Stock’s Technicals Broken Down

Blackstone Group Inc. BX Stock's Technical Performance Over The Last Year

BX Stock Price: $122.85

10 Day Moving Average: $114.40

50 Day Moving Average: $120.45

200 Day Moving Average: $118.65

RSI: 53.23

MACD: -1.921

On Friday, BX stock completed a bullish MACD crossover, while breaking out above their 50 Day Moving Average.

With a neutral RSI & less than 2% between their 10 & 50 day moving averages, there looks to be more upwards momentum in the near-term for BX.

Their next resistance levels will be $123.84 & $124.99/share.

Blackstone Group Inc. BX Stock As A Long-Term Investment

Long-term oriented investors will find BX stock’s P/E (ttm) of 14.27 to be appealing, but may find their P/B (mrq) of 8.63 to be a bit rich.

Their most recent reporting showed 51.7% Quarterly Revenue Growth Y-o-Y, with 86.7% Quarterly Earnings Growth Y-o-Y.

BX stock’s balance sheet may require a closer examination, with Total Cash (mrq) of $2.27B & Total Debt (mrq) of $8.86B.

They offer a 3.39% dividend yield, which looks safe in the long-run given their 43.19% payout ratio.

~64% of BX stock’s outstanding share float is held by institutional investors.

Blackstone Group Inc. BX Stock As A Short-Term Trade Using Options

Short-term oriented traders can use options to profit from BX stock’s price movements in any direction.

I am looking at the contracts with the 4/14 expiration date.

The $123 & $124 calls look appealing, but are not particularly liquid; however this may change as Friday was March’s expiration date.

The $125 & $126 puts also look appealing, but have similar limited levels of open interest.

Tying It All Together

All-in-all, investors & traders will find lots of things to like about BX stock.

Investors will find their dividend appealing, as well as their P/E; however they may want to look deeper into their balance sheet before investing.

Traders will like their current momentum path, but may be disappointed by their options’ open interest levels.

BX stock is worth taking a closer look at, regardless of your trading style.

*** I DO NOT OWN SHARES OF BX STOCK ***

Sealed Air Corp. SEE Stock Analysis

Sealed Air Corp. stock trades under the ticker SEE & has shown recent bullishness that traders & investors should take a closer look into.

SEE stock closed at $66.70/share on 3/15/2022.

Sealed Air Corp. SEE Stock’s Technicals Broken Down

SEE Stock Price: $66.70

10 Day Moving Average: $64.71

50 Day Moving Average: $66.00

200 Day Moving Average: $61.06

RSI: 53.8

MACD: -0.26

Yesterday, SEE stock completed a bullish MACD crossover, while breaking out above its 50 day moving average, trading at about average volume compared to the year prior.

With a neutral RSI & 2% between their 10 & 50 Day Moving Averages, SEE stock looks to have more momentum to come to the upside in the near-term.

Their next tests will be at the $67.25, $67.42 & $67.72.

Sealed Air Corp. SEE Stock As A Long-Term Investment

Long-term oriented investors may like SEE stock’s P/E (ttm) of 21.26, but will likely find their P/B (mrq) of 40.78 to be very high.

SEE stock’s most recent reporting showed 14.2% Quarterly Revenue Growth Y-o-Y, with 27.2% Quarterly Earnings Growth Y-o-Y.

Their balance sheet will require a closer inspection, with $561M in Total Cash (mrq) & Total Debt (mrq) of $3.77B.

Moody’s rates SEE stock’s credit at Ba1, which is the top grade of speculative/junk ratings.

SEE stock offers a 1.15% dividend yield, which appears to be safe in the long-run, with their 24% payout ratio.

92.5% of SEE stock’s outstanding share float is held by institutional investors.

Sealed Air Corp. SEE Stock As A Short-Term Trade Using Options

Traders who are focused on the near-term can use options to profit from SEE stock’s price movements in any direction, while hedging against market volatility.

I am looking at the contracts with the 4/14 expiration date.

The $65 & $70 call options look appealing, with the former having more liquidity.

The $70 & $75 puts also look interesting, but are much less liquid, with very low levels of open interest.

More contracts should be written in the coming days, as Friday of this week is March’s expiration date.

Tying It All Together

All-in-all, SEE stock has many opportunities that investors & traders will both like.

Investors will like their dividend yield, as well as their recent growth reported in earnings.

Traders will like their current momentum, as well as the liquidity of their options once Friday’s expiration date passes.

SEE stock is worth taking a closer look into, regardless of your trading style.

*** I DO NOT OWN SHARES OF SEE STOCK ***

Mitsubishi UFJ Financial Group MUFG Stock

Mitsubishi UFJ Financial Group stock trades under the ticker MUFG & has shown recent bullishness that traders & investors should take a closer look into.

MUFG stock closed at $6.26/share on 3/15/2022.

Mitsubishi UFJ Financial Group MUFG Stock’s Technicals Broken Down

Mitsubishi UFJ Financial Group MUFG Stock's Technical Performance Over The Last Year

MUFG Stock Price: $6.26

10 Day Moving Average: $6.01

50 Day Moving Average: $6.15

200 Day Moving Average: $5.73

RSI: 55.24

MACD: -0.035

Yesterday, MUFG stock completed a bullish MACD crossover, as it continued a 3 day rally higher.

MUFG stock has traded on above average volume this past month, when compared to the rest of the last year.

With a neutral RSI, and 2% between the 10 & 50 day moving averages, MUFG stock looks to have more bullish momentum to come in the near-term.

I’ll be watching it at the $6.30 & $6.42 resistance levels.

Mitsubish UFJ Financial Group MUFG Stock As A Long-Term Investment

Long-term oriented investors will like MUFG stock’s valuation metrics, with a P/E (ttm) of 7.52 & a P/B (mrq) of 0.52.

Their most recent reporting showed 51.4% increase in Quarterly Revenue Growth Y-o-Y.

Their balance sheet will require a closer examination, but appears to be in good shape, with $144T in Total Cash (mrq) & Total Debt (mrq) of $91.62T.

Moody’s rates MUFG’s credit rating an A1, which is considered upper medium grade.

MUFG stock offers a 3.71% dividend yield, which appears safe given their payout ratio is 26.8%.

Despite this, only 1.8% of MUFG stock’s outstanding share float is held by institutional investors.

Mitsubishi UFJ Financial Group MUFG Stock As A Short-Term Trade Using Options

Short-term oriented traders can trade MUFG stock options to hedge against volatility, while profiting off of price movements in any direction.

I am looking at the contracts with the 4/14 expiration date.

As there is an upcoming expiration date on Friday, there is limited open interest for MUFG options on this expiration date.

However, pending their open interest levels, the $5 calls & $7.50 could be interesting, if they become liquid.

The $7.50 & $10 puts would also be appealing, if they were liquid.

Tying It All Together

Overall, MUFG stock has many attributes that traders & investors alike will find appealing.

Their valuation metrics & dividend yield will be appealing to long-term focused investors.

Short-term oriented traders will like their current momentum, but will need to watch their April dated options contracts in the coming week to see if they become more liquid.

MUFG stock is worth taking a closer look into, regardless of your trading style.

*** I DO NOT OWN SHARES OF MUFG STOCK ***

Murphy USA, Inc. MUSA Stock Analysis

Murphy USA, Inc. stock trades under the ticker MUSA & has shown recent bullishness that traders & investors should take a closer look into.

MUSA stock closed at $182.96/share on 3/14/2022.

Murphy USA, Inc. MUSA Stock’s Technicals Broken Down

Murphy USA, Inc. MUSA Stock's Technical Performance Over The Last Year

MUSA Stock Price: $182.96

10 Day Moving Average: $177.54

50 Day Moving Average: $186.15

200 Day Moving Average: $165.99

RSI: 52.91

MACD: -2.275

Yesterday, MUSA stock completed a bullish MACD crossover, while breaking out above its 10 day moving average.

Their RSI is neutral, showing that they have much more room to move to the upside before the market considers their shares to be overbought.

In 2022, MUSA stock has traded on higher than average volume compared to the year prior.

The next price levels I am watching them at are $184.47, $184.96, before the $186.22 resistance level.

Murphy USA, Inc. MUSA Stock As A Long-Term Investment

Long-term oriented investors will like MUSA stock’s P/E (ttm) at 12.15, but may find their P/B (mrq) a bit rich at 5.58.

Their most recent reporting showed 76.6% Quarterly Revenue Growth Y-o-Y, with 78.4% Quarterly Earnings Growth Y-o-Y reported.

Their balance sheet will require a closer examination though, with Total Cash (mrq) of $256.4M & Total Debt (mrq) of $2.24B.

MUSA stock pays a modest 0.59% dividend, which looks very safe as their payout ratio is only 6.97%.

85.2% of MUSA stock’s outstanding share float is held by institutional investors.

Murphy USA, Inc. MUSA Stock As A Short-Term Trade Using Options

Short-term oriented traders can use options to hedge against volatility while also capturing gains from MUSA stock’s momentum.

I am looking at the contracts with the 4/14 expiration date.

The $185 calls look appealing, although relatively illiquid, and the $180 calls would look interesting if they had open interest.

I expect there to be more contracts written in the coming days, as this Friday is an expiration date for their March options contracts.

The $195 puts have open interest, but very limited.

Tying It All Together

All-in-all, MUSA stock has many appealing characteristics that traders & investors should research further.

Investors will like their safe, yet modest dividend, as well as their valuation, but may want to do more research into the structure of their balance sheet.

Short-term traders will like their current momentum, but will want to see more liquidity in next month’s options contracts.

MUSA stock is worth taking a closer look at, regardless of your trading style.

*** I DO NOT OWN SHARES OF MUSA STOCK ***

Northwest Bancshares, Inc. NWBI Stock

Northwest Bancshares, Inc. stock trades under the ticker NWBI & has shown recent bullishness that traders & investors should take a closer look into.

NWBI stock closed at $14.23/share on 3/14/2022.

Northwest Bancshares, Inc. NWBI Stock’s Technicals Broken Down

Northwest Bancshares, Inc. NWBI Stock's Technical Performance Over The Last Year

NWBI Stock Price: $14.23

10 Day Moving Average: $13.88

50 Day Moving Average: $14.11

200 Day Moving Average: $13.43

RSI: 55.8

MACD: -0.025

Yesterday, NWBI stock completed a bullish MACD crossover, gapping up 1.57% above its 50 Day Moving Average.

NWBI shares have been trading on above average volume in 2022 compared to the previous year.

Their RSI is still neutral, showing room for more upward momentum.

The next price levels I am watching are the $14.35 & $14.52 resistance levels.

Northwest Bancshares, Inc. NWBI Stock As A Long-Term Investment

Investors focused on the long-term will find NWBI stock’s valuation metrics appealing, with a P/E (ttm) of 11.6 & a P/B (mrq) of 1.12.

Their most recent Quarterly Revenue Growth Y-o-Y was disappointing at -8.5%.

NWBI stock’s balance sheet looks appealing, with Total Cash (mrq) of $1.31B & Total Debt (mrq) of $428.21M.

Northwest Bancshares, Inc. pays a healthy 5.64% dividend, which looks fairly safe in the long-run with a payout ratio of 65.3%.

Despite this, only ~63% of their outstanding share float is held by institutional investors.

Northwest Bancshares, Inc. NWBI Stock As A Short-Term Trade Using Options

Short-term oriented traders can use options to take advantage of NWBI stock’s movement in either direction.

I am looking at the contracts with the 4/14 expiration date.

The $15 call options look appealing, and after this week’s expiration date, I expect more liquidity to be in the $12.50 strike priced contracts.

The puts that are in-the-money all have no open interest yet, but I expect that to change after this Friday & would be looking at the $17.50 & $15 contracts.

Tying It All Together

Overall, NWBI stock has many appealing attributes.

Investors will like their valuation metrics & balance sheet, but may be cautious about their dividend staying so high for a long-period of time due to their high payout ratio.

Traders will like their current momentum, but will want to see more liquidity for next month’s contracts.

NWBI stock is worth taking a closer look into, regardless of your trading style.

*** I DO NOT OWN SHARES OF NWBI STOCK ***

NetScout Systems, Inc. NTCT Stock

NetScout Systems, Inc. stock trades under the ticker NTCT, and has shown recent bullishness amid broader market volatility that traders & investors should take a closer look at.

NTCT stock closed at $31.49/share on 3/11/2022.

NetScout Systems, Inc. NTCT Stock’s Technicals Broken Down

NetScout Systems, Inc. NTCT Stock's Technical Performance Over The Last Year

NTCT Stock Price: $31.49

10 Day Moving Average: $31.08

50 Day Moving Average: $31.32

200 Day Moving Average: $29.64

RSI: 52.6

MACD: -0.065

On Friday, NTCT stock completed a bullish MACD crossover, while also breaking out bullishly above both its 10 & 50 Day Moving Averages.

Their RSI is still neutral, signaling that there is more room to move to the upside before the market thinks that they are overbought.

NTCT will need to pass through the $31.82/share mark, before testing out the $32.08 resistance level.

NetScout Systems Inc. NTCT Stock As A Long-Term Investment

Long-term oriented investors will find NTCT stock’s valuation metrics to be fair, with a P/E (ttm) of 42.4 & a P/B (mrq) of 1.13.

Their most recent filings show 14.6% Quarterly Revenue Growth Y-o-Y, with 64% Quarterly Earnings Growth Y-o-Y.

Their balance sheet looks appealing, with Total Cash (mrq) of $553.5M & Total Debt (mrq) of $417.11M.

Unfortunately, NTCT stock does not offer a dividend.

Still though, they enjoy 95.4% institutional ownership of their outstanding share float.

NetScout Systems, Inc. NTCT Stock As A Short-Term Trade Using Options

Short-term oriented traders can use options to profit from NTCT stock’s movement in either direction.

I am looking at the contracts with the 3/18 expiration date.

The $30 calls look interesting, but very illiquid, and although the $35 calls are more liquid, they require an 11% jump over the course of this week to be at-the-money.

The $35 puts also look illiquid, but look to remain in-the-money before Friday’s expiration.

Tying It All Together

Overall, NTCT stock has many attributes that traders & investors will find interesting.

Investors will like their balance sheet & valuation metrics, but will be dissuaded by their lack of a dividend yield.

Traders will like their current pace of momentum, but may be disappointed by their lack of liquidity in their near-dated contracts.

NTCT stock is worth taking a closer look into, regardless of your trading style.

*** I DO NOT OWN SHARES OF NTCT STOCK ***

Atlas Corp. ATCO Stock Analysis

Atlas Corp. stock trades under the ticker ATCO & has shown recent bullishness that traders & investors should take a closer look into during this volatile market period.

ATCO stock closed at $15.17/share on 3/10/2022.

Atlas Corp. ATCO Stock’s Technicals Broken Down

ATCO Stock Price: $15.17

10 Day Moving Average: $14.53

50 Day Moving Average: $14.63

200 Day Moving Average: $14.09

RSI: 56.6

MACD: -0.036

Yesterday, ATCO stock completed a bullish MACD crossover, a day after breaking out bullishly above its 10 & 50 day moving averages.

They have traded on above average volume the last few days compared to the year prior.

With 0.6% difference between their 10 & 50 Day Moving Averages, they look to have more momentum to come in the near-term.

I’ll be watching them around the $15.40-level, as if they break through that their next level of resistance is $15.60 & $15.80.

Atlas Corp. ATCO Stock As A Long-Term Investment

Long-term oriented investors will find ATCO stock’s valuation metrics appealing, with a P/E (ttm) of 24.23 & a P/B (mrq) of 1.05.

Their most recent reports had 18.1% Quarterly Earnings Growth Y-o-Y.

ATCO stock’s balance sheet may require a closer examination, with $288.6M in Total Cash (mrq) & Total Debt (mrq) of $6.37B.

They offer a dividend yield of 3.38%, which may not be sustainable in the long-run, as their payout ratio is currently 83.33%.

Despite this, 58% of ATCO’s total outstanding share float is held by institutional investors.

Atlas Corp. ATCO Stock As A Short-Term Trade Using Options

Short-term oriented traders can use options to profit from ATCO stock’s movements in either direction, which is especially beneficial in a volatile market.

I am looking at the contracts that expire next Friday, 3/18.

The $12.50 & $15 call options look appealing, with the latter being more liquid than the former.

The $17.50 calls have solid open interest levels, but require a 15% price increase in the next week to be at-the-money.

From the puts perspective, the $17.50 strike price contracts look appealing, although the out-pf-the-money $15 puts have more open interest.

Tying It All Together

Atlas Corp. stock is worth taking a closer look into, whether you trade for the short-term or are focused on a longer-term investment.

Investors will like their valuation metrics & their dividend yield, but may not be fond of their payout ratio & balance sheet.

Short-term traders will like their current momentum, but may find their open interest levels disappointing.

Overall, it is worth taking a closer look into ATCO stock.

*** I DO NOT OWN SHARES OF ATCO STOCK ***

Kimco Realty Corp. KIM Stock Analysis

Kimco Realty Corp. stock trades under the ticker KIM & has shown bullishness in a recently volatile market, warranting a closer look at it.

KIM stock closed at $23.93/share on 3/9/2022.

Kimco Realty Corp. KIM Stock’s Technicals Broken Down

Kimco Realty Corp. KIM Stock's Technical Performance Over The Last Year

KIM Stock Price: $23.93

10 Day Moving Average: $23.51

50 Day Moving Average: $23.96

200 Day Moving Average: $22.21

RSI: 52.7

MACD: -0.089

Yesterday, KIM stock completed a bullish MACD crossover, breaking out above both its 10 & 50 Day Moving Averages.

Their RSI is neutral, although they traded on below average volume yesterday compared to the year prior.

Despite this, I am watching them at the $24.25 resistance level, before $24.50.

Kimco Realty Corp. KIM Stock As A Long-Term Investment

Long-term oriented investors will find KIM stock’s valuation metrics appealing, with a P/E (ttm) of 15.26 & a P/B (mrq) of 1.52.

KIM stock’s most recent Quarterly Revenue Growth Y-o-Y was 57.6%.

Their balance sheet will require a closer examination, as their Total Cash (mrq) is $334.66M & their Total Debt (mrq) is $7.62B.

Moody’s rates Kimco Realty Corp.’s debt Baa1, which is considered medium grade.

KIM stock pays a 2.89% dividend yield, which appears safe as their payout ratio is 42.5%.

95.5% of KIM stock’s outstanding share float is held by institutional investors.

Kimco Realty Corp. KIM Stock As A Short-Term Trade Using Options

Traders focused on the short-term can use options to take advantage of Kimco Realty stock’s price movement in either direction.

I am looking at the contracts with the 3/18 expiration date.

The $22.50 & $25 call options look appealing, with the latter having more open interest, despite being out-of-the-money.

The $25 puts are the highest price level with liquidity, as there is no open interest at the $30 or $35 strike prices.

Tying It All Together

Kimco Realty Corp. stock is worth taking a closer look into regardless of your trading style.

Investors will like their valuation metrics & dividend yield, but would be wise to take a closer look into their balance sheet.

Traders will like their momentum in a volatile market, but may be disappointed by the liquidity of their options contracts for the nearest expiration date.

Overall, it is worth digging deeper into KIM stock.

*** I DO NOT OWN SHARES OF KIM STOCK ***