Domino’s Pizza Group LTD’s stock trades under the ticker DPZ & has shown recent bullish behavior that traders & investors should look closer into.
DPZ stock closed at $44.25/share on 1/18/2023.
Domino’s Pizza Group LTD DPZ Stock’s Technical Performance Broken Down
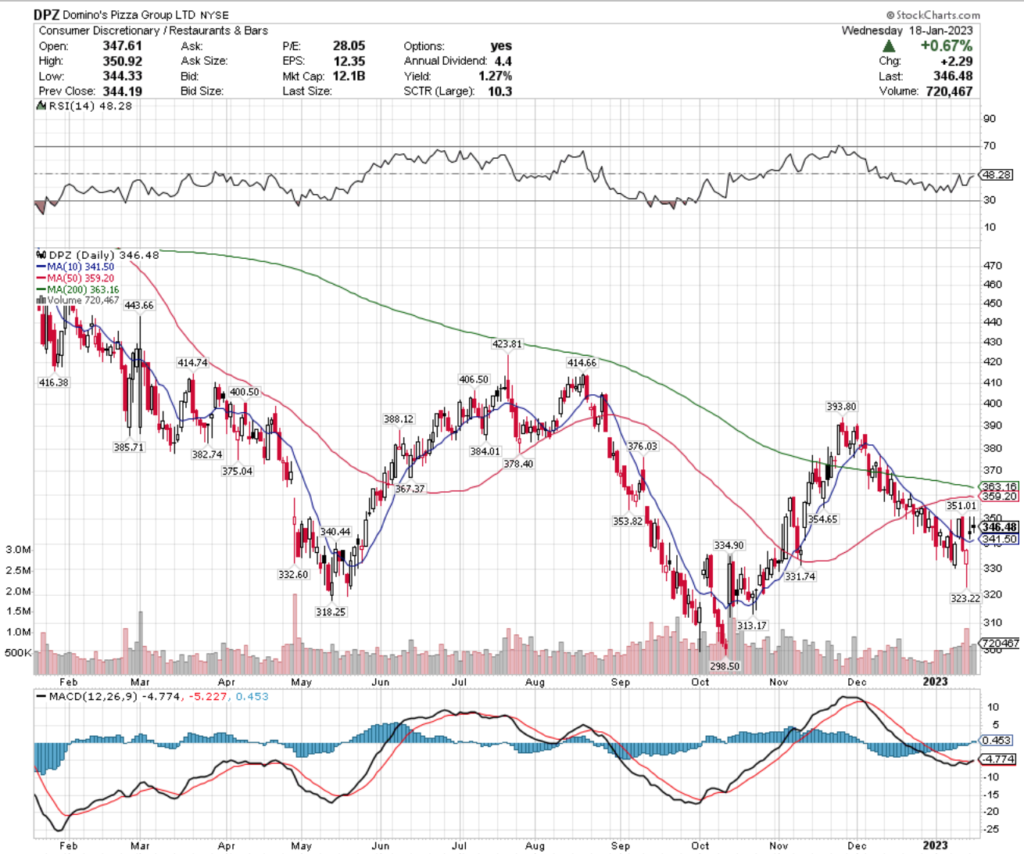
Domino’s Pizza Group LTD DPZ Stock’s Technical Performance Over The Last Year
DPZ Stock Price: $346.48
10 Day Moving Average: $341.50
50 Day Moving Average: $359.20
200 Day Moving Average: $363.16
RSI: 48.28
MACD: -4.774
Yesterday, DPZ stock completed a bullish MACD crossover, rising +0.67% for the session.
Recent trading volumes are slightly below their annual average & their RSI is about neutral, signaling uncertainty on where the market values their share price.
This volatility will provide entry points for traders & investors to build upon or begin a DPZ stock position.
DPZ stock has support at the $341.50 & $340.44/share price levels, as they try to break out above their $351.01 & $353.82/share resistance levels.
Domino’s Pizza Group LTD DPZ Stock As A Long-Term Investment
Long-term oriented investors will like DPZ stock’s 27.32 P/E (ttm), but will be disappointed by their P/B (mrq).
They recently reported 7.1% Quarterly Revenue Growth Y-o-Y, with -16.5% Quarterly Earnings Growth Y-o-Y.
Their balance sheet will also require a more thorough examination, with $114.78M of Total Cash (mrq) & $5.38B of Total Debt (mrq).
DPZ stock pays a 1.23% dividend, which appears to be sustainable in the long-run, as their payout ratio is 34.33%.
93.83% of DPZ stock’s outstanding share float is owned by institutional investors.
Domino’s Pizza Group LTD DPZ Stock As A Short-Term Trade Using Options
Traders who have shorter time frames can trade options to profit from DPZ stock’s price movements, while also protecting their portfolios from broader market volatility.
I am looking at the contracts with the 2/17 expiration date.
The $330, $340 & $320 call options are all in-the-money, listed from highest to lowest level of open interest.
The $350, $360 & $370 puts are also all in-the-money, listed from most to least liquid strike.
Tying It All Together
DPZ stock has many interesting attributes that investors and traders are sure to like.
Investors will like their dividend yield, but may want to review their balance sheet structure in more detail before investing.
Traders will like their recent technical performance & how liquid their options are.
All-in-all, it is worth taking a closer look into DPZ stock to see how it fits into your portfolio strategy.
*** I DO NOT OWN SHARES NOR OPTIONS CONTRACT POSITIONS AROUND DPZ STOCK AT THE TIME OF PUBLISHING THIS ARTICLE ***
Caseys General Store, Inc. stock trades under the ticker CASY & has shown recent bullishness that traders & investors should research further into.
CASY stock closed at $229.95/share on 1/17/2023.
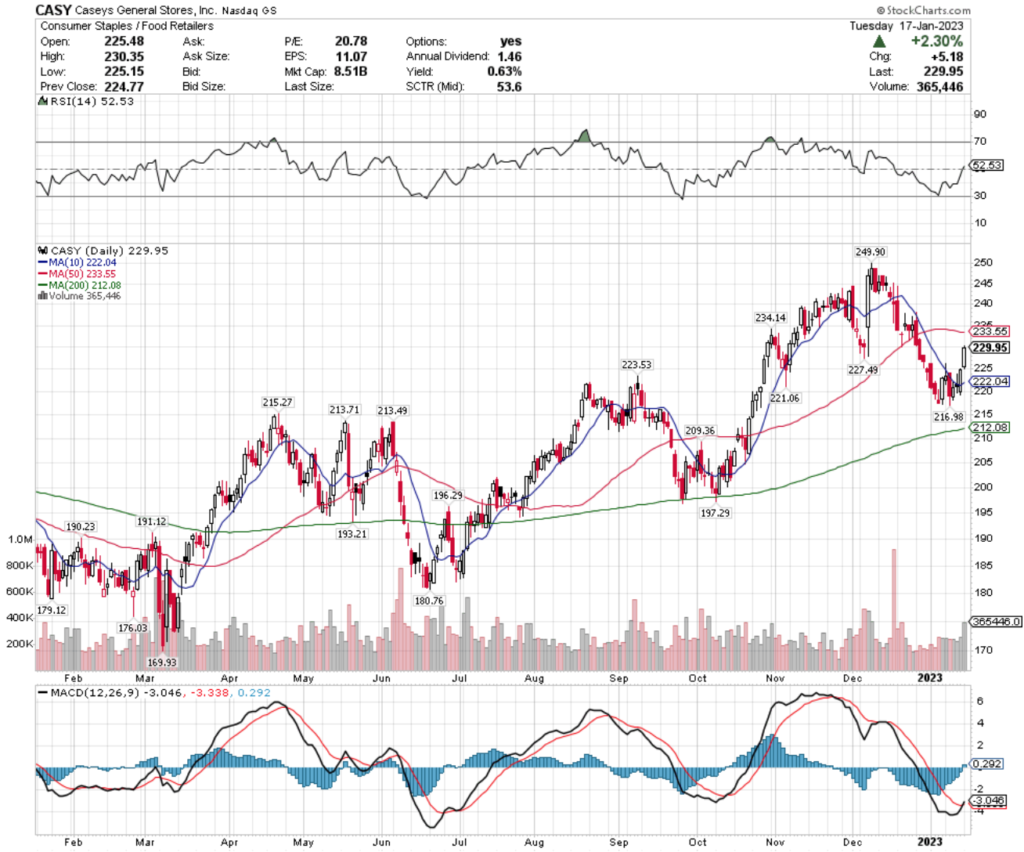
Caseys General Store, Inc. CASY Stock’s Technical Performance Broken Down
CASY Stock Price: $229.95
10 Day Moving Average: $222.04
50 Day Moving Average: $233.55
200 Day Moving Average: $212.08
RSI: 52.53
MACD: -3.046
Yesterday, CASY stock completed a bullish MACD crossover, gapping up +2.3% for the day’s session.
Recent trading volumes have been about average compared to the year prior, and their RSI is neutral, signaling that they may have more short-term momentum to come.
CASY stock has support at the $227.49 & $223.53/share price level, as they try to break out above the $233.55 & $234.14/share resistance levels.
Caseys General Store, Inc. CASY Stock As A Long-Term Investment
Long-term oriented investors will like CASY stock’s 20.3 P/E (ttm), but will find their 3.33 P/B (mrq) to be a bit higher than they’d like.
They recently reported 21.9% Quarterly Revenue Growth Y-o-Y, with 42.1% Quarterly Earnings Growth Y-o-Y.
Their balance sheet will require a more thorough examination, with $414.8M of Total Cash (mrq) & $1.67B of Total Debt (mrq).
CASY stock pays a 0.65% dividend, which appears to be sustainable in the long-run, as their payout ratio is 13.19%.
87.24% of CASY stock’s outstanding share float is owned by institutional investors.
Caseys General Store, Inc. CASY Stock As A Short-Term Trade Using Options
Traders with shorter time horizons can trade options to profit from CASY stock’s price movements, while protecting their portfolios from volatility.
I am looking at the contracts with the 2/17 expiration date.
The $220, $210 & $195 call options are all in-the-money, listed from highest to lowest level of open interest.
The $230, $240 & $260 puts are also all in-the-money, with the former strikes being more liquid than the latter.
Tying It All Together
CASY stock has many interesting characteristics that traders & investors will find appealing.
Investors will like their recent growth & dividend yield, but may want to look closer into the makeup of their balance sheet.
Traders will like their recent technical performance, but may wish their options were a bit more liquid.
Overall, it is worth taking a closer look into CASY stock to see how it fits into your portfolio strategy.
*** I DO NOT OWN SHARES OR OPTIONS POSITIONS AROUND CASY STOCK AT THE TIME OF PUBLISHING THIS ARTICLE ***
Microsoft Corp. stock trades under the ticker MSFT & has shown recent bullish behavior that traders & investors should research deeper into.
MSFT stock closed at $239.23/share on 1/14/2023.
Microsoft Corp. MSFT Stock’s Technical Performance Broken Down
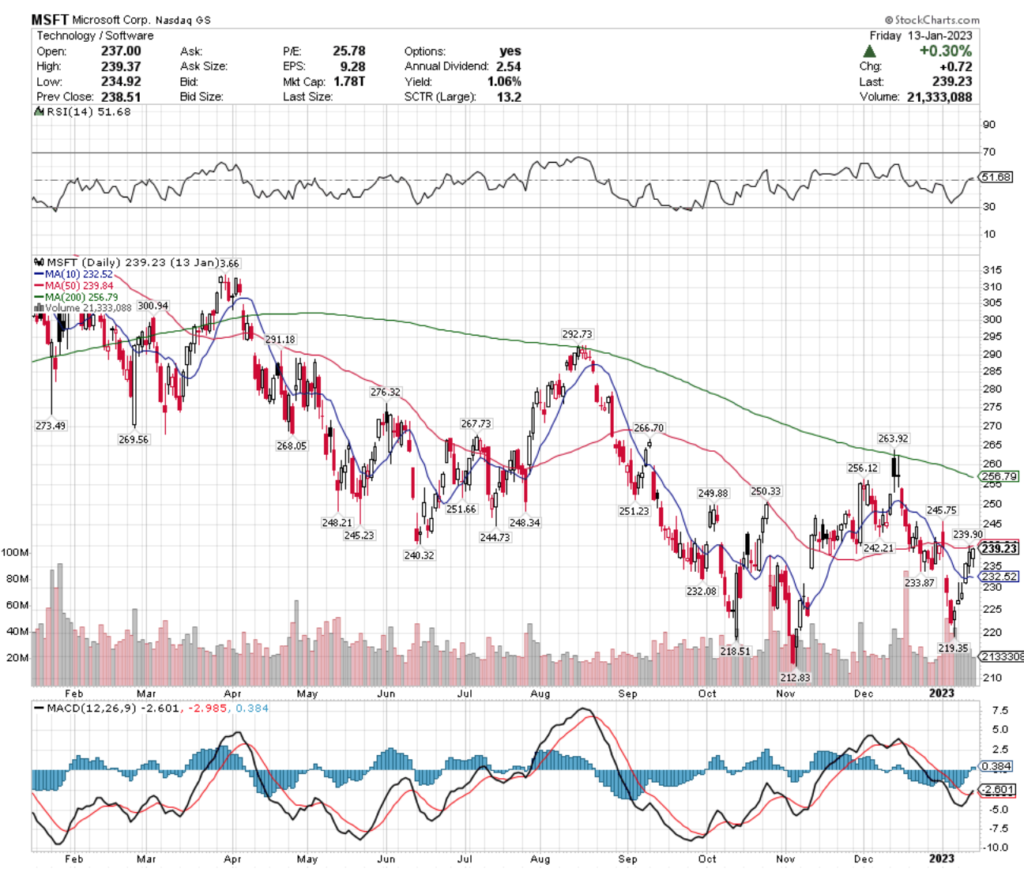
Microsoft Corp. MSFT Stock’s Technical Performance Over The Last Year
MSFT Stock Price: $239.23
10 Day Moving Average: $232.52
50 Day Moving Average: $239.84
200 Day Moving Average: $256.79
RSI: 51.68
MACD: -2.601
On Friday, MSFT stock completed a bullish MACD crossover, closing +0.3% on the day.
Despite having decent volume compared to the year prior & 6 straight days of gains, Friday’s hanging man candle implies a bearish movement on the horizon for them, which may offer new entries into positions.
MSFT stock has support at the $233.87 & $232.52/share price level, as they try to break out above the $239.84 & $240.32/share resistance levels.
Microsoft Corp. MSFT Stock As A Long-Term Investment
Long-term oriented investors will like MSFT stock’s 25.75 P/E (ttm), but will find their 10.27 P/B (mrq) to be higher than they’d normally like.
They recently reported 10.6% Quarterly Revenue Growth Y-o-Y, with -14.4% Quarterly Earnings Growth Y-o-Y.
Their balance sheet looks strong, with $107.24B of Total Cash (mrq) & $77.14B of Total Debt (mrq).
MSFT stock pays a 1.06% dividend, which appears to be sustainable in the long-run, with a 26.7% payout ratio.
73.35% of MSFT stock’s outstanding share float is owned by institutional investors.
Microsoft Corp. MSFT Stock As A Short-Term Trade Using Options
Traders who are interested in shorter time frames can use options to profit from MSFT stock’s price movements, while hedging their portfolio against broader market volatility.
I am looking at the contracts with the 2/17 expiration date.
The $235, $230 & $225 calls are all in-the-money, listed in order of highest to lowest level of open interest.
The $240, $245 & $250 puts are also all in-the-money, with the former being more liquid than the latter strikes.
Tying It All Together
MSFT stock has many interesting characteristics that traders & investors should find appealing.
Investors will like their healthy balance sheet & dividend yield.
Traders will like their recent technical performance & their liquid options market.
All-in-all, it is worth taking a closer look into how MSFT stock fits into your portfolio strategy.
*** I DO NOT OWN SHARES OF NOR OPTIONS POSITIONS AROUND MSFT STOCK AT THE TIME OF PUBLISHING THIS ARTICLE ***
Last week most market participants’ focus was on the CPI readings that came out largely in-line with expectations, as well as a number of speeches by US Federal Reserve officials, before banks began reporting earnings on Friday.
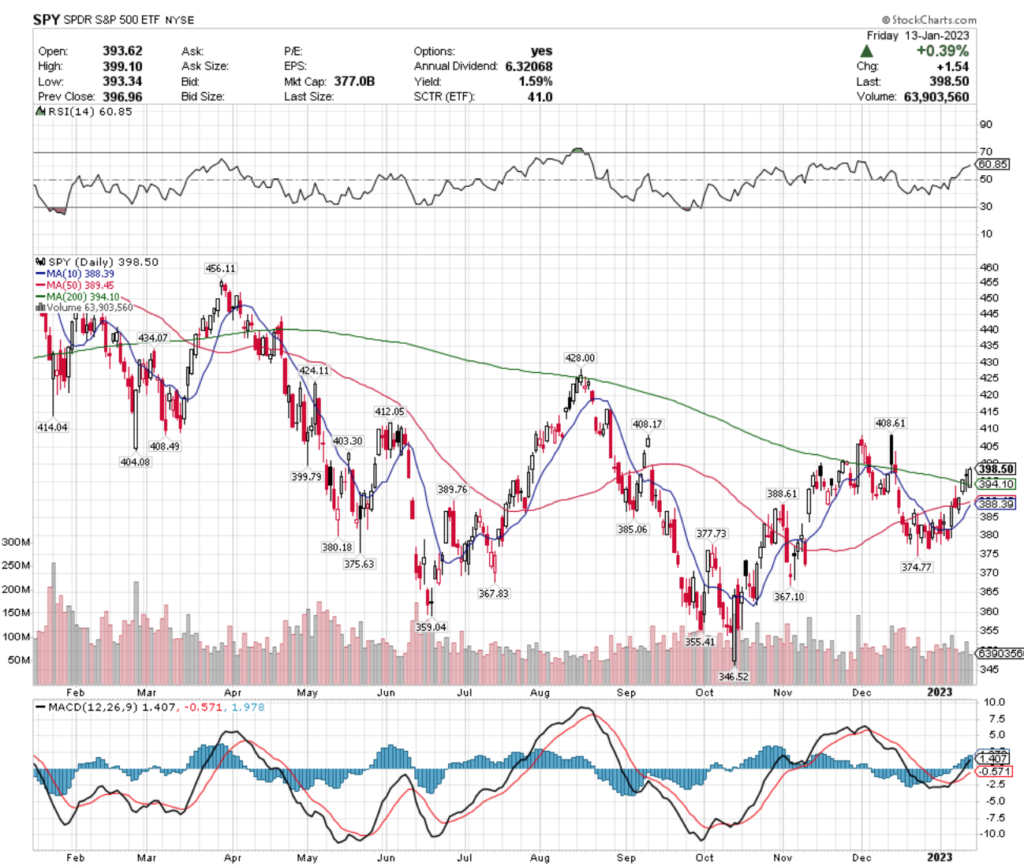
SPY, the SPDR S&P 500 ETF closed +2.69% this past week, as traders & investors began adding to their holdings after many watched the markets for the first trading week of the year.
SPY ETF – SPDR S&P 500 ETF
Their next test of resistance will be the $399.79/share price level, finding support at their 200 Day Moving Average at $394.10.
Despite many market participants choosing to wait & watch during the year’s first trading week, volumes decreased week-over-week for SPY, signaling investors are still on the fence as earnings calls for Q4 2022 begin kicking off.
The $388-389 price zone will be an area to watch over the coming week(s), to gauge how the index will head next as more & more earnings data comes in.
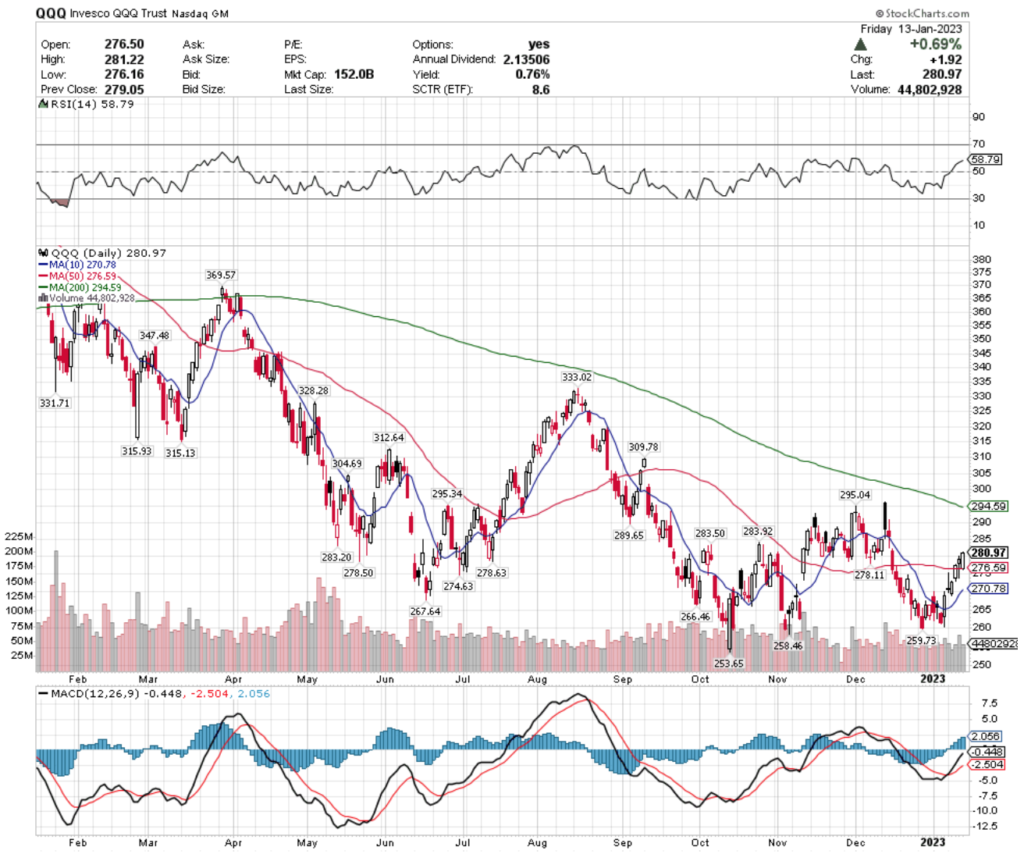
QQQ, the Invesco QQQ Trust ETF gained 4.53% during the last week, trading on higher volume than the previous week (unlike SPY).
QQQ ETF – Invesco QQQ Trust ETF
Their MACD is beginning to signal a bearish rollover, and it will be interesting to see how much support they find in the $278 range (multiple support points between $278-279), as they look to try to break above their resistance zone in the $283-284 price range.
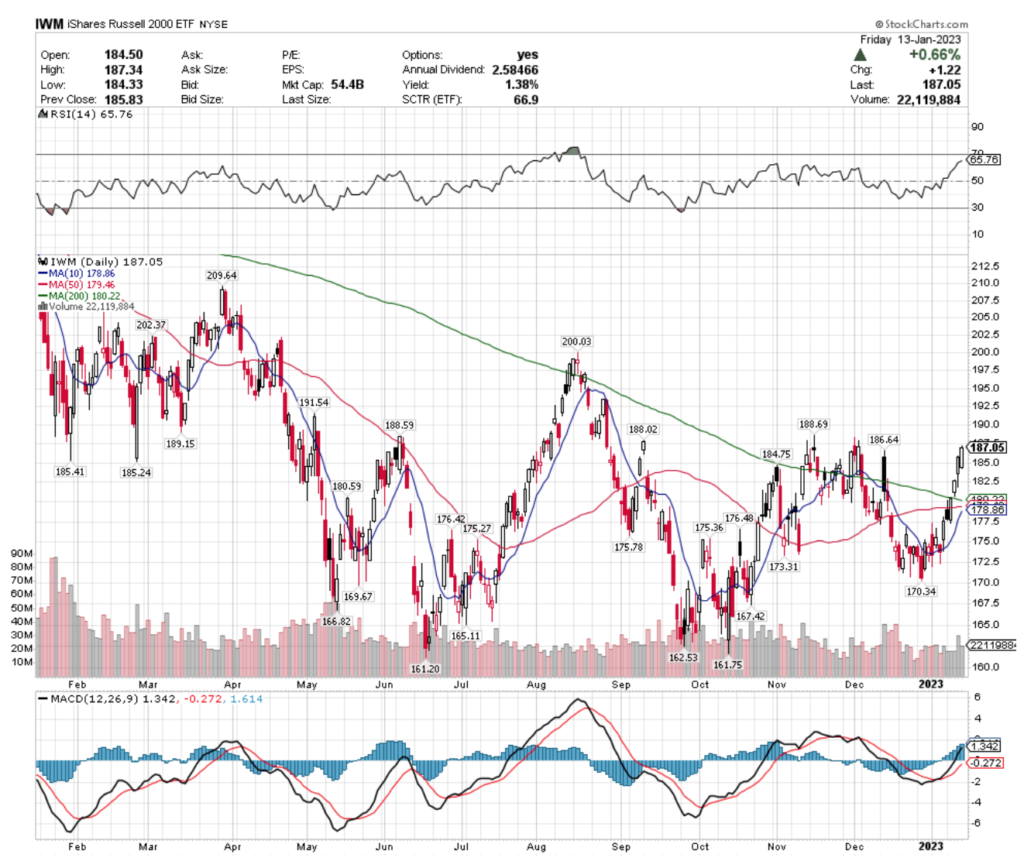
They are set to have a few resistance levels in the $188-189 range, with support at the $186.64/share level.
Small caps look to be more overbought than their larger peers based on the RSI‘s above, but the week ahead’s earnings call results may change that tone.
Let’s get into this week’s out-performers & laggers.
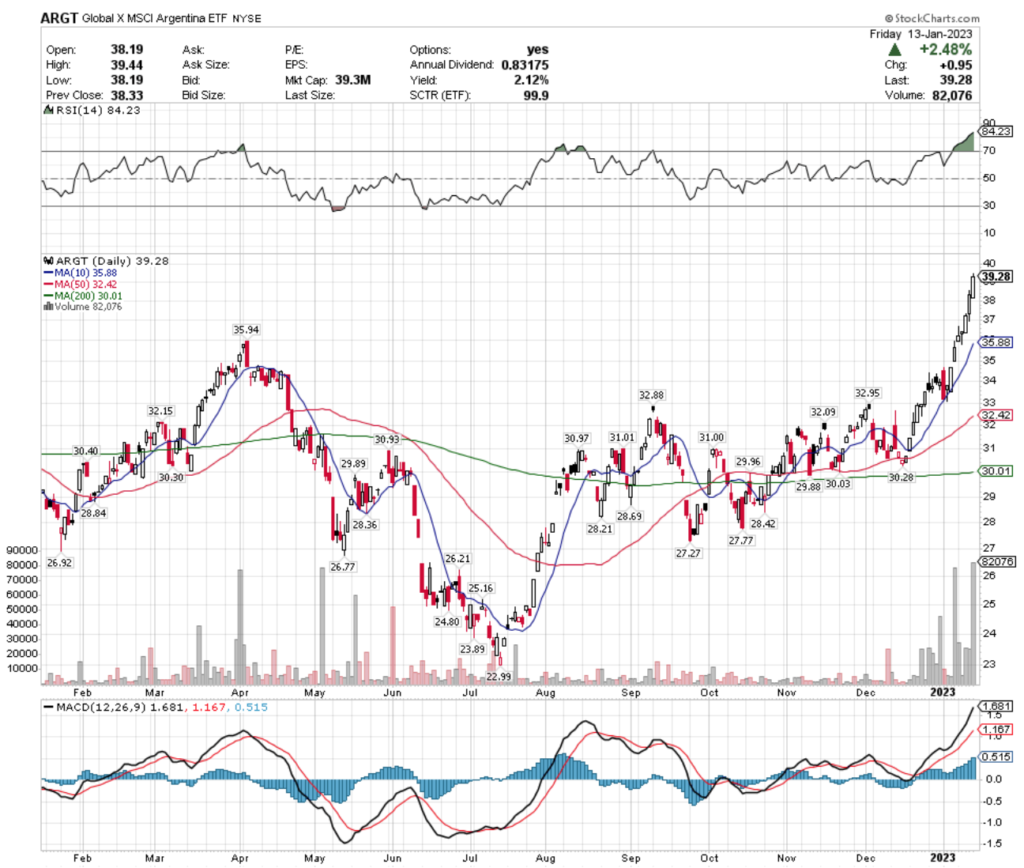
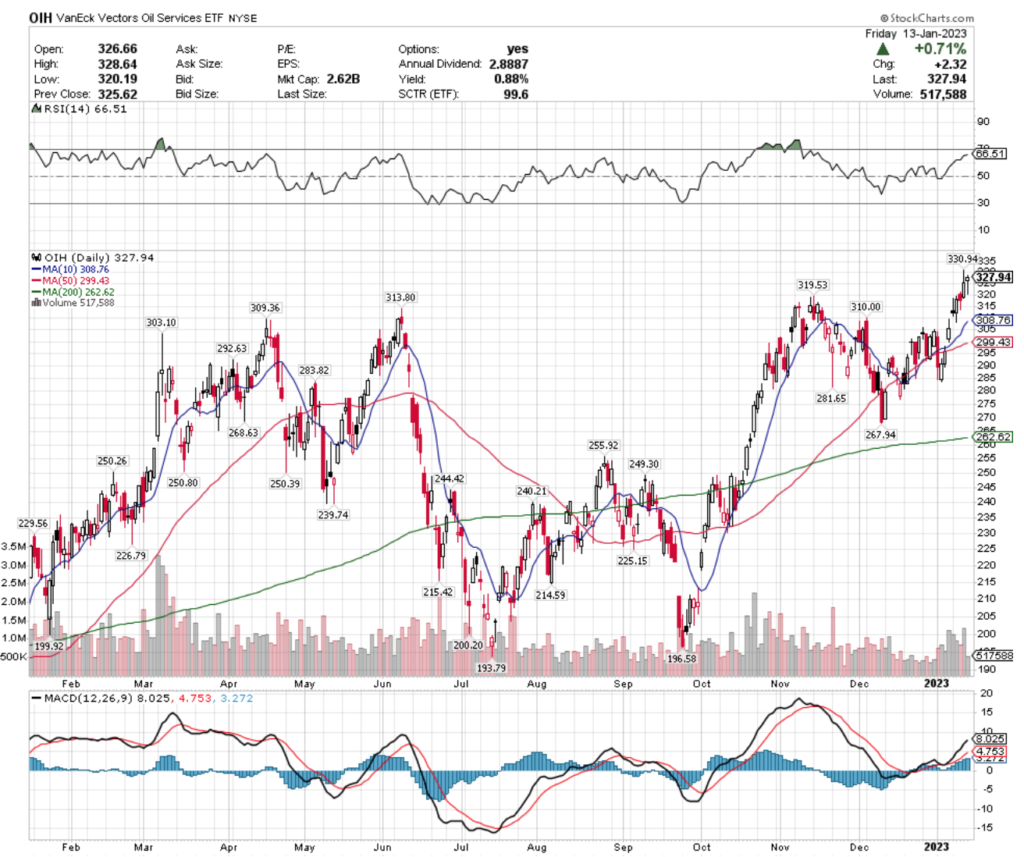
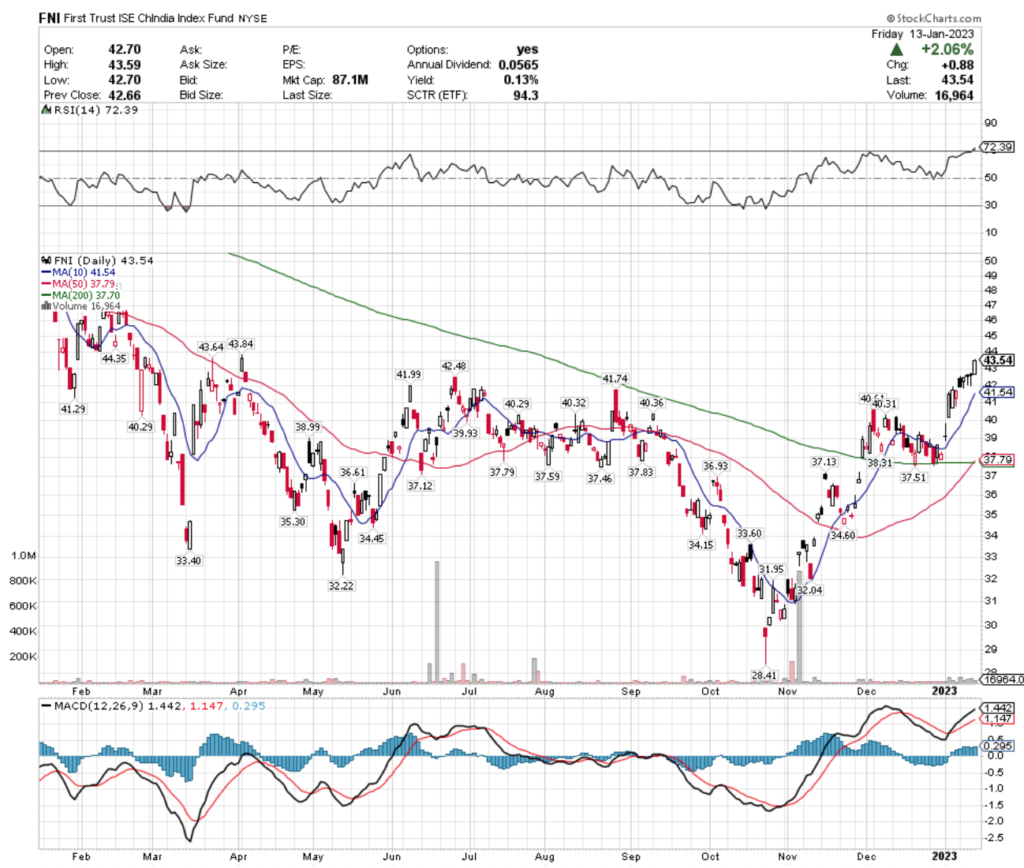
Argentina (ARGT), Copper Miners (COPX), Oil Services (OIH) & Chindia (FNI) All Bullishly Leading The Market
While they offer protection for investors in the form of their 2.12% dividend, their RSI is currently very overbought at 84.23.
While volumes have been above average for 2023 vs. the year prior, it looks best to wait before investing in a new ARGT position or adding to existing holdings.
Savvy traders can utilize options to create profits in the meantime that can be put towards adding to ARGT shares as their price cools off.
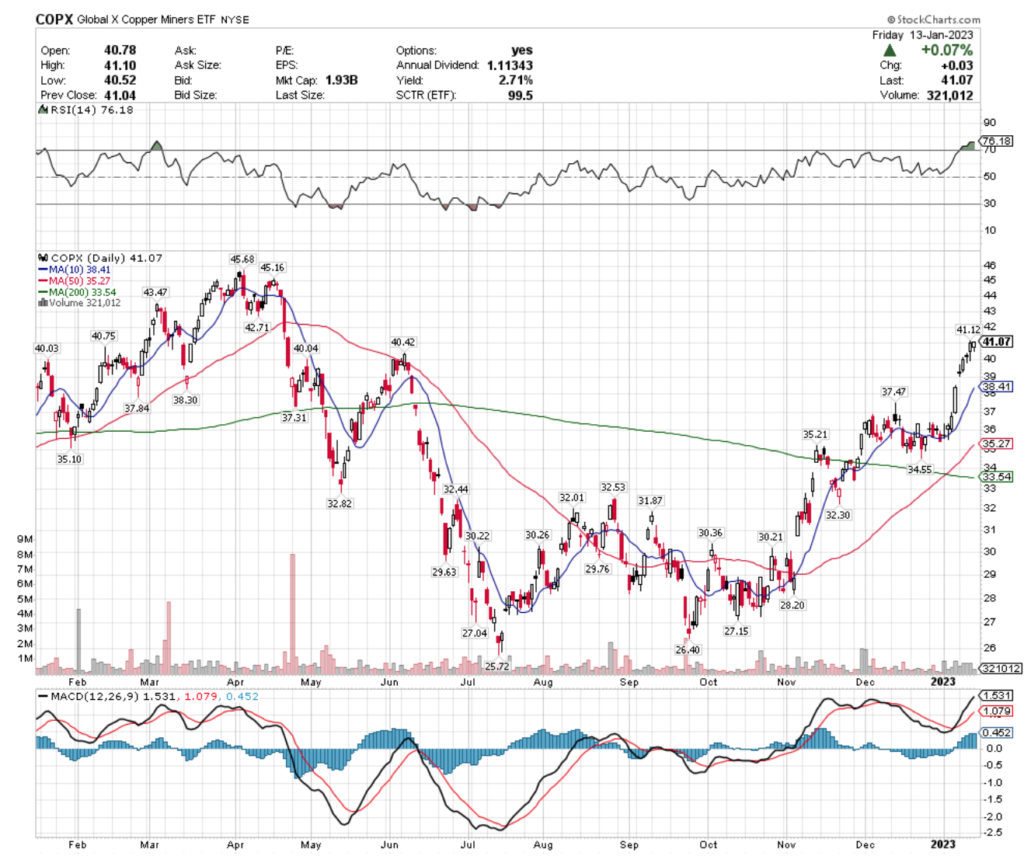
COPX, the Global X Copper Miners ETF has also enjoyed a steep recovery since their July 2022 lows, gaining back ~60% & approaching their 2022 highs from March & April.
COPX ETF – Global X Copper Miners ETF
Like ARGT, COPX also is currently overbought in the near-term, with an RSI of 76.18.
While they pay a 2.71% dividend to investors who are willing to hold their shares for a year, it may be wise to wait until their share price cools off & to see how they interact with the $40 price level.
With support at $40.04 & $40.03 & gaps before the next support ($38.41), downward momentum may cause this ETF to fall beyond the dividend’s ability to break even & by that point have additional downward momentum.
While their RSI is still not outright overbought, it is approaching it, signaling to investors that now is not the best time to establish a position, nor to add to an existing one.
With only a 0.88% dividend yield, there is even less of a cushion than the prior two examples, plus they currently only have one resistance level above their current price within the last year & a hanging man candle from Friday 1/13/2023.
While they’re a name to keep on your radar, it looks safest to wait to see how they fare with the $319.53 & $313.80 support levels before entering a new position.
OIH also has options which can be utilized for profits while awaiting to see how they fare moving forward.
Gaining 53% since their 2022 low in October, they now face resistance tests at $43.64 & $43.84/share, while their overbought RSI (72) signals their need to cool off in the meantime.
Given the negligible dividend they offer, this one will not offer much in means of protection against losses & they do not have tradable options, which may further dissuade investors from them.
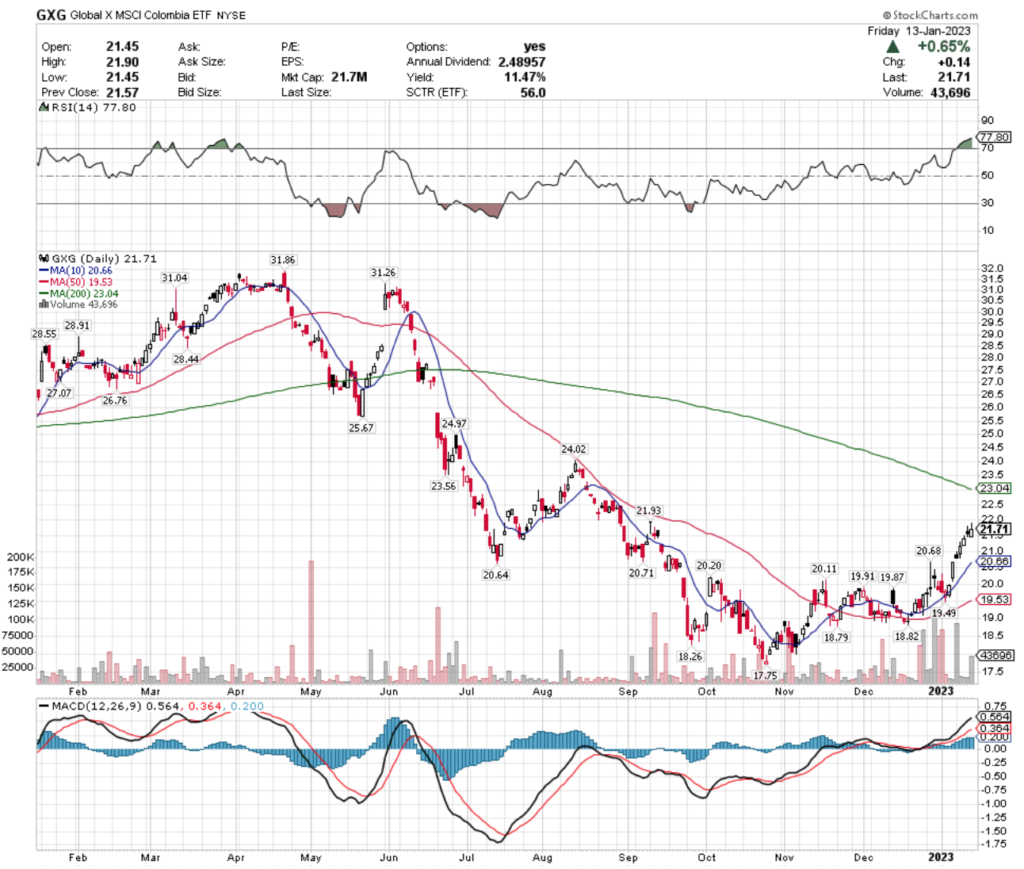
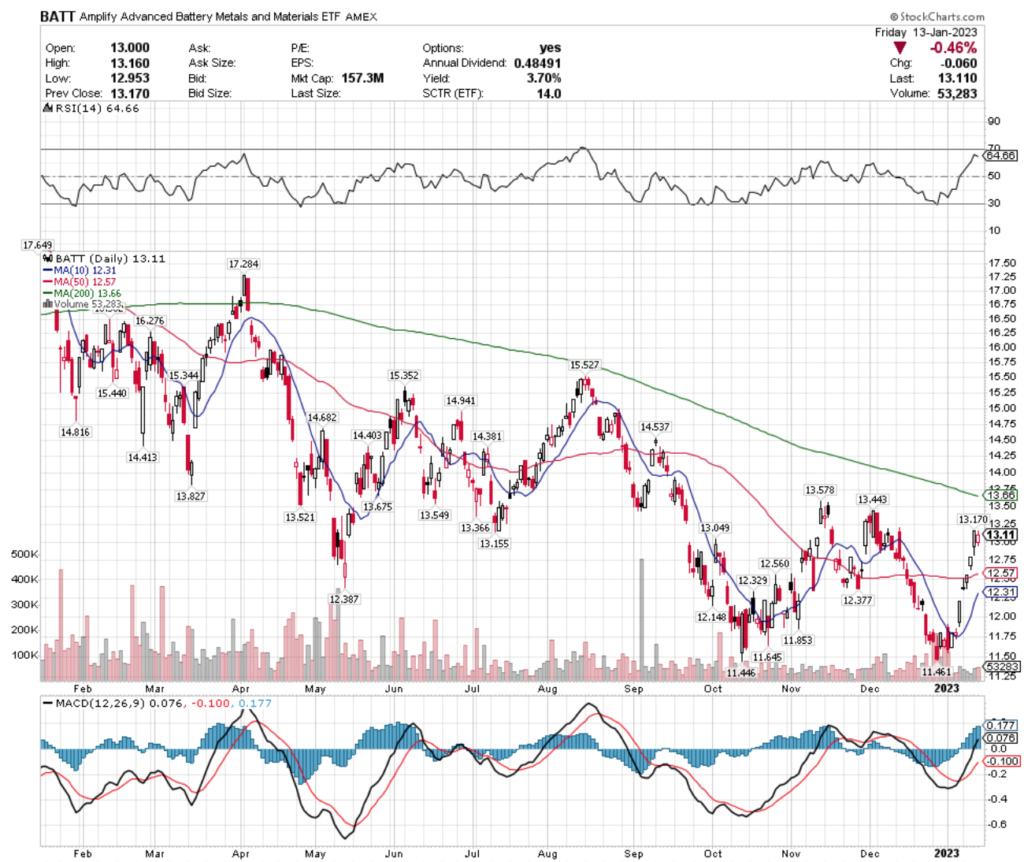
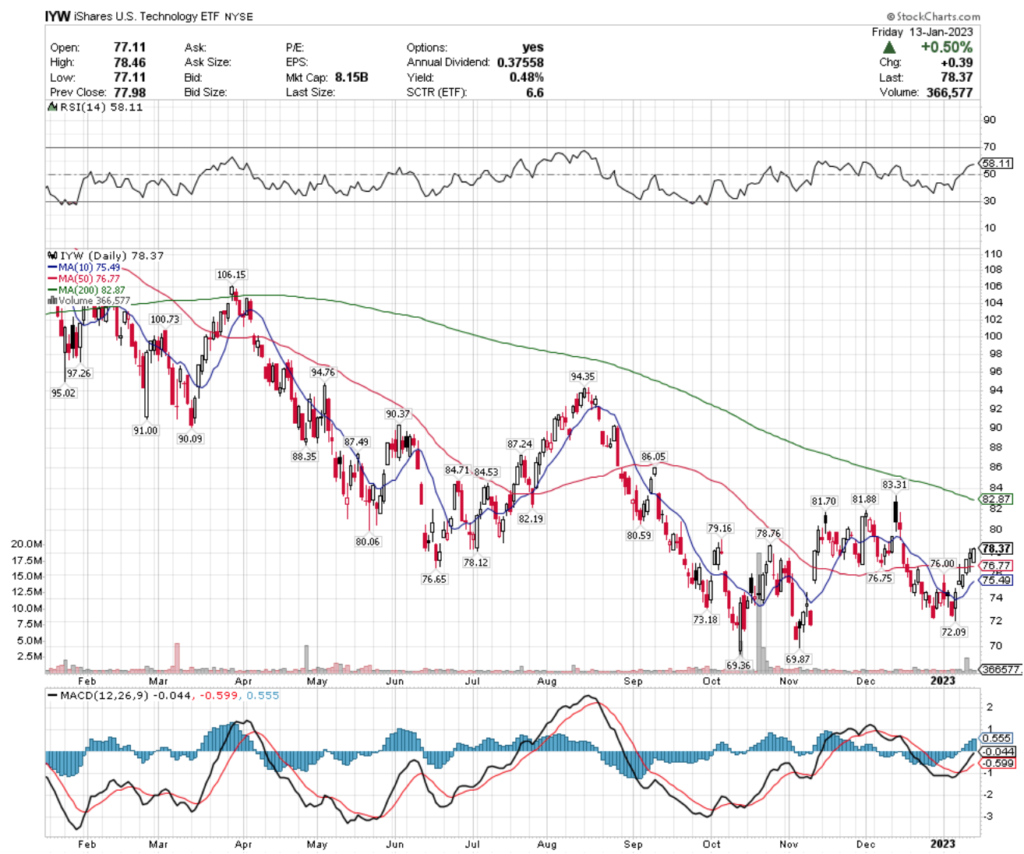
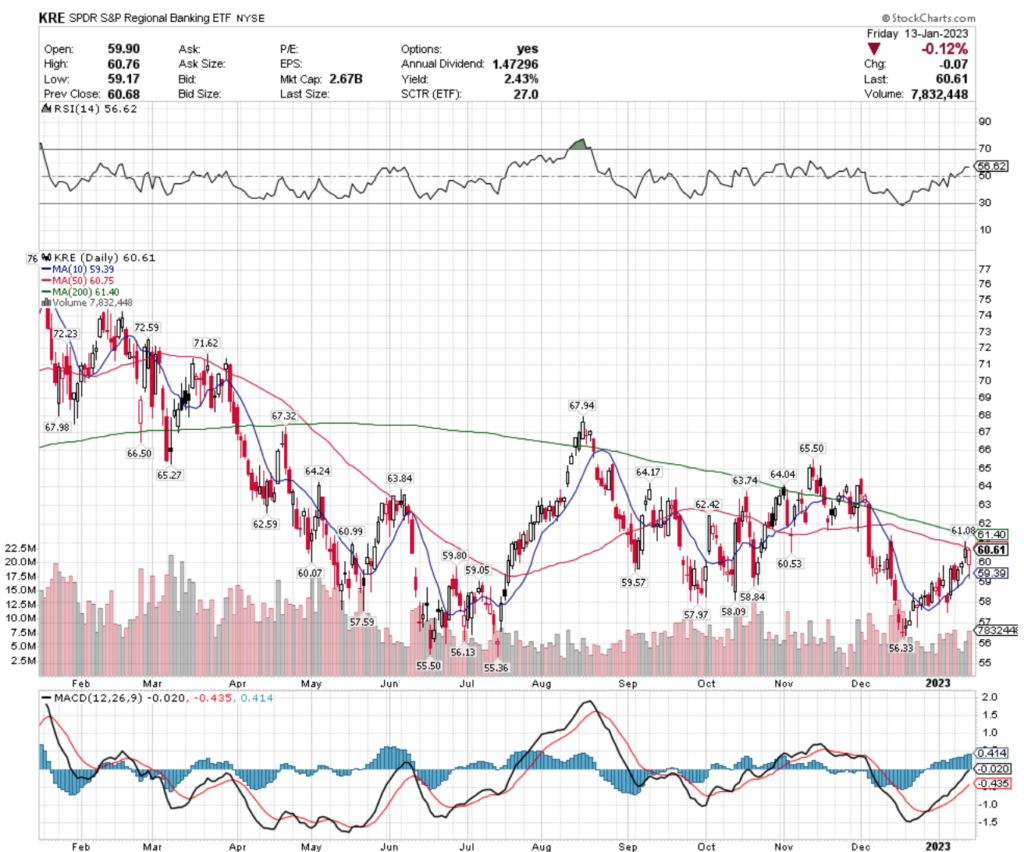
Colombia (GXG), Battery Metals & Materials (BATT), US Technology (IYW) & Regional Banking (KRE) All Bearishly Lagging The Market
While their overbought RSI signals that they are due to cool off in the near-term, they offer an 11% dividend, which provides protection down to their $19.53 support level.
With this in mind, there is wiggle room for loss on the way down, and GXG does have options that can be utilized for near-term profits even as the ETF declines.
Their 3.7% dividend offers some cushion, and their options can be traded while investors wait to see how they handle the $12.56/57 support levels that are just beneath a couple of gaps.
One note, there are additional gaps beneath this support, so it would be wise to pay strong attention to any buying done in this zone, as the ladder could be kicked out from underneath them at any moment.
They sport a negligible dividend that offers limited protection from further price declines (0.48%).
The $78.12 support level will be important to watch, as if they break below that there is high likelihood that they cross into the $76/share range before finding support & establishing a floor/price range.
While their RSI is still neutral, they will not be immune to broader market sell-offs, and offer only 2.43% of cushion from losses in their dividend.
While they have many support points beneath them, this is a name to be keeping an eye on in the coming weeks, but not necessarily ready for an entry into a position just yet.
Tying It All Together
This week earnings calls continue after our Monday holiday, with Goldman Sachs, Morgan Stanley, United Airlines & others reporting on Tuesday.
On Tuesday the Empire State Manufacturing Index number will be reported, followed by Retail Sales, PPI Final Demand, Industrial Production, Capacity Utilization, the NAHB Home Builder’s Index & the Fed’s Beige Book on Wednesday.
Thursday we hear about initial jobless claims (and continuing), as well as Building Permits, Housing Starts, the Philadelphia Fed’s Manufacturing Index & the Fed’s Brainard will also be speaking.
Friday morning we get Existing Home Sales (SAAR) numbers, and Fed Governor Christopher Waller will be speaking at the Council on Foreign Relations.
Enjoy the rest of the long weekend & see you back here next week!
*** I DO NOT OWN SHARES OR OPTIONS POSTIONS IN SPY, QQQ, IWM, ARGT, COPX, OIH, FNI, GXG, BATT, IYW, or KRE AT THE TIME OF PUBLISHING THIS ARTICLE ***
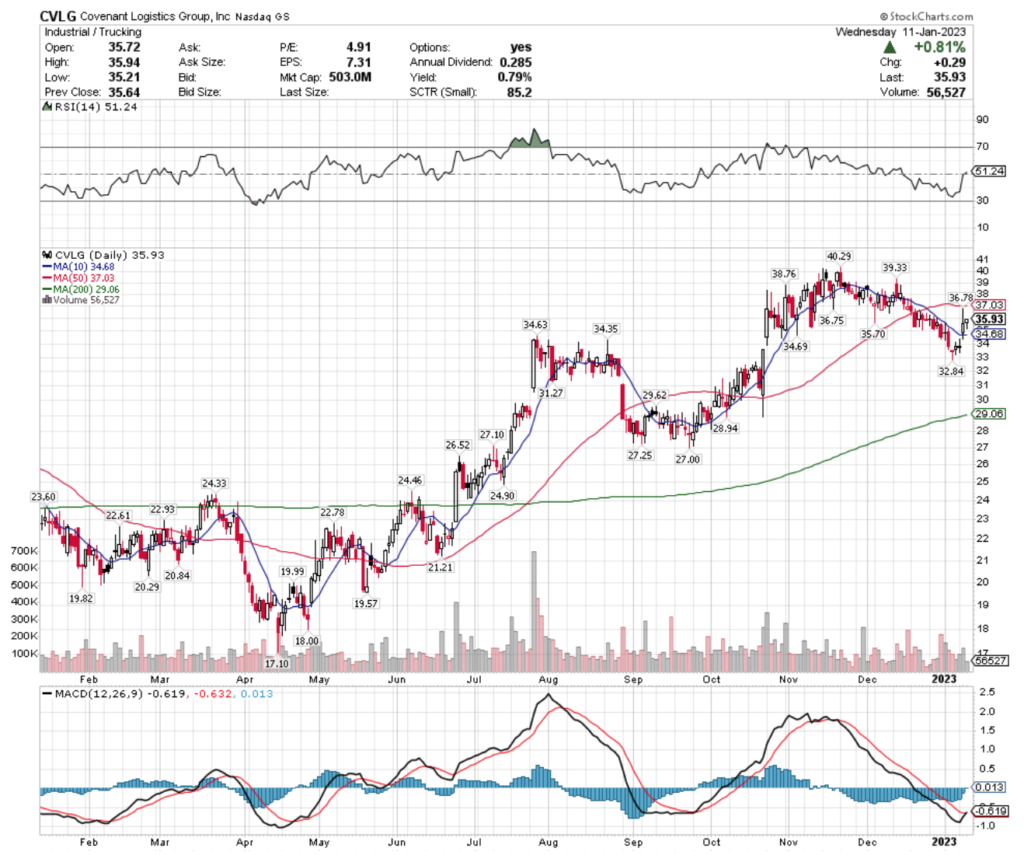
Covenant Logistics Corp. stock trades under the ticker CVLG & has shown recent bullish behavior that traders & investors should take a closer look at.
CVLG stock closed at $35.93/share on 1/11/2023.
Covenant Logistics Corp. CVLG Stock’s Technical Performance Broken Down
CVLG Stock Price: $35.93
10 Day Moving Average: $34.68
50 Day Moving Average: $37.03
200 Day Moving Average: $29.06
RSI: 51.24
MACD: -0.619
Yesterday, CVLG stock completed a bullish MACD crossover, rising 0.81% on the day.
Recent trading volumes have been about average compared to the year prior & their RSI is neutral at 51, however their near-term may be volatile with yesterday’s hanging man candlestick (bearish signal).
CVLG stock has support at the $35.70 & $34.69/share price levels, as they try to break out & above the $36.75-8 zone & $37.03 resistance levels.
Covenant Logistics Corp. CVLG Stock As A Long-Term Investment
Long-term investors will like CVLG stock’s valuation metrics, with a 4.73 P/E (ttm) & a 1.20 P/B (mrq).
They recently reported 13.6% Quarterly Revenue Growth Y-o-Y, with 207.1% Quarterly Earnings Growth Y-o-Y.
Their balance sheet will require a more thorough analysis, with $59.26M of Total Cash (mrq) & $134.96M of Total Debt (mrq).
CVLG pays a modest 0.58% dividend, which appears to be very sustainable in the long-run, as their payout ratio is 2.87%.
69.32% of CVLG stock’s outstanding share float is owned by institutional investors.
Covenant Logistics Corp. CVLG Stock As A Short-Term Trade Using Options
Traders who are focused on short-term time frames can trade options to profit from price movements in CVLG stock, while protecting their portfolio from volatility.
I am looking at the contracts with the 3/17 expiration date.
The $30, $35 & $25 calls are all in-the-money, listed from highest to lowest level of open interest.
Currently there is only open interest in the $40 puts, however, other in-the-money strikes may become more liquid after the 1/20 & 2/17 expiration dates pass.
Tying It All Together
CVLG stock has many interesting traits that investors & traders are sure to find appealing.
Investors will like their valuation metrics & the security of their dividend, although its yield is awfully low.
Traders will like their recent technical performance, but may need to wait for more contracts to be written for the 3/17 expiration that are in-the-money after other monthly expiration dates pass.
Overall, it is worth taking a closer look into CVLG stock to see how it fits into your portfolio strategy.
*** I DO NOT OWN SHARES OR OPTIONS POSITIONS OF CVLG STOCK AT THE TIME OF PUBLISHING THIS ARTICLE ***
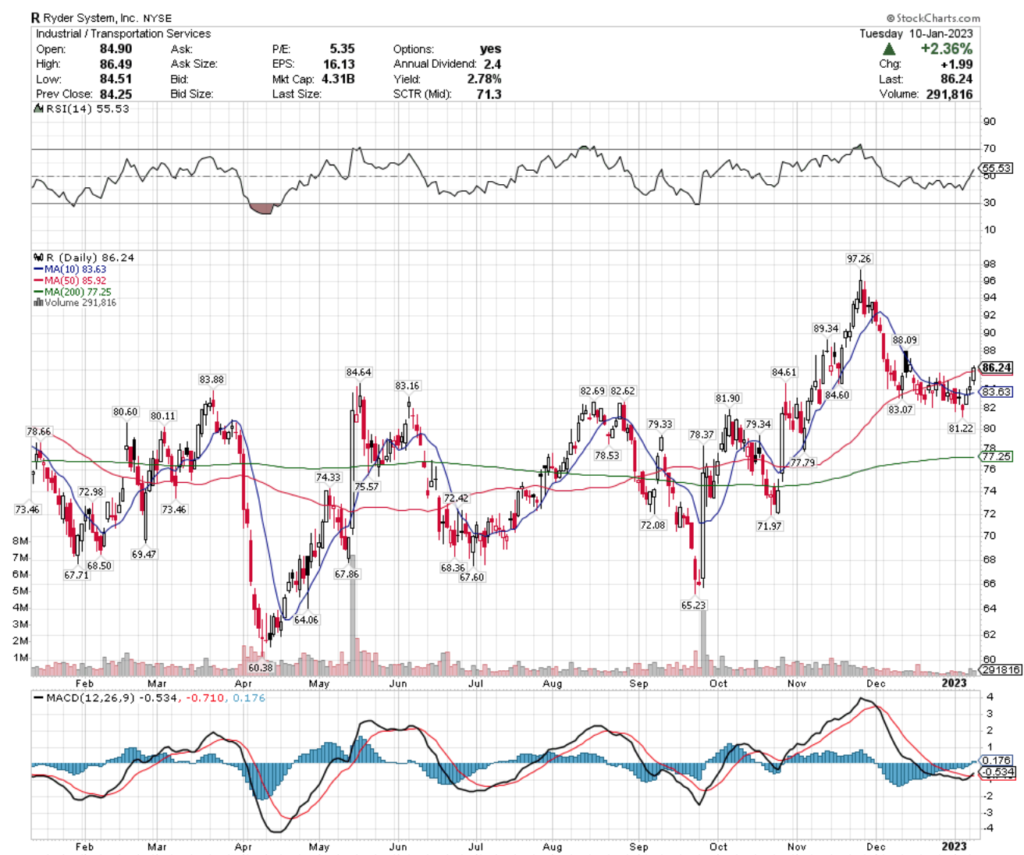
Ryder Systems, Inc. stock trades under the ticker R & has shown recent bullish behavior that traders & investors should take a closer look into.
R stock closed at $55.53/share on 1/10/2023.
Ryder Systems, Inc. R Stock’s Technical Performance Broken Down
R Stock Price: $55.53
10 Day Moving Average: $83.63
50 Day Moving Average: $85.92
200 Day Moving Average: $77.25
RSI: 55.53
MACD: -0.534
Yesterday, R stock completed a bullish MACD crossover, rising 2.36% on the day.
Recent trading volumes have been lighter than usual, and their RSI is neutral, signaling that they may face a hard test at the $88/share price level.
R stock has support at the $85.92 & $84.64/share price levels, while they look to break above the $88.09 & $89.34/share resistance levels.
Ryder Systems, Inc. R Stock As A Long-Term Investment
Long-term oriented investors will like R stock’s valuation metrics, with a 5.14 P/E (ttm) & a 1.39 P/B (mrq).
They recently reported 23.4% Quarterly Revenue Growth Y-o-Y, with 78.2% Quarterly Earnings Growth (Y-o-Y).
Their balance sheet will require a more thorough examination, with $456.29M of Total Cash (mrq) & $6.89B of Total Debt (mrq).
R stock pays a 2.8% dividend, which appears to be sustainable in the long-run, as their payout ratio is 14.54%.
86.3% of R stock’s outstanding share float is owned by institutional investors.
Ryder Systems, Inc. R Stock As A Short-Term Trade Using Options
Traders who are focused on shorter time horizons can trade options to profit from price movements in R stock, while protecting their portfolio from volatility.
I am looking at the contracts with the 1/20 expiration date.
The $85, $70 & $75 call options are all in-the-money, listed from most to least liquid strike price.
The $90 & $100 puts are also in-the-money, with the former having more open interest than the latter strike.
Tying It All Together
R stock has many interest characteristics that traders & investors are sure to like.
Investors will like their valuation metrics & dividend yield, but may want to review their balance sheet further before investing.
Traders will like their recent technical performance & the liquidity of their options.
Overall, it is worth taking a closer look into R stock to see how it fits into your portfolio strategy.
*** I DO NOT OWN SHARES OR OPTIONS POSITIONS IN R STOCK AT THE TIME OF PUBLISHING THIS ARTICLE ***
Wabash National Corp. stock trades under the ticker WNC & has shown recent bullish behavior that traders & investors should look deeper into.
WNC stock closed at $24.03/share on 1/9/2021.
Wabash National Corp. WNC Stock’s Technical Performance Broken Down
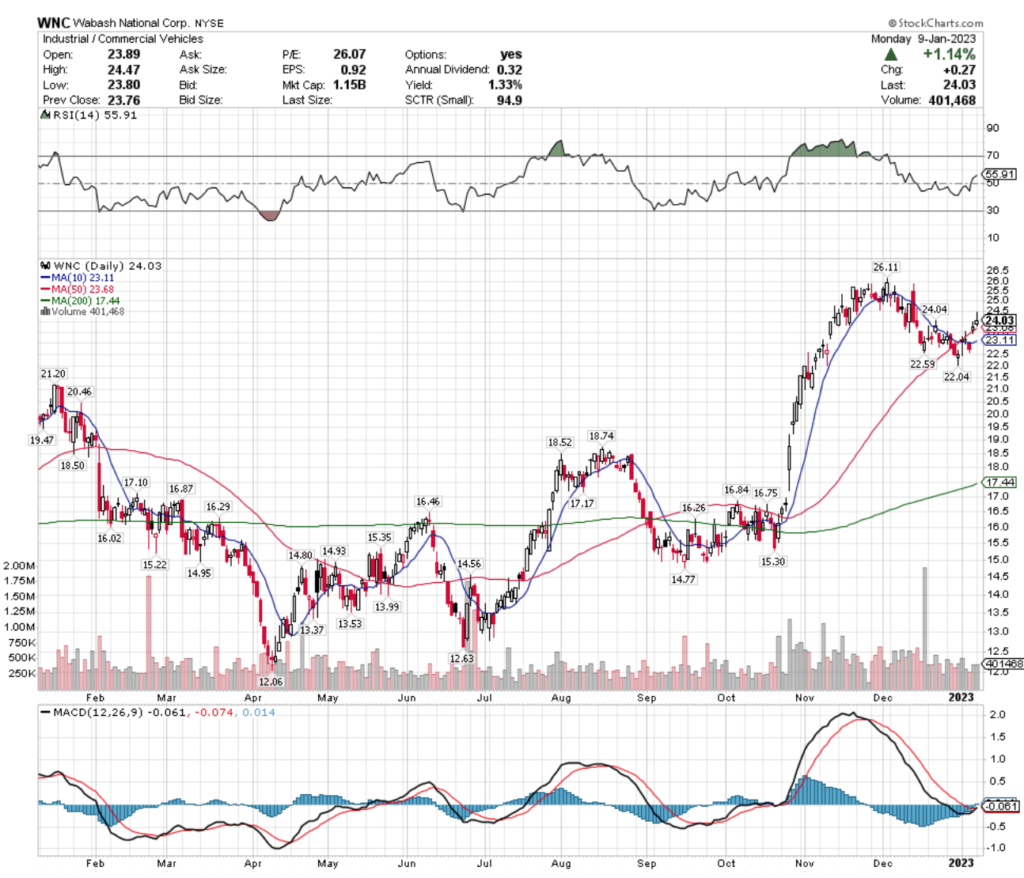
WNC Stock Price: $24.03
10 Day Moving Average: $23.11
50 Day Moving Average: $23.68
200 Day Moving Average: $17.44
RSI: 55.91
MACD: -0.061
Yesterday, WNC stock completed a bullish MACD crossover, gaining 1.14% on the day.
Their RSI is on the overbought side of neutral at 55.91 & their recent trading volumes have been above average compared to the year higher, signaling that if they break above their $24.04 resistance level there may be more short-term bullish momentum.
WNC stock has support at the $23.68 & $23.11/share price levels, as they try to break out above the $24.04 & $26.11/share resistance levels.
Wabash National Corp. WNC Stock As A Long-Term Investment
Long-term focused investors will like WNC stock’s 25.28 P/E (ttm), but may find their 3.16 P/B (mrq) to be a bit rich.
They recently reported 35.8% Quarterly Revenue Growth Y-o-Y, with 228.6% Quarterly Earnings Growth Y-o-Y.
Their balance sheet will require a more thorough examination, with $81.4M of Total Cash (mrq) & $468.09M of Total Debt (mrq).
WNC stock pays a 1.35% dividend, which appears to be sustainable in the long-run, as their payout ratio is 34.04%.
98.2% of WNC stock’s outstanding share float is owned by institutional investors.
Wabash National Corp. WNC Stock As A Short-Term Trade Using Options
Traders with shorter time horizons can trade options to profit from WNC stock’s price movements, while hedging against broader market volatility.
I am looking at the contracts with the 1/20 expiration.
The $20, $22.50 & $15 call options are all in-the-money, listed from highest to lowest level of open interest.
The $25 & $30 puts are also in-the-money, with the former being more liquid than the latter strike price.
Tying It All Together
WNC stock has many interesting attributes that traders & investors are sure to like.
Traders will like their recent technical performance, and their options are liquid enough for trading.
Long-term investors will like their dividend, as well as their valuation metrics, but may want to look deeper into the makeup of their balance sheet.
All-in-all, it is worth taking a closer look at WNC stock to see how it fits into your portfolio strategy.
*** I DO NOT OWN SHARES NOR OPTION POSITIONS IN WNC STOCK AT THE TIME OF PUBLISHING THIS ARTICLE ***
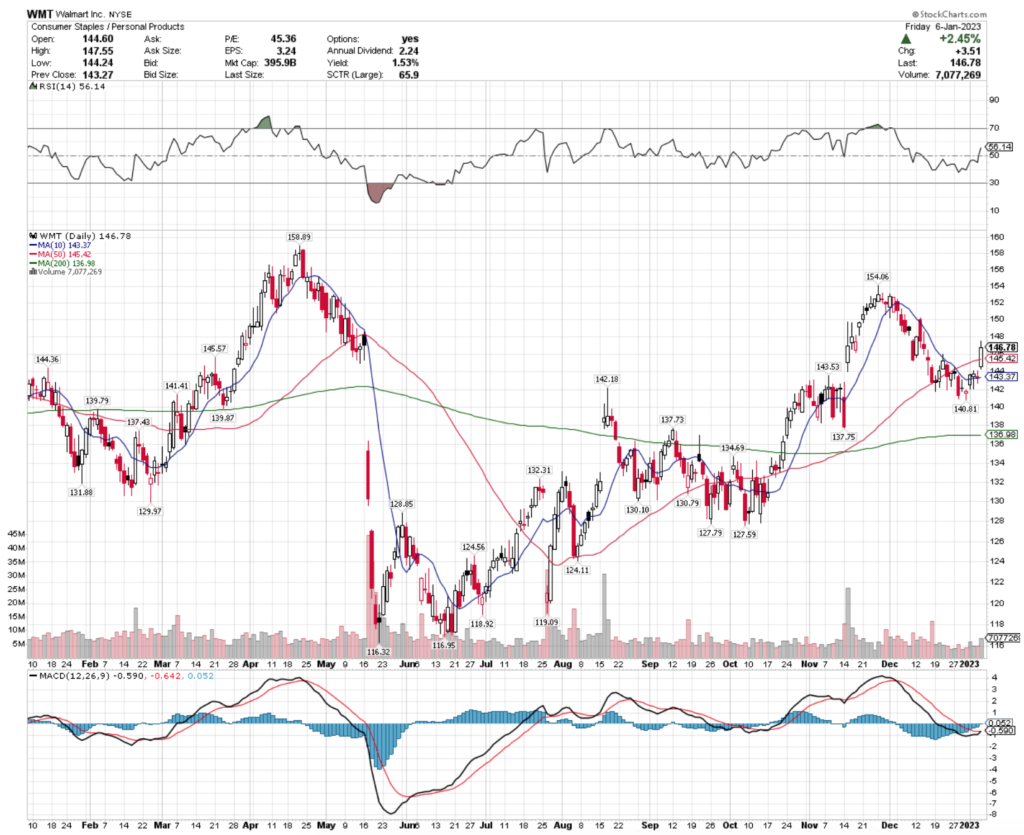
On Friday, WMT stock completed a bullish MACD crossover, gapping up 2.45% on the day.
Their RSI is slightly above neutral & recent trading volumes have been below average compared to the year prior, signaling that there is near-term uncertainty in the market about how to value the name.
WMT stock has support at the $145.57 & $145.42/share price levels, as they attempt to break out above the $154.06 & $158.89/share resistance levels.
Walmart Inc. WMT Stock As A Long-Term Investment
Long-term oriented investors may find WMT stock’s valuation metrics to be a bit rich, with a 45.16 P/E (ttm) & a 5.48 P/B (mrq).
Happy New Year to all of my readers on here; I hope you have an excellent & profitable 2023!
The first week of trading is in the books for the year, with most indexes showing investors’ reluctance to dive right into the markets.
Rather than break down the same issues we’ve been discussing for over a quarter now, let’s dive into some charts.
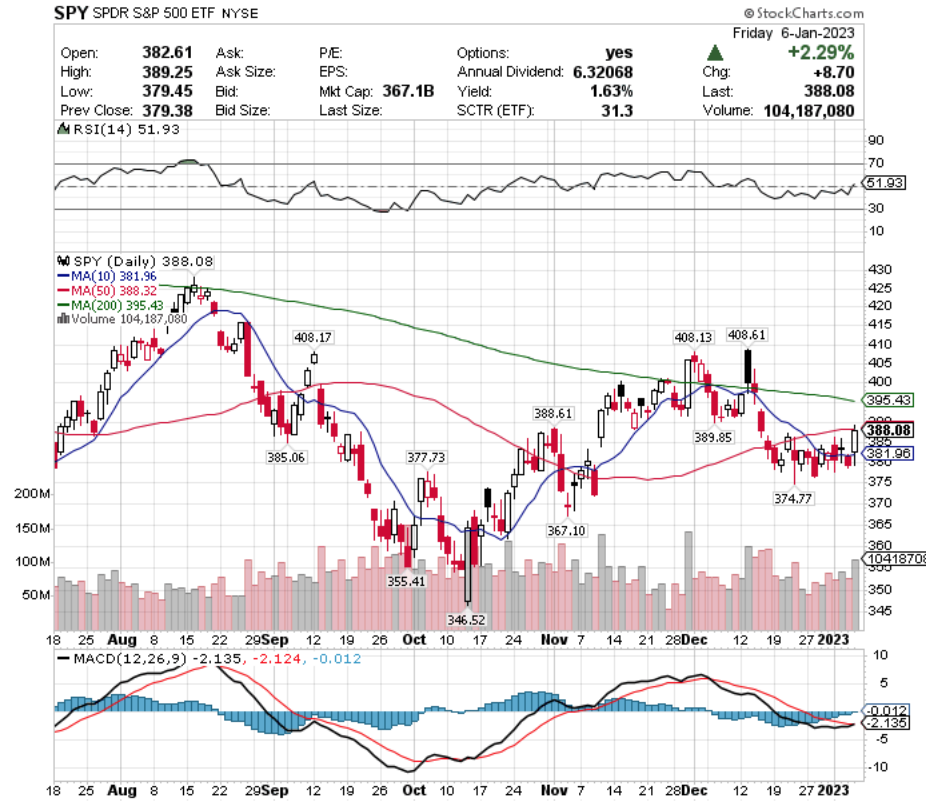
SPY, the SPDR S&P 500 ETF continued to trade in a sideways trend that began in mid-December 2022, with it’s only noticeable gain taking place on this past Friday (+2.29%).
SPY ETF – SPDR S&P 500 ETF (6 Month Chart)
While its MACD appears weakly bullish, their RSI has returned to neutral, which increases the likelihood of a near-term decline.
The next support levels are $385.06, $381.96, $377.73 & $374.77.
Should the last one be crossed bearishly, there will be downward momentum that after ~2% ($367.10) will see the lows of September & October 2022 retested.
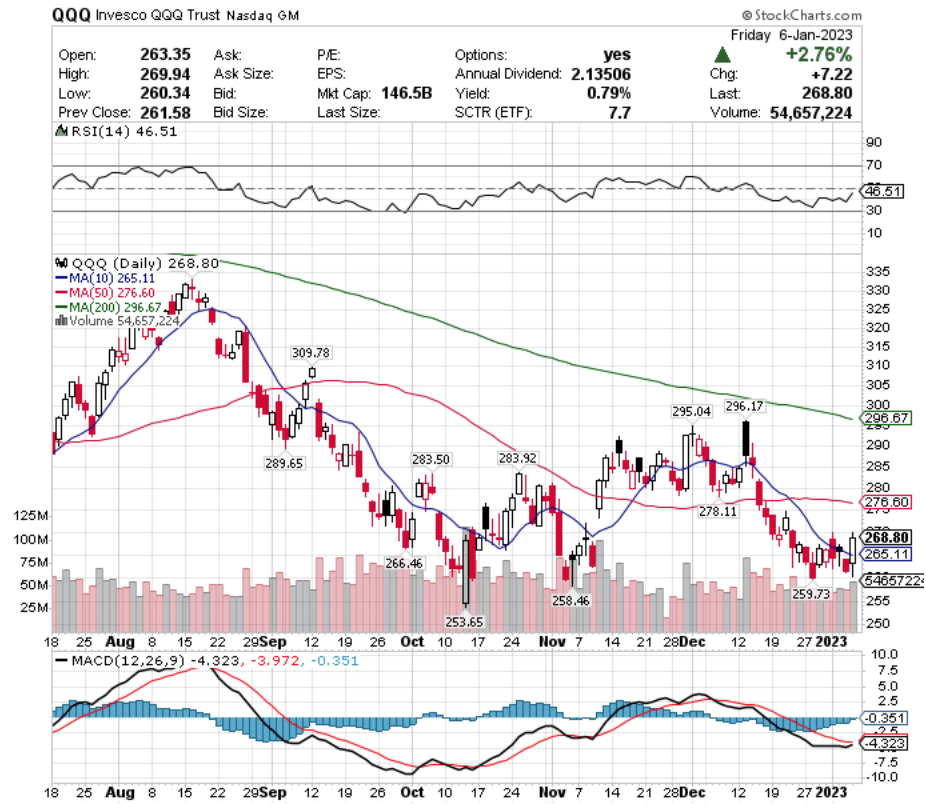
QQQ, the Invesco QQQ Trust ETF that trades with the NASDAQ also was trading sideways to kick off the new year, with the most prominent day of gains taking place on Friday as well (+2.76%).
QQQ ETF – Invesco QQQ Trust ETF (6 Month Chart)
Given the sensitivity of the NASDAQ to interest rates, there looks to be more trouble ahead for NASDAQ names as the Federal Reserve has echoed that they are still not ready to begin pausing hikes, much less easing.
QQQ’s next support levels will be important, as after $266.46 & $265.11 are tested, the next support zone is in the $259.73-258.46 price levels, before their final low support level from October 2022 is to be tested.
Should the $253.65 level be broken, there looks to be a long way to go downwards before finding additional support.
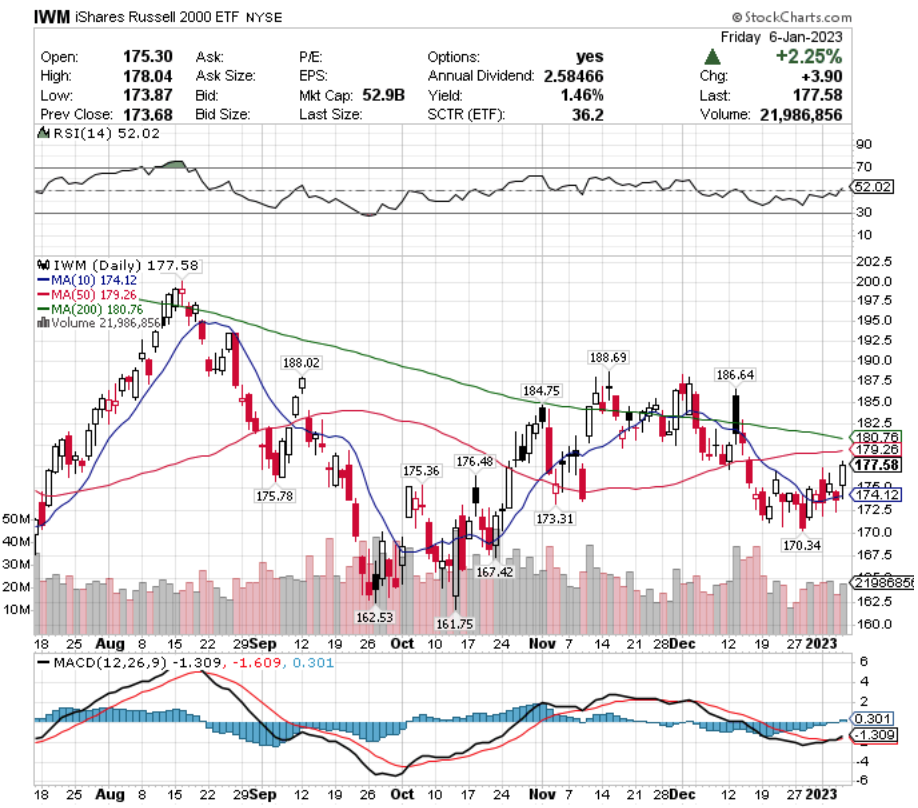
IWM, the ProShares Russell 2000 ETF, which tracks the 2,000 smallest stocks in the Russell 3,000 faired similarly, with the only major upward movement of the week occurring on Friday (+2.25%).
IWM ETF – ProShares Russell 2000 ETF (6 Month Chart)
IWM has a support zone between the $176.48-$174.12 price levels, and more potential touch points on the way down than the former two ETFs.
Given where they currently stand, there is no upwards trend, so this does not look like an appealing time to enter any of the names above.
However, traders who us options as protective hedges have the opportunity to purchase them, collect their dividend yields, while also being able to profit from their additional near-term downward movements.
I will be looking to see how each of these indexes performs in the coming week(s), but the sluggish start to 2023 does not look promising for much growth in the mid-term, unless we see some major macro-headline developments.
Let’s take a closer look at some of the best & worst performing sectors & geo-locations by ETF!
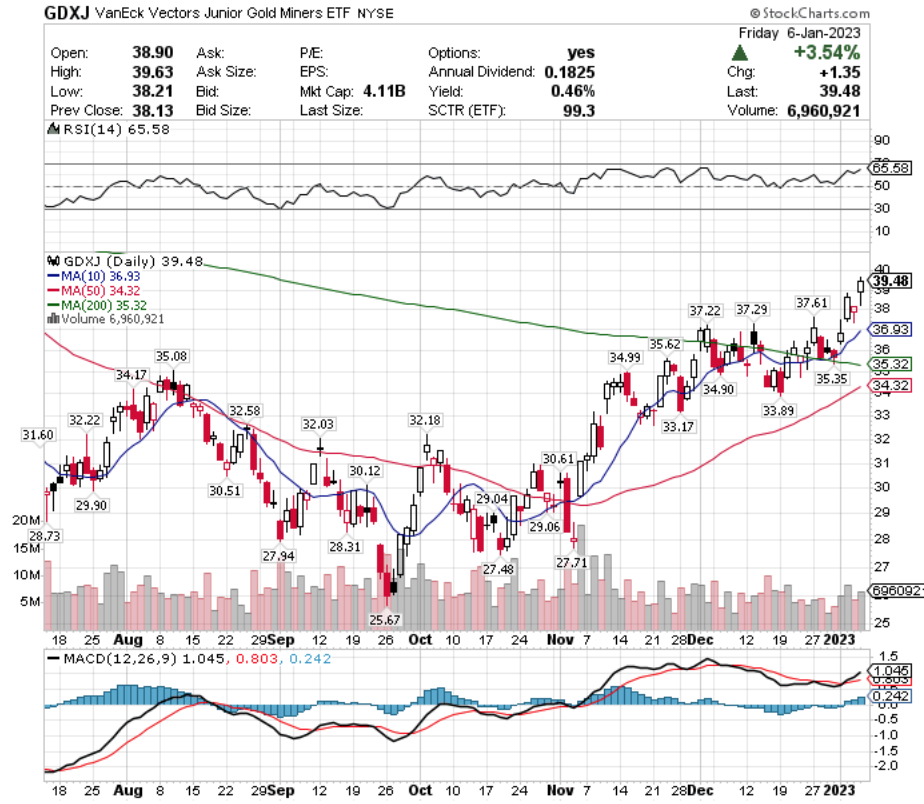
Turkey (TUR), China (PGJ), Aerospace & Defense (DFEN) & Gold Miners (GDXJ) Are All Bullishly Leading The Pack
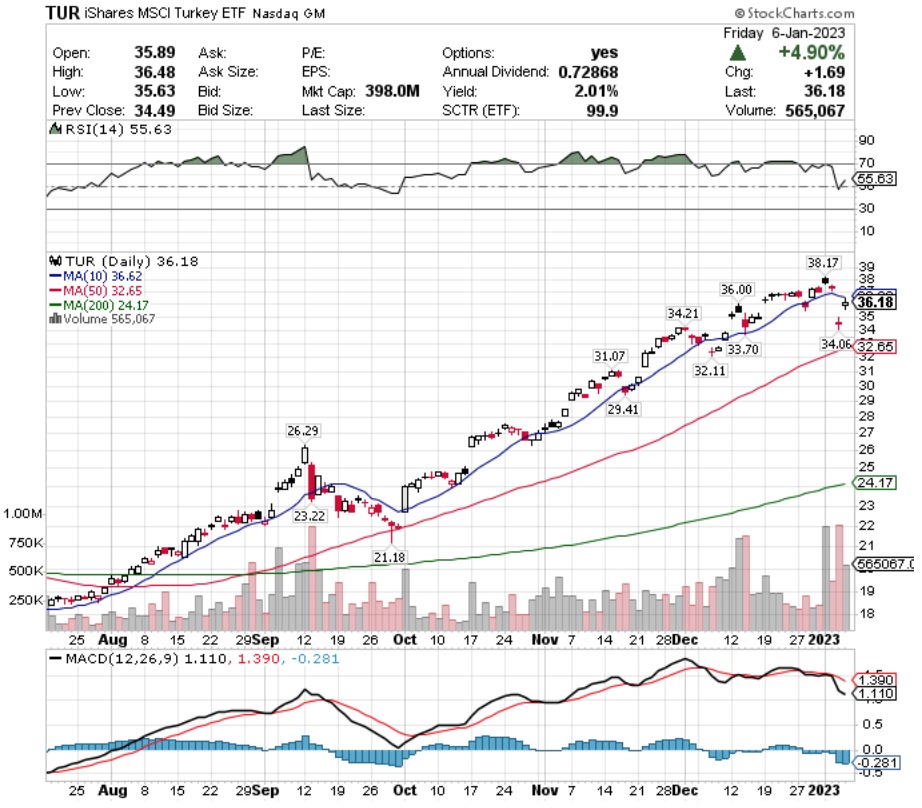
TUR, the iShares MSCI Turkey ETF has shown continued steady growth over the last year, rising 88%+ in that time period (excluding proceeds from their 2.01% dividend).
TUR ETF – iShares MSCI Turkey ETF (6 Month Chart)
Their MACD is bearish & their RSI is bearishly approaching neutral after a long period of growth, signaling that there may be a cool off period on their horizon.
Given the number of gaps shown on their chart (6 months shown above), it looks best to wait & see what direction they end up moving in from here.
Traders looking to capitalize on their downside movements can buy in-the-money puts or sell out-of-the-money calls for additional income while they establish a price range.
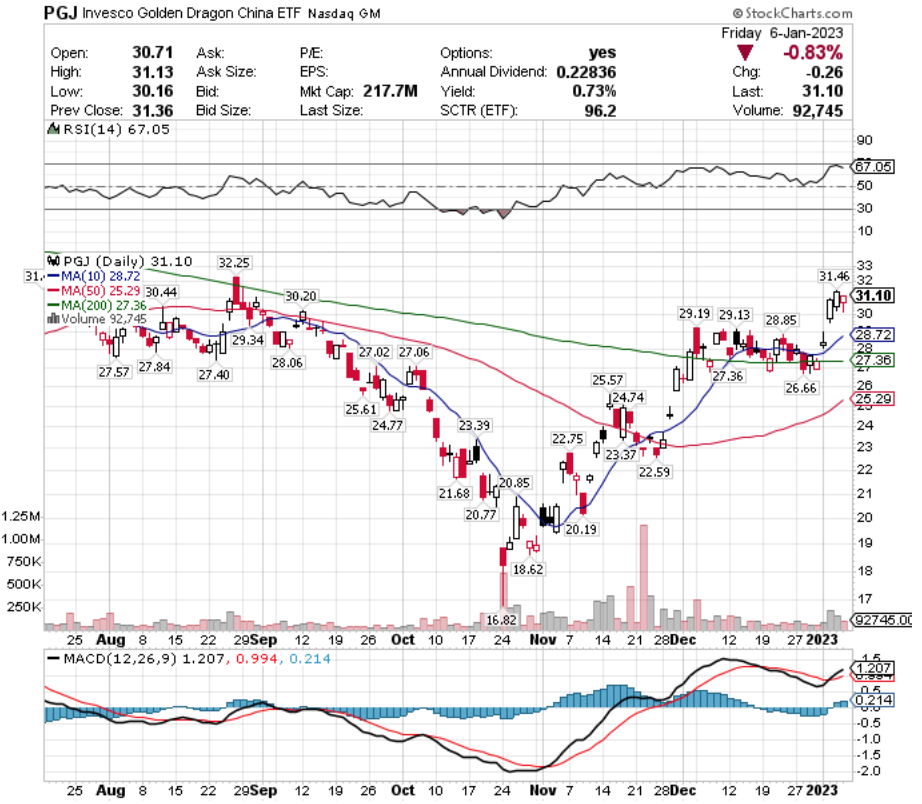
PGJ, the Invesco Golden Dragon ETF has also performed well this year, rising ~85% since their low of late-October (excluding their 0.73% dividend).
PGJ ETF – Invesco Golden Dragon ETF (6 Month Chart)
Much like TUR, they too have begun sputtering near their 52 week high & look ready to go test some of their support levels.
Investors may think to wait & see how they interact with their lower $29 support zone before entering a position ($29.34-29.13), as should they bearishly break through there, the $28 support levels are awfully spread out.
PGJ does have options, which savvy traders can use to their advantage while they wait to see which direction they move in later into the month.
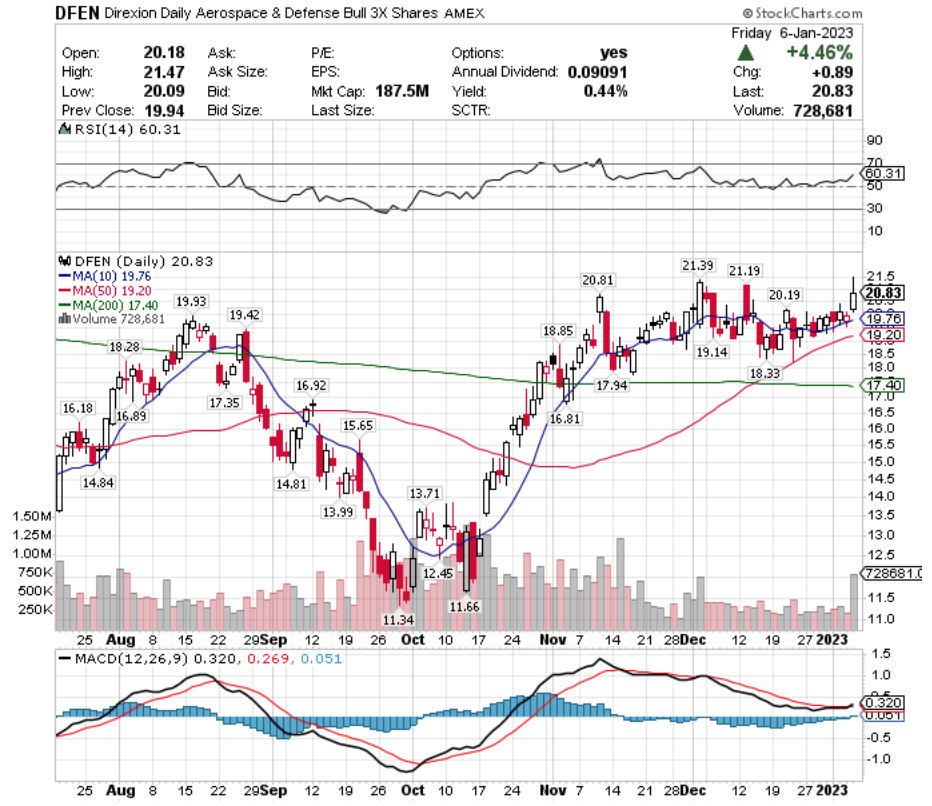
This name will require more attention to headlines, as there are bearish overall market catalysts that can be bullish for defense stocks.
Their $21.19 & $21.39 resistance levels are in focus in the coming weeks, while they have support at the $20.81 & $20.19 price levels.
As with most of the other names on today’s list, DFEN stock has options that can be used to profit from their performance while the market establishes where they are currently valued.
GDXJ, the VanEck Vectors Junior Gold Miners ETF has also had a year that was relatively flat (+1.49%), despite posting a ~54% gain from their lows established in October of 2022 (excluding gains from their 0.46% dividend).
For the upside, look at the $41.02-41.40 price range, where resistance will have had to fill a gap up before reaching, and on the downside they have support at $38.27 & $37.29.
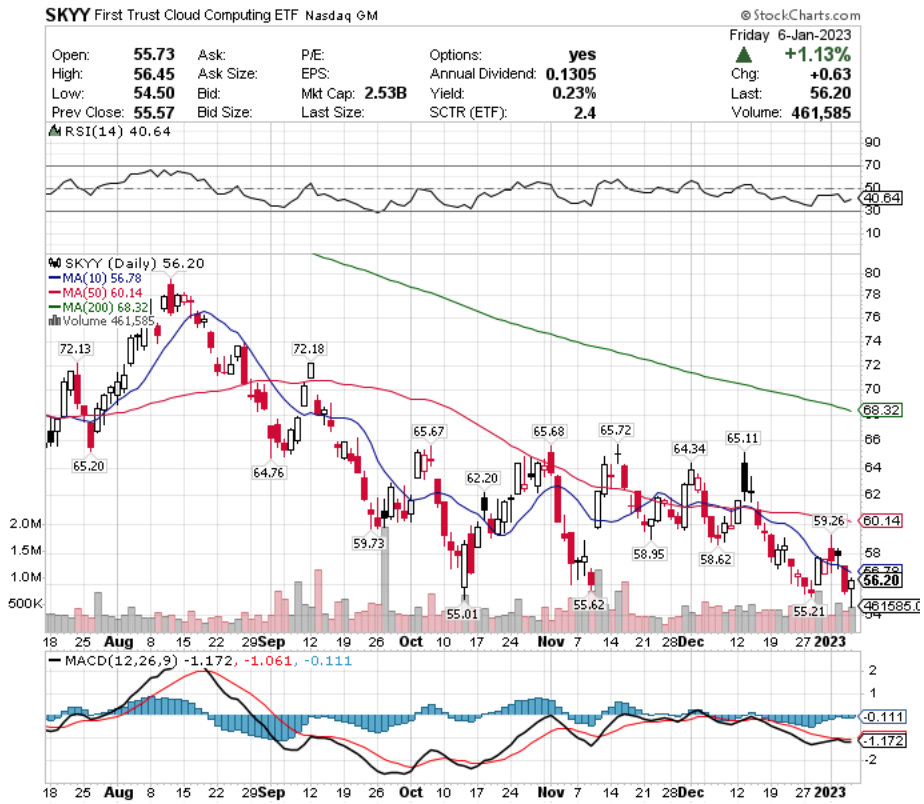
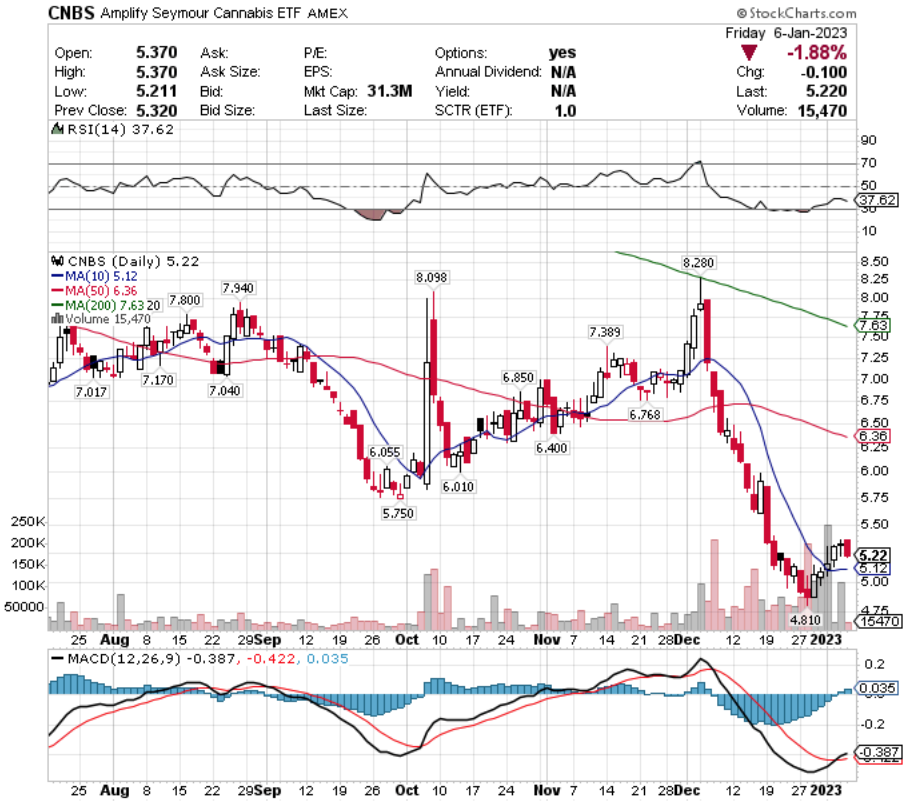
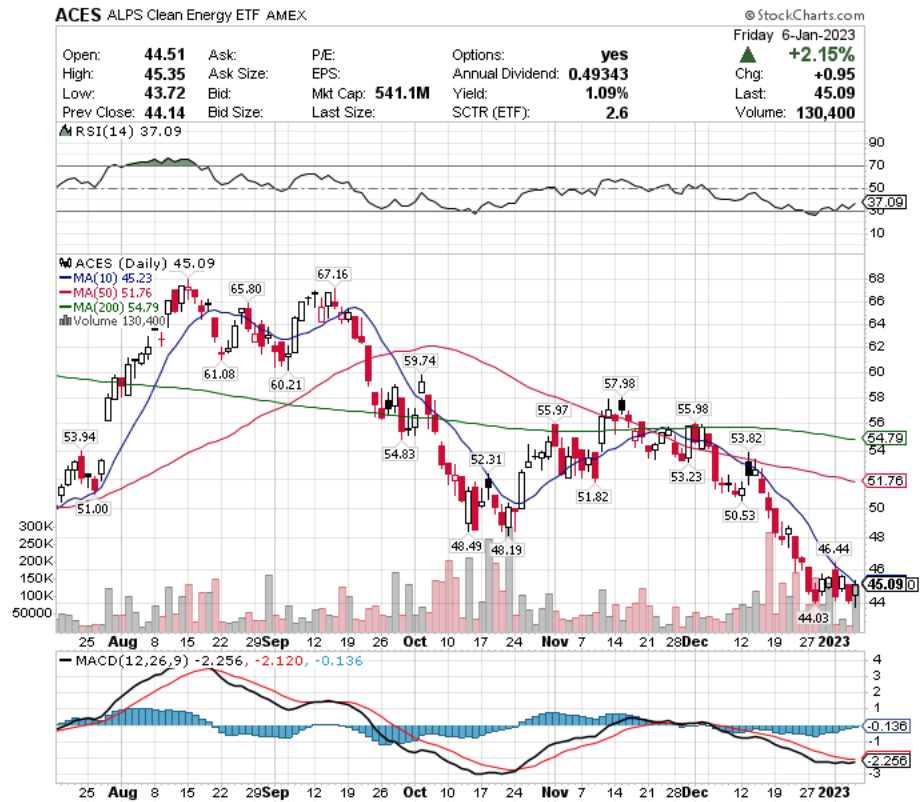
Cloud Computing (SKYY), Cannabis (CNBS), ARKK Innovation (ARKK) & Clean Energy (ACES) Are All Bearishly Lagging The Pack
Their RSI is approaching oversold & they have only 2 support points ($5.12 & $4.81) from their current price level, with no dividend to offer investors a cushion.
CNBS will need additional time before being deemed at an ok level to invest in the long-term, but they do have options for traders looking to profit while they establish a new price level.
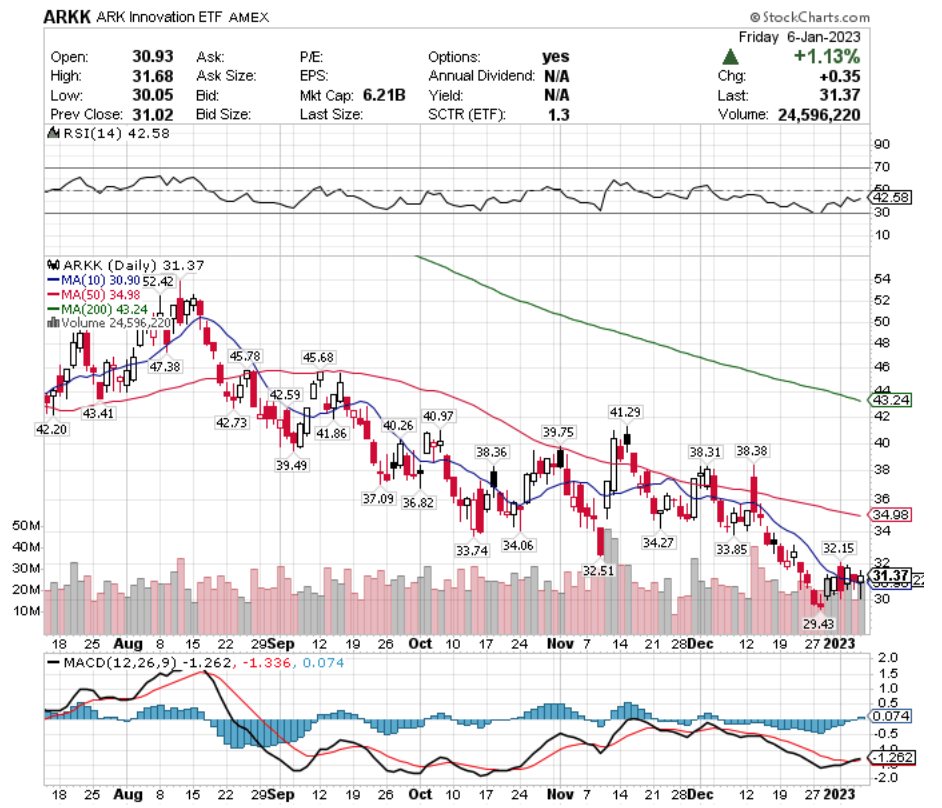
ARKK, the ARK Innovation ETF has also had a dismal year, losing 63% of its total value since the beginning of 2022.
ARKK ETF – ARK Innovation ETF (6 Month Chart)
While those losses are to be expected based on the basket of names that the ETF contains, they do not offer a dividend, meaning that investors who purchased shares are in a tough place.
Their RSI is 42 & they have only 2 support levels beneath them currently ($30.90 & $29.43), signaling that there is likely more downward pain to come in the near-term.
While this isn’t a time to initiate a position just yet, there are opportunities for options traders to profit from them establishing a new price range.
Much like the other bearish members of this article they have limited support levels left ($44.03) & they also have the most oversold RSI (37.09).
This does not appear to be a safe entry spot for creating a position, however options traders can profit from trading around them as they try to establish a new price range.
Tying It All Together
2022 was a volatile year for stocks & ETFs, with 2023 looking to start off on the same foot.
As investors search for safe places to put money in a rising rates environment opportunities have opened up in emerging markets, metals & energy, as well as defense names.
Names that are more speculative in nature, such as cannabis companies that are subject to more regulation uncertainty & technology companies that are heavily reliant on debt are feeling the pain of the past year’s interest rate hikes, along with the uncertainty of how far into 2023 the Fed will go before pausing increases.
Earnings calls this week should give some signal into where the economy is heading in the first half of the year, with many of the large US banks reporting on Friday 1/13/23.
There are also a number of Federal Reserve speakers set to speak throughout the week, which should also provide some clarity into the direction of where the markets are likely to head in 2023.
We will also learn more about NY Fed 1 & 5 year inflation expectations, consumer credit, the NFIB small-business index, revised wholesale inventories & CPI numbers this week.
Once we have more information from these reports & meetings there will be more information to begin combing through to figure out how price trends will behave in the coming year.
Best of luck in 2023!
*** I DO NOT OWN SHARES OF SPY, QQQ, IWM, TUR, PGJ, DFEN, GDXJ, SKYY, CNBS, ARKK, or ACES AT THE TIME OF PUBLISHING THIS ARTICLE ***
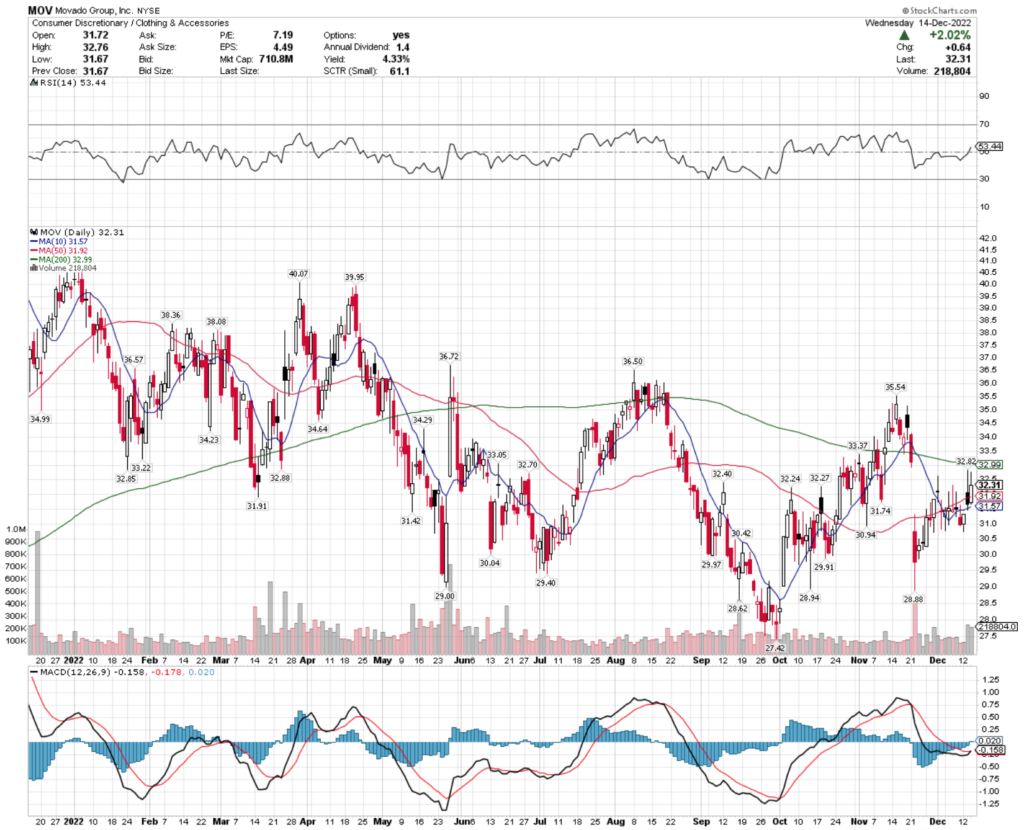
Yesterday, MOV stock completed a bullish MACD crossover, closing +2.02%.
Recent trading volume has been about average compared to the year prior & their RSI is neutral, signaling that they may have more momentum in the near-term.
MOV stock has support at the $32.27 & $32.24/share price levels, as they try to break above the $32.40 & $32.70/share resistance levels.
Movado Group, Inc. MOV Stock As A Long-Term Investment
Long-term oriented investors will like MOV stock’s valuation metrics, with a 7.26 P/E (ttm), along with their 1.5 P/B (mrq).
They recently reported -2.9% Quarterly Revenue Growth Y-o-Y, with -6.7% Quarterly Earnings Growth Y-o-Y.
Their balance sheet also looks appealing, with a reported $187.08M of Total Cash (mrq) & $81.94M of Total Debt (mrq).
MOV stock pays a 4.1% dividend, which appears to be sustainable in the long run, as their payout ratio is 29.21%.
97.8% of MOV stock’s outstanding share float is owned by institutional investors.
Movado Group, Inc. MOV Stock As A Short-Term Trade Using Options
Short-term focused traders can trade options to profit from MOV stock’s price movements, while protecting their portfolios from broader market volatility.
I am looking at the contracts with the 12/16 expiration date, as the 1/20/23 date does not have as much open interest yet, which will change after this week’s expiration.
The $30, $25 & $22.50 call options are all in-the-money, listed from most to least liquid strike.
The $35, $40 & $50 puts are also all in-the-money, with the former having more open interest than the latter.
Tying It All Together
MOV stock has many interesting characteristics that traders & investors are sure to find appealing.
Investors will like their dividend, valuation metrics & balance sheet, but may want to look closer at their recent growth metrics before investing.
Traders will like their recent technical performance, but may be disappointed by how illiquid their options are.
All-in-all, it is worth taking a closer look into MOV stock to see how it fits into your portfolio strategy.
*** I DO NOT OWN SHARES OF MOV STOCK AT THE TIME OF PUBLISHING THIS ARTICLE ***