Clarus Corp. stock trades under the ticker CLAR & has shown recent bullish signals that traders & investors should research further into.
CLAR stock closed at $7.77/share on 11/28/2022.
Clarus Corp. CLAR Stock’s Technical Performance Broken Down
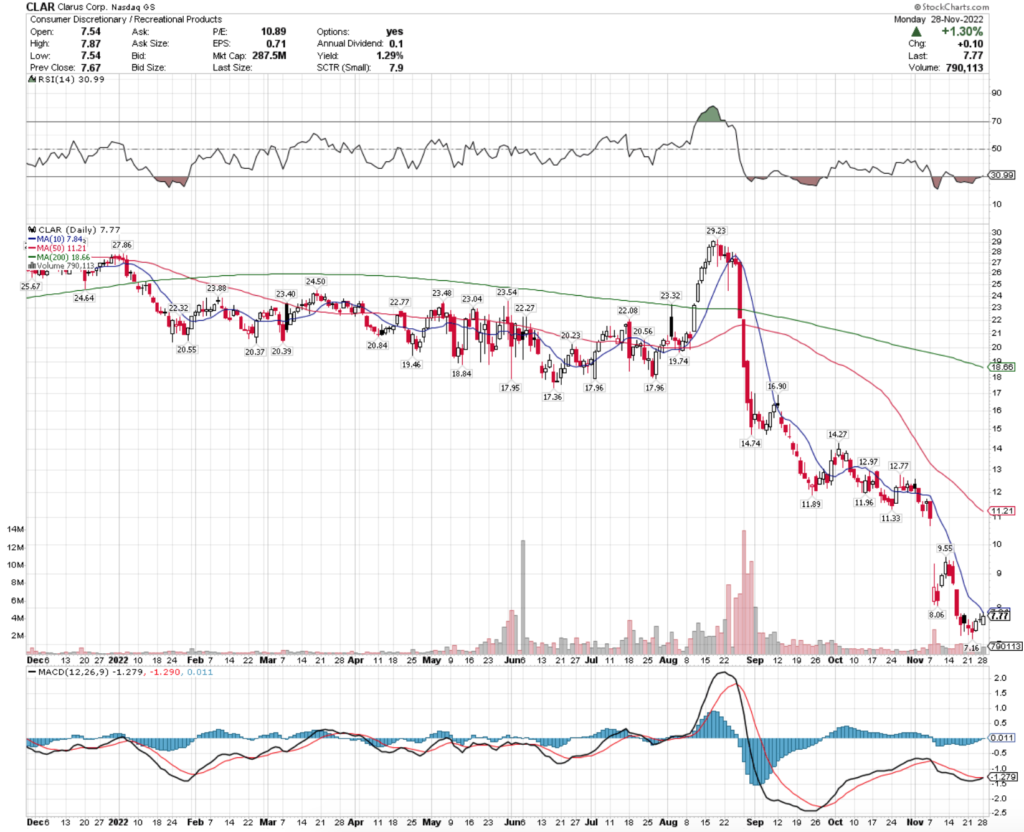
CLAR Stock Price: $7.77
10 Day Moving Average: $7.84
50 Day Moving Average: $11.21
200 Day Moving Average: $18.66
RSI: 30.99
MACD: -1.279
Yesterday, CLAR stock completed a bullish MACD crossover, gaining 1.3% on the day.
Recent volumes have been about average compared to the year prior, and their RSI is oversold, signaling that there may be more momentum to come, barring a larger selloff.
CLAR stock has support at the $7.16/share price level, as they look to break out above the $8.06 & $9.55/share resistance levels.
Clarus Corp. CLAR Stock As A Long-Term Investment
Long-term oriented investors will like CLAR stock’s valuation metrics, with a 11.28 P/E (ttm) & a 0.78 P/B (mrq).
They recently reported 6.2% Quarterly Revenue Growth Y-o-Y, with -39.3% Quarterly Earnings Growth Y-o-Y, which prospective investors will want to review before buying.
Their balance sheet will also require a more thorough examination, with $10.37M of Total Cash (mrq) & $182.92M of Total Debt (mrq).
CLAR stock pays a 1.3% dividend, which appears stable in the long-run as their payout ratio is 14.71%.
89% of CLAR stock’s outstanding share float is owned by institutional investors.
Clarus Corp. CLAR Stock As A Short-Term Trade Using Options
Short-term focused traders can trade options to profit from price movements in CLAR stock, while hedging their portfolio against broader market volatility.
I am looking at the contracts with the 12/16 expiration date.
The $7.50 call options are in-the-money, with the $8 & $8.50 out of the money calls also being liquid.
The $10, $8, $9 & $9.50 puts are also all in-the-money, listed from highest to lowest level of open interest.
Tying It All Together
CLAR stock has many interesting characteristics that traders & investors should research further into.
Investors will like their dividend yield, as well as their valuation metrics, but may want to look closer into the markup of their balance sheet.
Traders will like their recent technical performance, but may be disappointed by how illiquid their options are.
Overall, it is worth taking a closer look into CLAR stock to see how it fits into your portfolio strategy.
*** I DO NOT OWN SHARES OF CLAR STOCK AT THE TIME OF PUBLISHING THIS ARTICLE ***