Capital Product Partners L.P. stock trades under the ticker CPLP & has shown recent bullishness that traders & investors may want to take a closer look into during this volatile time.
CPLP is trading at $15.57/share at the time of writing this on 3/9/2022.
Capital Product Partners L.P. CPLP Stock’s Technicals Broken Down
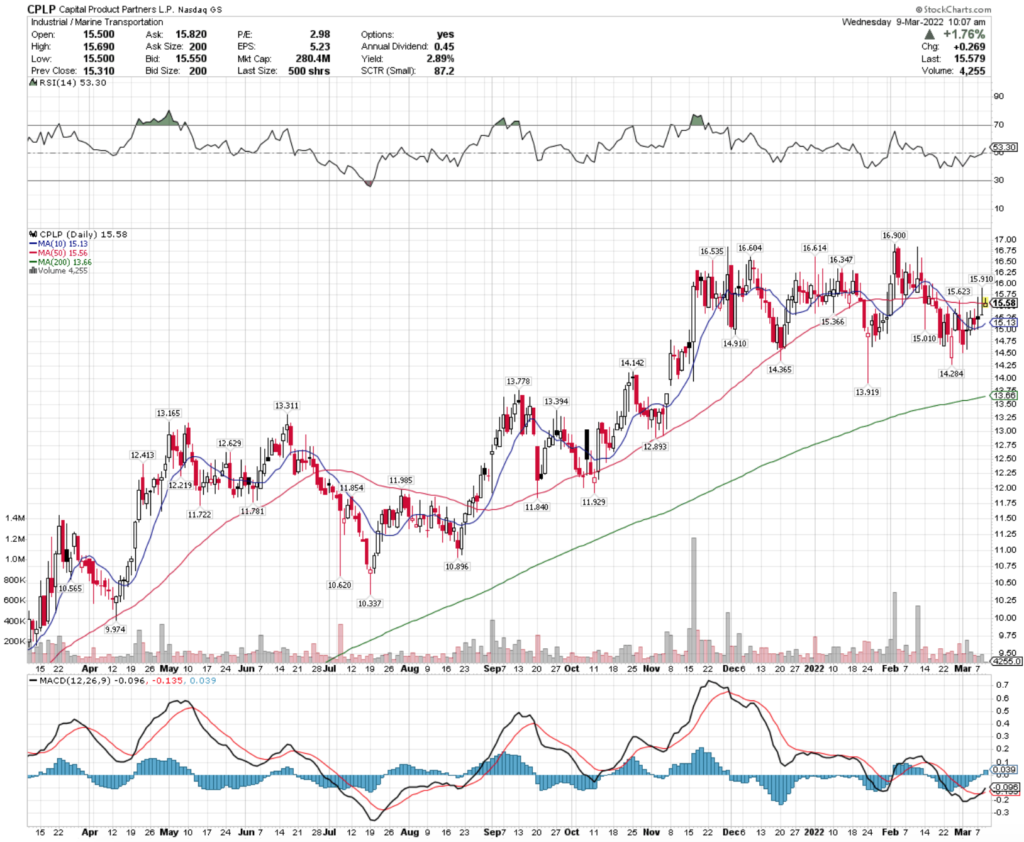
CPLP Stock Price: $15.57
10 Day Moving Average: $15.13
50 Day Moving Average: $15.56
200 Day Moving Average: $13.66
RSI: 53.6
MACD: -0.137
Yesterday, CPLP stock completed a bullish MACD crossover, and today has broken out bullishly above its 50 Day Moving Average.
With 3% between their 10 & 50 Day Moving Averages, there looks to be more bullish momentum behind their price movement in the coming days.
CPLP’s RSI is also neutral, which signals that there is more room to climb in the near-term, and their recent trading volumes have been relatively average when compared to the year prior.
They will have to test the $15.72 level before the $15.97/share resistance level in the coming days.
Capital Product Partners L.P. CPLP Stock As A Long-Term Investment
Long-term oriented investors will find CPLP’s valuation metrics appealing, with a P/E (ttm) of 2.99 & a P/B (mrq) of 0.57.
CPLP stock has 81% Quarterly Revenue Growth Y-o-Y, with 450.9% Quarterly Earnings Growth Y-o-Y based on their last earnings report.
Their balance sheet is concerning though, with Total Cash (mrq) of $20.37M & Total Debt (mrq) of $1.31B, and their most recently withdrawn credit ratings from Moody’s were Highly Speculative, although improving.
CPLP stock pays a 2.94% dividend, which looks very safe given their 7.8% payout ratio.
Despite their yield, only 21.9% of their outstanding share float is held by institutional investors, likely because of their debt situation noted above.
Capital Product Partners L.P. CPLP Stock As A Short-Term Trade Using Options
Short-term oriented traders can trade options to take advantage of CPLP stock’s current momentum, while fending off broader market volatility.
I am looking at the contracts with the 3/18 expiration date.
The $12.50 & $15 calls look appealing, although both have open interest <1,000 contracts, which some traders may consider too illiquid.
The $17.50 & $20 puts also look interesting, but are even less liquid than the calls, signaling market sentiment is bullish on CPLP in the near-term.
Tying It All Together
Overall, CPLP stock has many interesting characteristics that traders & investors will like.
Investors will like their dividend yield & valuation metrics, but must be cautious about their debt situation.
Traders will like their momentum in the near-term, but may dislike how illiquid their options are.
CPLP stock is worth taking a closer look into, regardless of your trading style.
*** I DO NOT OWN SHARES OF CPLP ***