Synaptics Inc. stock trades under the ticker SYNA & is a member of the computer hardware industry.
SYNA stock closed at $177.74/share on 10/22/2021, after showing recent bullishness that traders & investors should take a closer look at.
Breaking Down Synaptics Inc. SYNA Stock’s Technical Performance
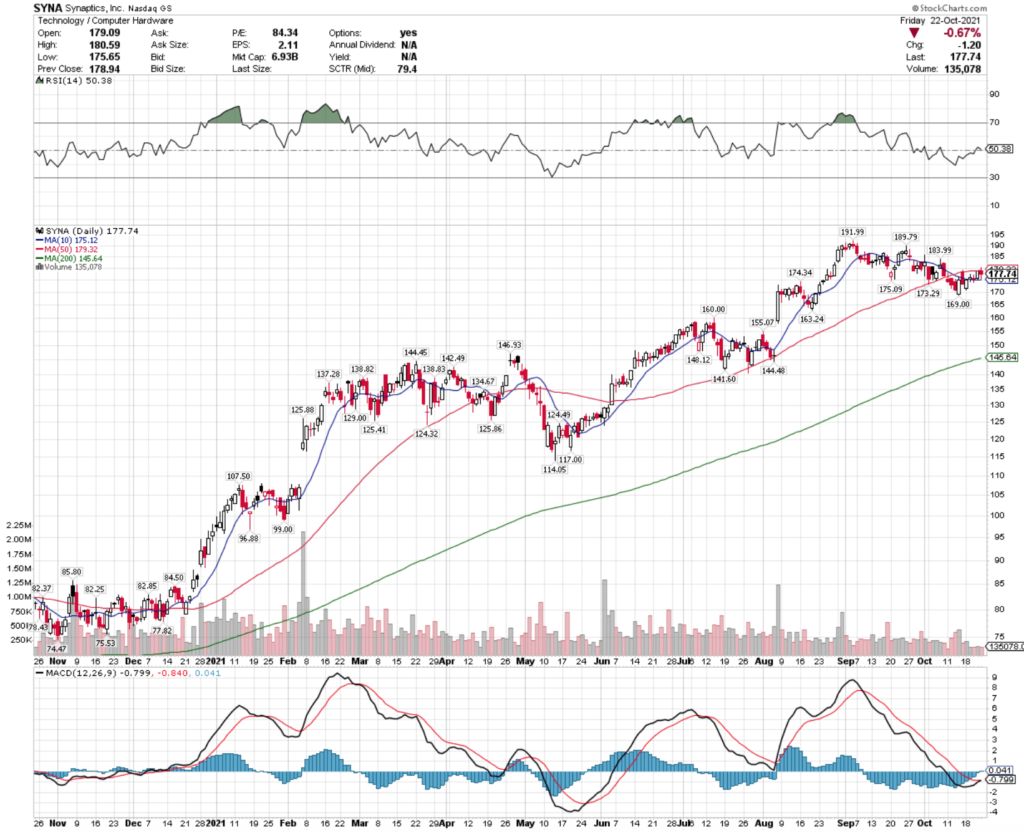
SYNA Stock Price: $177.74
10 Day Moving-Average: $175.12
50 Day Moving-Average: $179.32
200 Day Moving-Average: $145.64
RSI: 50
MACD: -0.799
On Friday, SYNA stock completed a bullish MACD crossover, with a neutral RSI, signaling that there is more bullish momentum to come.
With the share price ~1% lower than the 50 Day MA, & the 10 Day MA ~1% lower than the share price, there looks to be added momentum in the week to come for SYNA.
SYNA has traded on lighter than average volume the last month, when compared to the rest of the past year.
Their next test looks to be at the $181.66 level, followed by the $187 price level as they continue to climb.
Synaptics Inc. SYNA Stock As A Long-Term Investment
Long-term focused investors may find SYNA stock to be an appealing investment for their portfolios.
SYNA has a P/E (ttm) of 85.5 & a P/B of 7.2, which is not terribly high for a tech company’s valuation metrics.
They had 18.1% Quarterly Revenue Growth Y-o-Y, and 95% % Institutional Shareholders.
SYNA’s balance sheet has Total Cash (mrq) of $836.3M, with Total Debt (mrq) of $914.8M.
SYNA stock does not offer a dividend yield to their investors.
Synaptics Inc. SYNA Stock As A Short-Term Trade Using Options
Short-term focused traders may want to use options to take advantage of SYNA’s current bullish momentum, while fighting off broader market volatility.
I am looking at the 11/19 expiration dated contracts.
The $175 & $180 calls look appealing, as they should continue to gain open interest & become more liquid in the coming days to weeks.
There is limited open interest on the puts side, signaling that the broader sentiment around SYNA is bullish.
However, the $180 & $190 puts would be of interest once they become more liquid.
Tying It All Together
Overall, there look to be a lot of advantages in Synaptics Inc.’s stock for traders & investors alike.
Investors will like their revenue growth, along with their balance sheet.
Traders will like their current momentum & set up for near-term bullish momentum.
All-in-all SYNA stock is worth taking a closer look at, no matter your trading style.
*** I DO NOT OWN SHARES OF SYNA STOCK ***