Big Lots, Inc. stock trades under the ticker BIG & may present investors & traders with an opportunity to earn profits amid volatile market conditions.
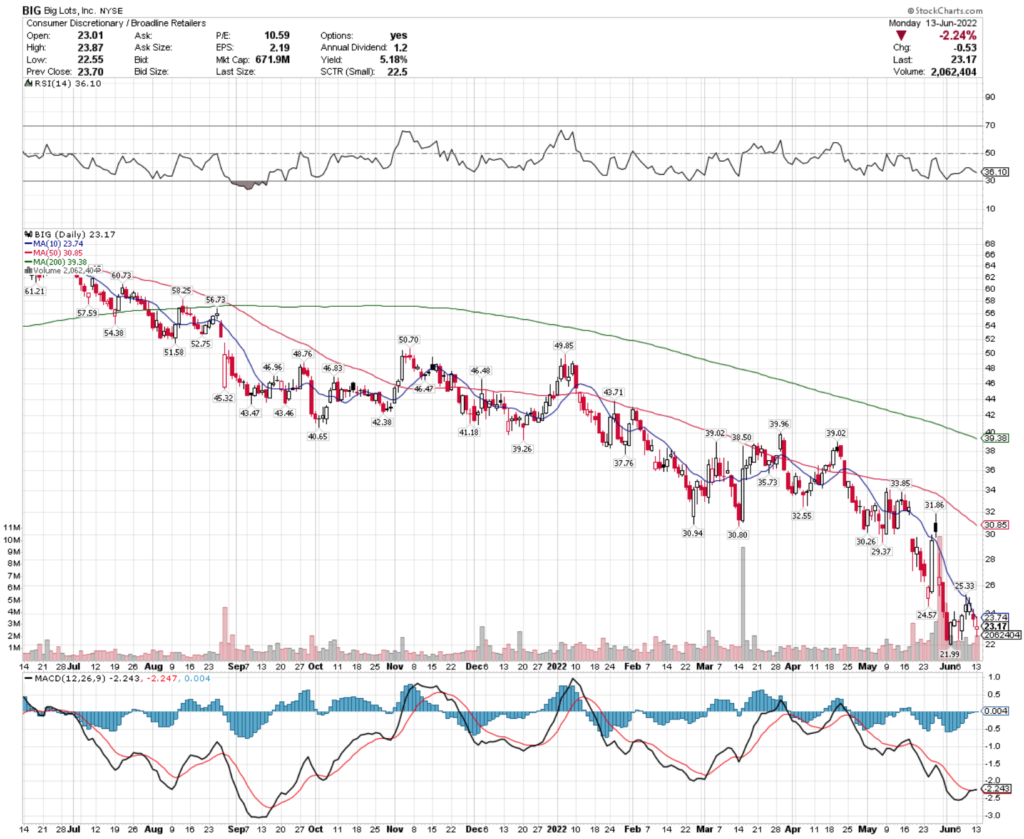
BIG stock closed at $23.17/share on 6/13/2022.
Big Lots, Inc. BIG Stock’s Technical Performance Broken Down
BIG Stock Price: $23.17
10 Day Moving Average: $23.74
50 Day Moving Average: $30.85
200 Day Moving Average: $39.38
RSI: 36.1
MACD: -2.243
Yesterday, BIG stock completed a bullish MACD crossover, despite dropping 2.24% for the day’s session.
The markets as a whole are trending down, as is BIG stock, as shown by their RSI approaching oversold territory.
After being on a decline for the last year, BIG stock needs to stay above its $21.99 support level, otherwise it will continue downward, which makes profitable opportunities for traders using put options.
Big Lots, Inc. BIG Stock As A Long-Term Investment
Long-term oriented investors will like BIG stock’s valuation metrics, with a 5.44 P/E (ttm) & a 0.82 P/B (mrq).
They recently reported -15.4% Quarterly Revenue Growth Y-o-Y, which is disappointing from an investor’s standpoint.
Their balance sheet will require a closer examination before investing, with $61.7M of Total Cash (mrq) & $2.08B of Total Debt (mrq).
BIG stock pays a 5.06% dividend yield, which appears stable in the long-run, as their payout ratio is 51.72%.
80% of BIG stock’s outstanding share float is owned by institutional investors.
Big Lots, Inc. BIG Stock As A Short-Term Trade Using Options
Short-term oriented traders can use options to profit from BIG stock’s price movements, while protecting their returns from volatility.
I am looking at the contracts with the 6/17 expiration date.
The $22.50, $15 & $20 call options are all in-the-money, with the former being the most liquid & the latter being the least.
The $32.50, $30 & $27.50 puts are also in-the-money, with the former being the least liquid & the latter being the most.
Using puts can be valuable in this instance, as while BIG tries to stay above its $21.99 support level traders can collect profits from puts, roll their profits into long-shares, and collect 5% interest on them if they hold for a year or longer.
Tying It All Together
BIG stock has been declining just like the broader market indexes over the last year, which may present an opportunity for profits by traders & investors alike.
Investors will like their dividend yield & valuation metrics, but will want to check in on their balance sheet before making an investment to see how interest rate hikes will impact BIG stock.
Traders will be able to profit from their options, which are relatively liquid across in-the-money strikes.
Overall, it is worth taking a closer look to see how BIG stock can fit into your portfolio strategy.
*** I DO NOT OWN SHARES OF BIG STOCK AT THE TIME OF PUBLISHING THIS ARTICLE ***
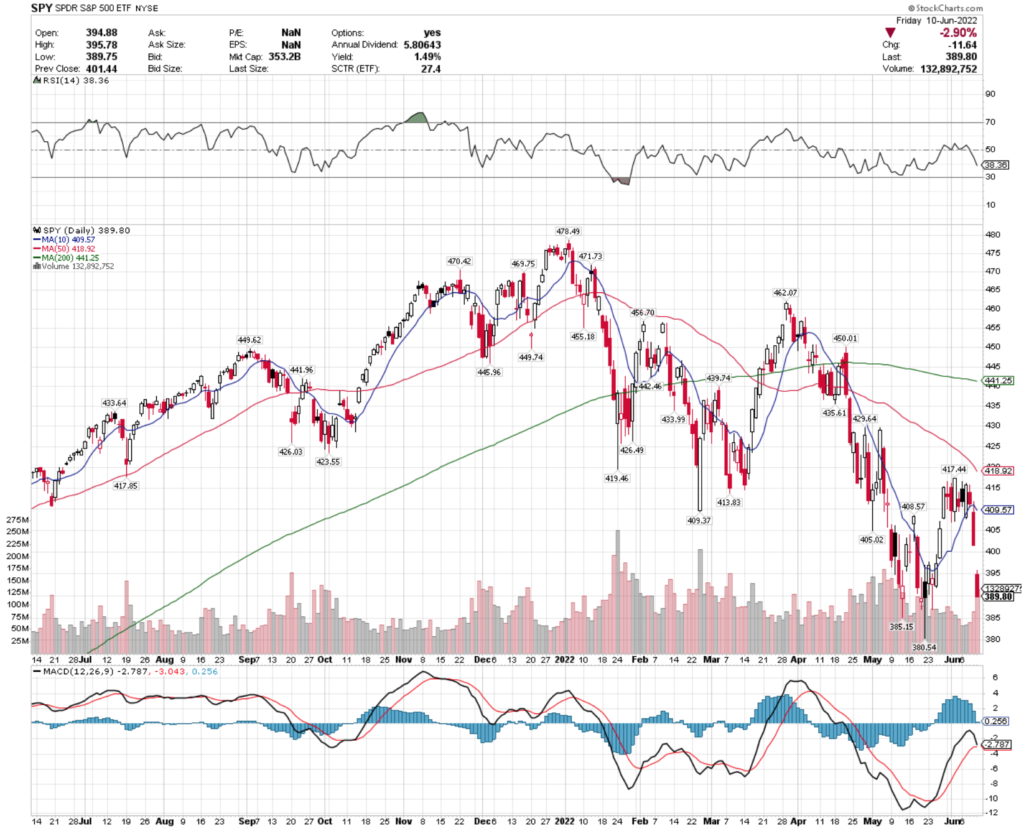
This past week was unsurprisingly volatile in the markets, with both the S&P 500 & the NASDAQ indexes gapping down on Friday after the CPI disappointment.
Jobless claims also did not help the picture, with a disappointing report, and consumer credit also increased again.
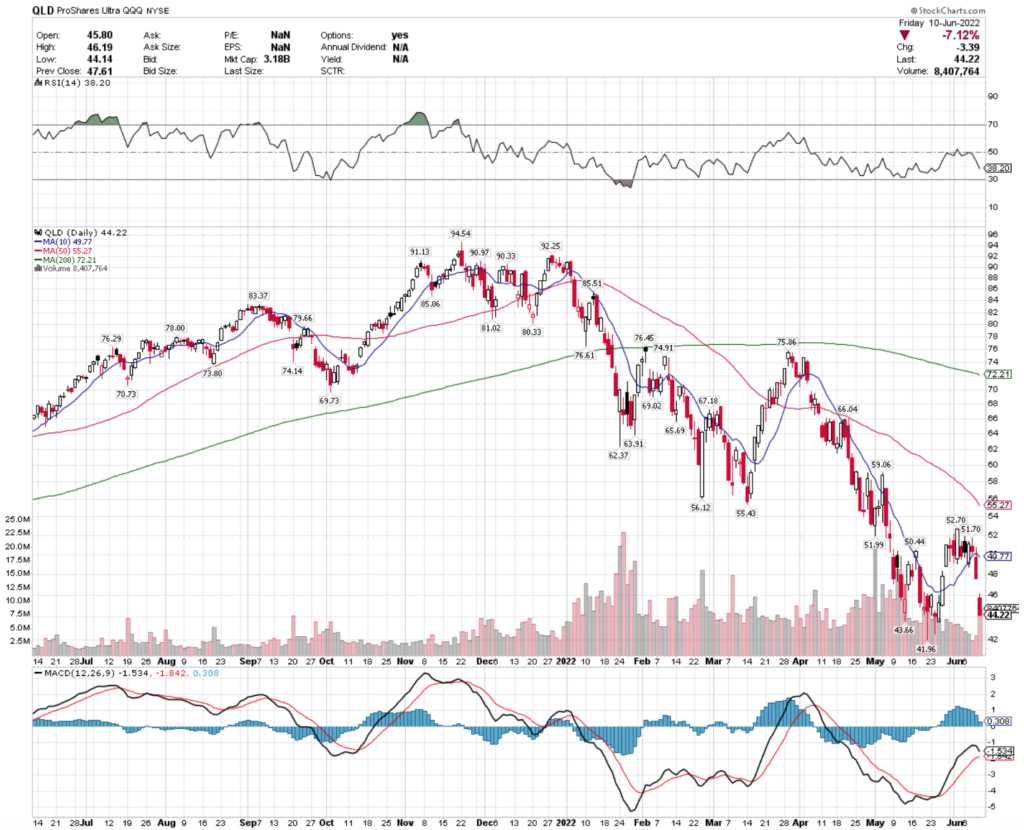
QLD, the ProShares Ultra QQQ ETF dropped 7.12% on Friday (2x levered), as fears about inflation, interest rates & the state of the US consumer & employee made investors seek less risk.
QLD ETF – ProShares Ultra QQQ ETF
Their trading volume is still below average for 2022, although on Friday they received more trading attention than they had for the last few weeks.
The $43.66 price-level will have to try & hold up, else they will fall down to test $41.96.
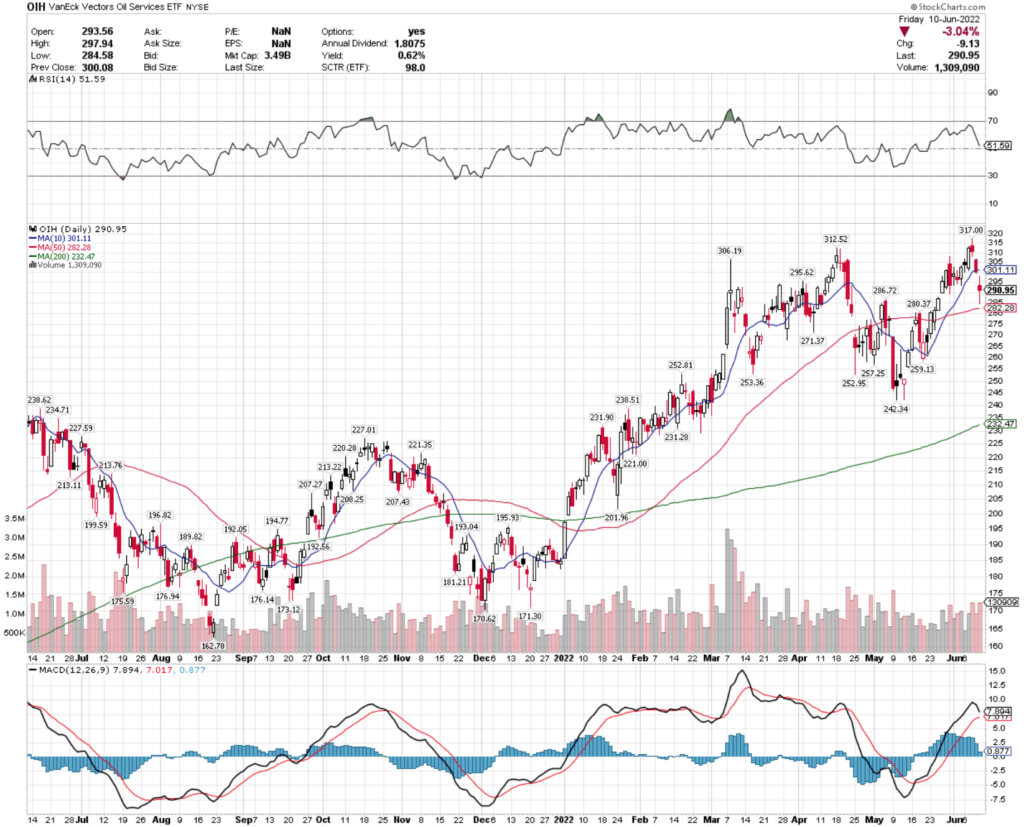
With an MACD that looks about to bearishly cross & a neutral RSI, there looks to be more losses in store for OIH in the near-term.
Traders can capitalize on this by using their options, where profit from puts can be put to use to buy more shares as the price falls lower, and the investor collects a dividend.
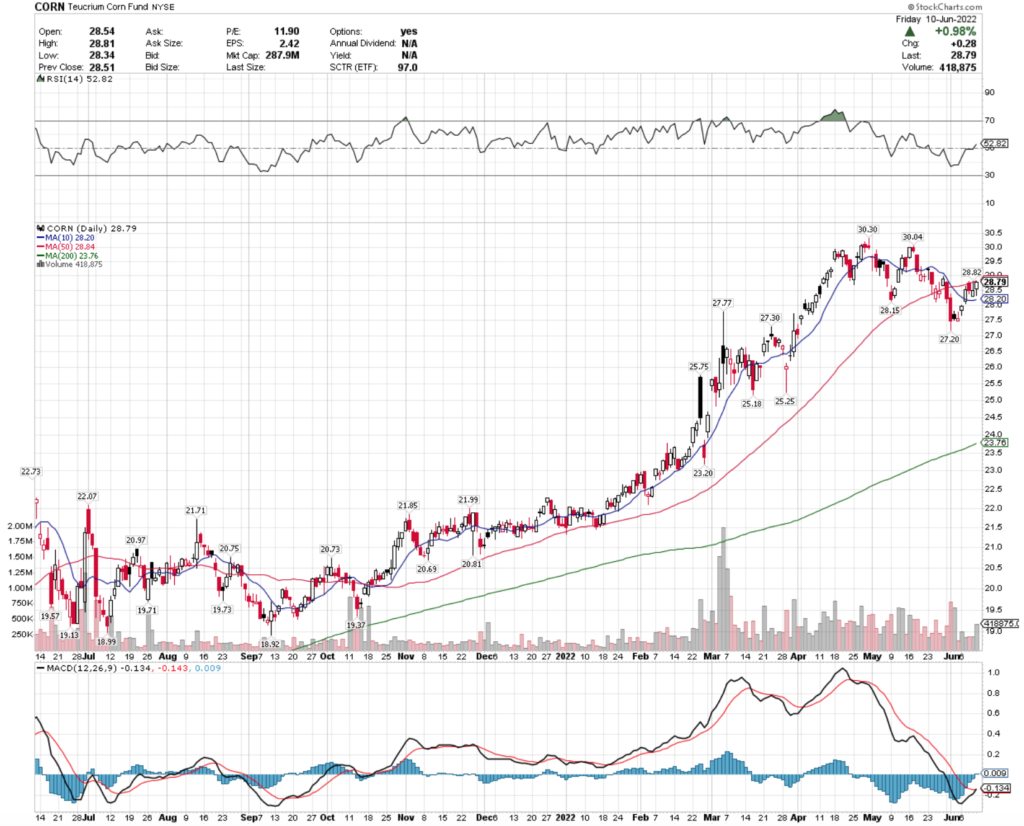
CORN, the Teucrium Corn Fund ETF has also been climbing steadily since October 2021, as fears about food shortages & supply chains have continued.
CORN ETF – Teucrium Corn Fund ETF
CORN’s MACD is bullishly crossing, signaling that there may be momentum in the coming days, and their RSI is neutral.
They will need to break above their 50 day moving average, before testing the $30.04 level.
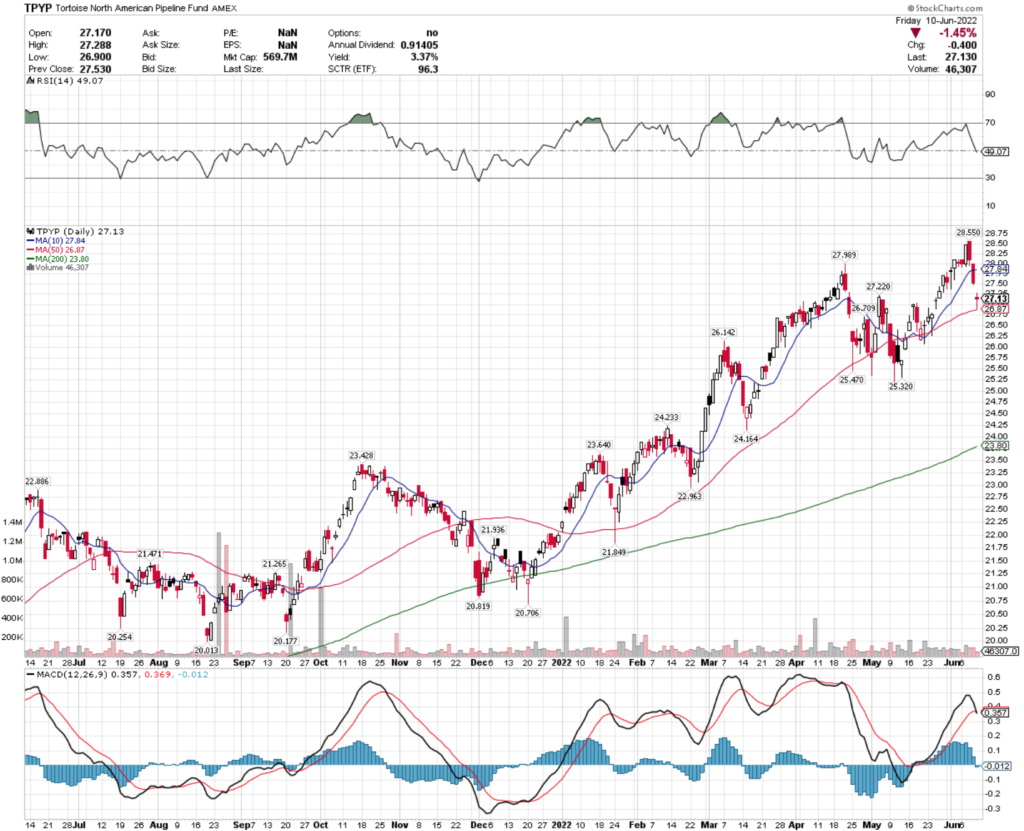
TPYP ETF – Tortoise North American Pipeline Fund ETF
TPYP ETF’s MACD is bearishly crossing over, and their RSI is neutral, so there may be some short-term weakness coming.
Unfortunately, they do not have options, but their 3.37% dividend yield can form an appealing price cushion for losses if an investor holds the ETF for a year.
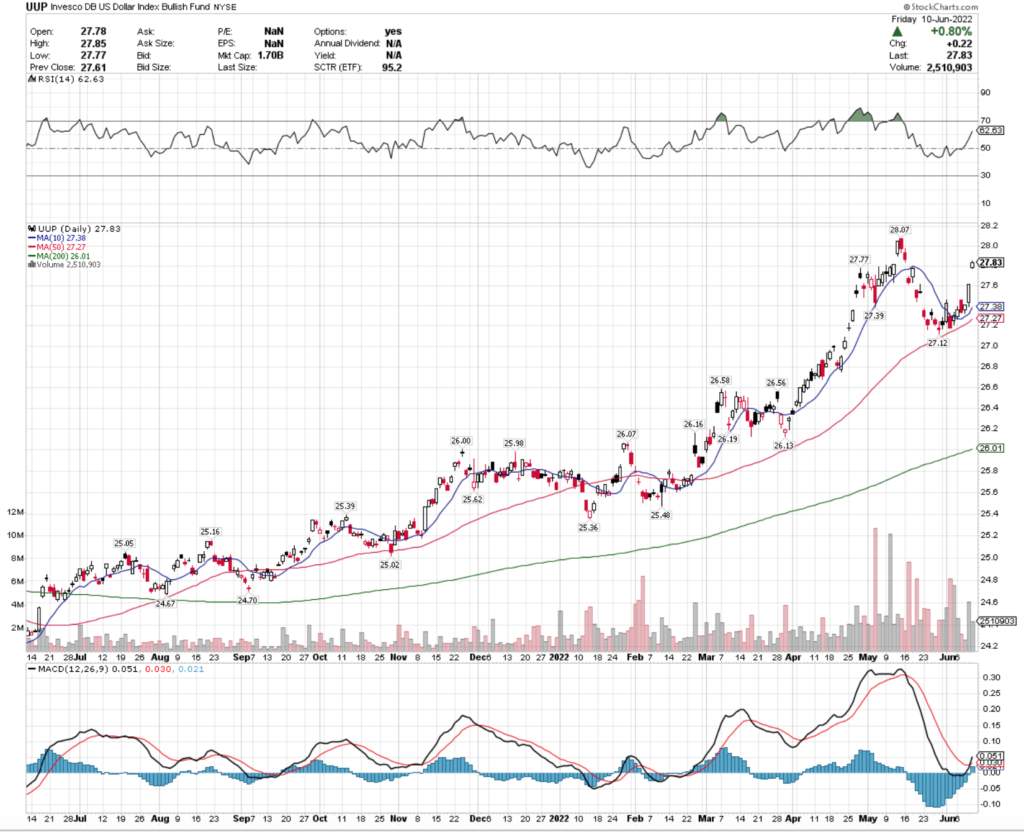
UUP ETF – Invesco DB US Dollar Index Bullish Fund ETF
UUP has recently completed a bullish MACD crossover, and its RSI is approaching overbought after Friday’s 0.8% gap up.
They do not offer a dividend, but they do have options that traders can use to profit & hedge against volatility as they march onward to test the $28.07 level.
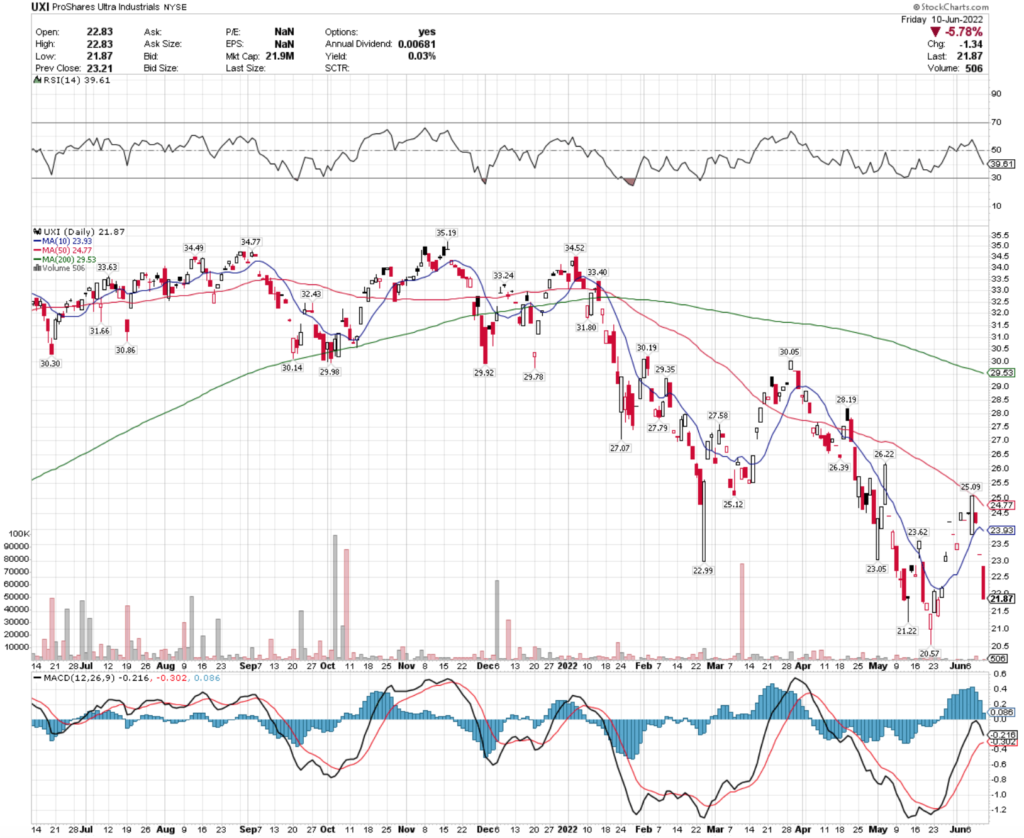
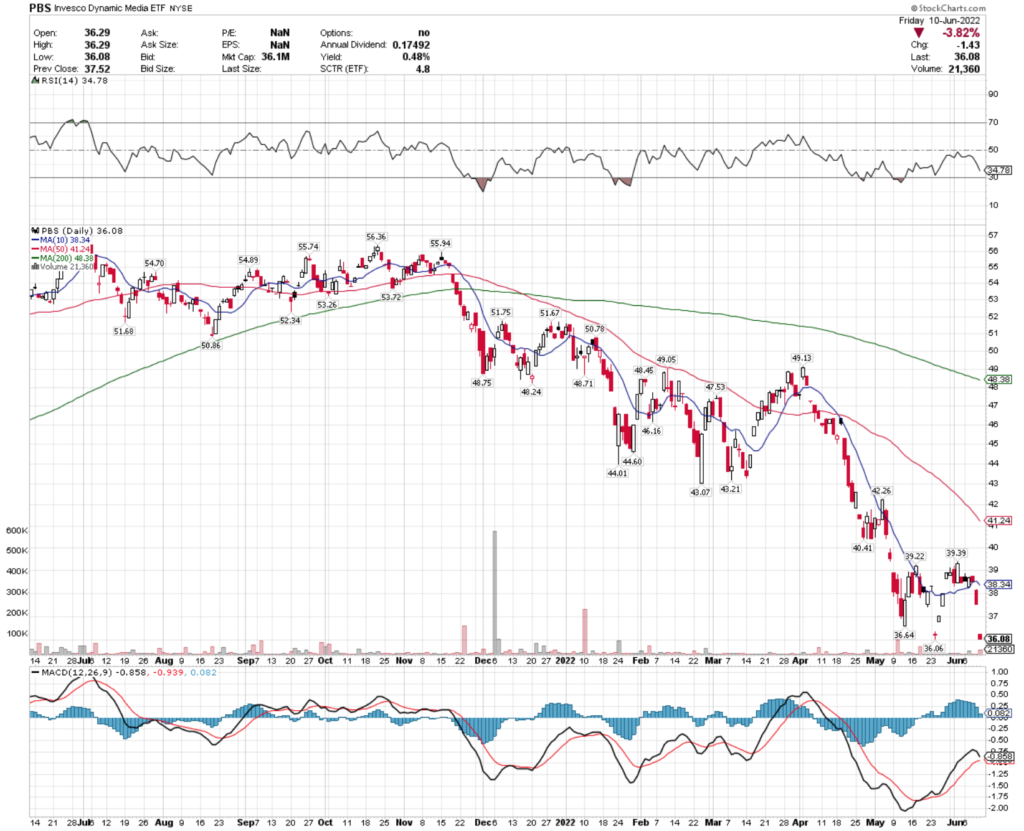
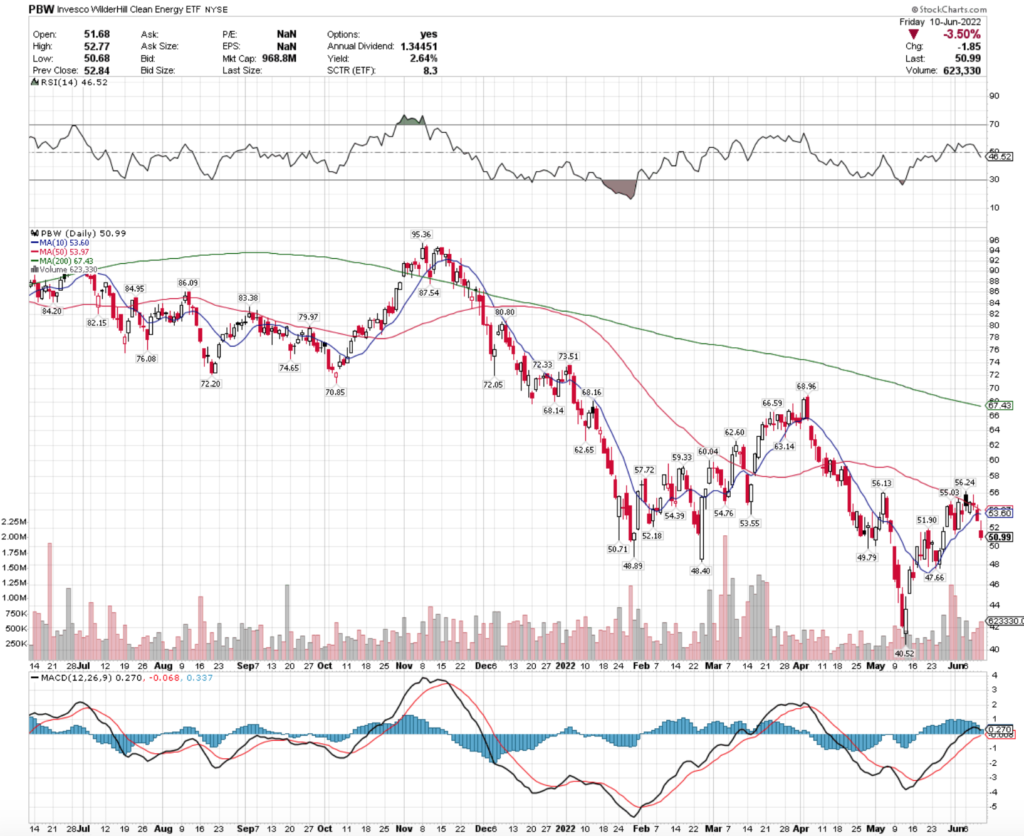
Cannabis (TOKE), Industrials (UXI), Dynamic Media (PBS) & Clean Energy (PBW) Bearishly Lagging The Markets
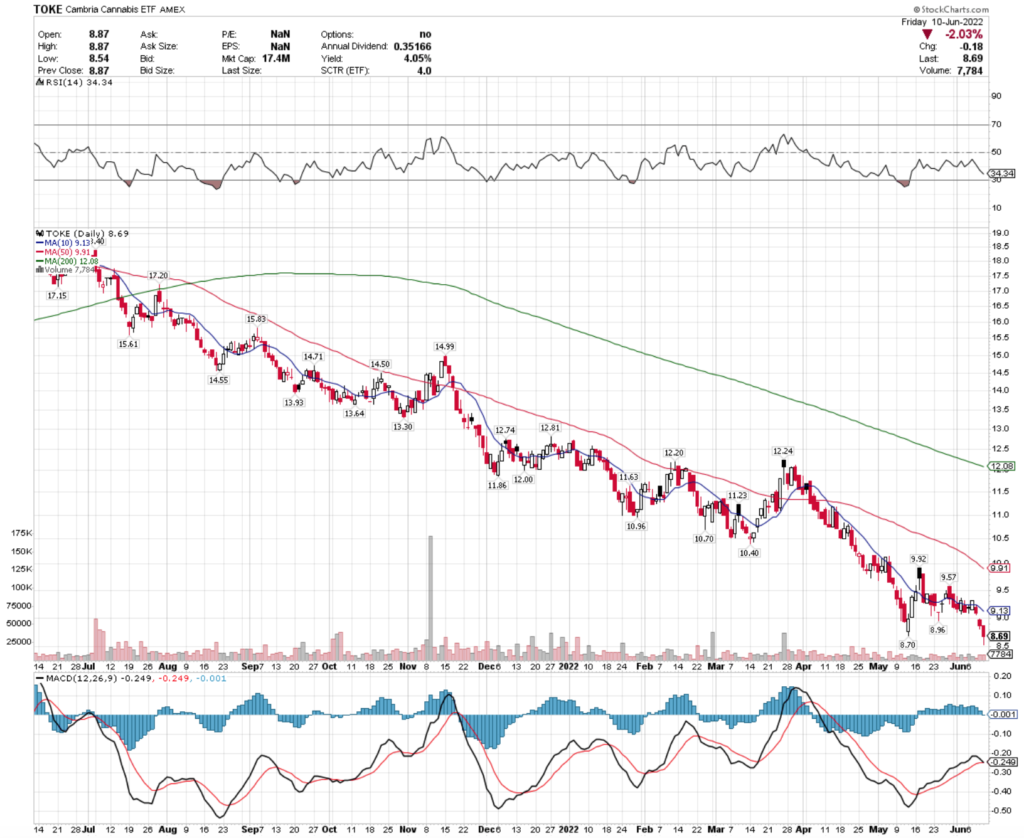
TOKE, the Cambria Cannabis ETF has had a disappointing past year (I have a position in TOKE), and they appear to be facing additional near-term losses.
TOKE ETF – Cambria Cannabis ETF
They broke through their $8.70 support level, and their MACD is bearishly crossing over, signaling that they are going to continue lower in the coming days.
They do not have options, but do offer a 4.05% dividend yield that can serve as a cushion for investors who hold the ETF for a year.
Their MACD is about to bearishly cross over, despite their RSI almost being in oversold territory signaling that this name is not out of the woods yet & should see more near-term price declines.
PBW also has a bearish crossover approaching on its MACD, and a neutral RSI.
If they fall below the $49.79 level, they should test the $48.89 support line after.
PBW pays a 2.64% dividend yield, and also has options, making this a name that can be turned into profits, even during market downturns.
Tying It All Together – The Week Ahead
Next week looks to be a continuation of late last week, unless there are some surprises in store for the data being reported.
NY Fed Inflation expectations will be reported on Monday, followed by the NFIB Small Business Index & PPI Final Demand numbers on Tuesday.
Based on the other numbers that we are seeing reported, these look to also be disappointing for markets.
Retail Sales, the Empire State Manufacturing Index & the NAHB Homebuilders Index numbers will all be released on Wednesday, along with the FOMC statement & projections in the afternoon.
Thursday will have unemployment numbers, along with housing starts & building permits, and the Philadelphia Fed Manufacturing Index.
Friday closes the week off with Industrial Production Index, Capacity Utilization & Leading Economic Indicators numbers being reported.
Pending any surprises, Friday’s move down should continue into next week, as market participants try to establish what the market’s fair value is.
*** I DO NOT OWN SHARES OF QLD, SPY, OIH, CORN, TPYP, UUP, UXI, PBS or PBW ETFs ***
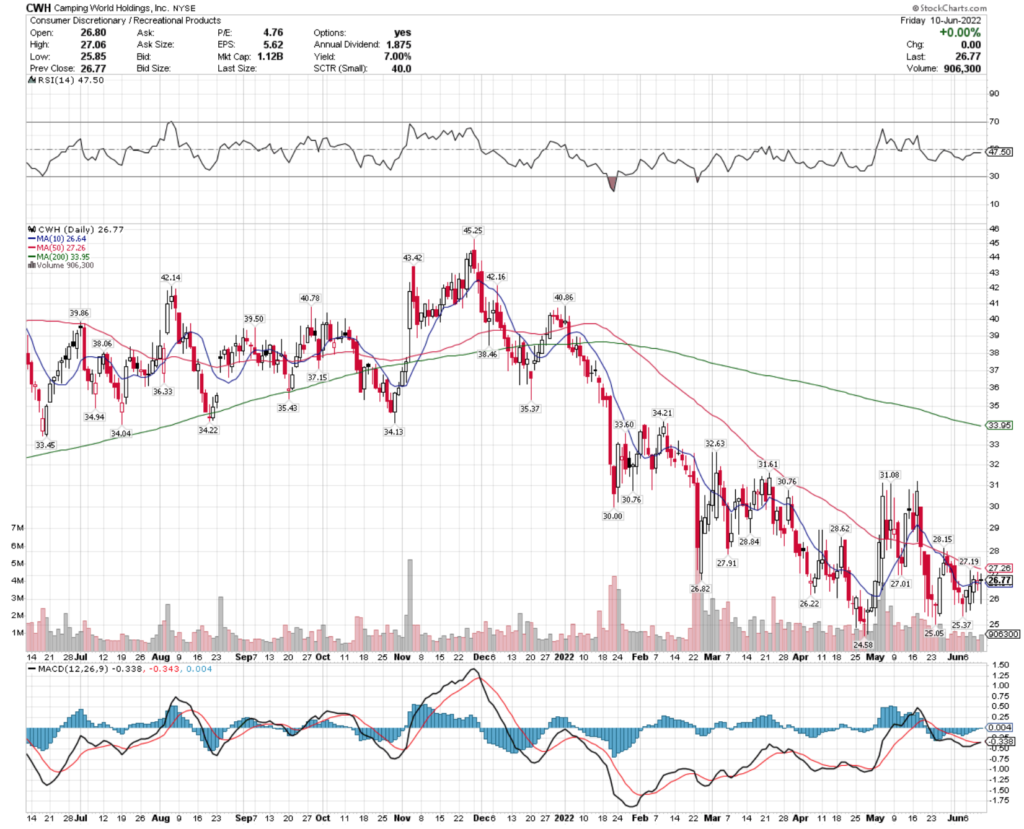
Camping World Holdings, Inc. stock trades under the ticker CWH & has shown recent bullishness that traders & investors should take a closer look into.
CWH closed at $26.77/share on 6/10/2022.
Camping World Holdings, Inc. CWH Stock’s Technical Performance Broken Down
CWH Stock Price: $26.77
10 Day Moving Average: $26.64
50 Day Moving Average: $27.26
200 Day Moving Average: $33.95
RSI: 47.5
MACD: -0.338
Yesterday, CWH stock completed a bullish MACD crossover, closing above its 10 day moving average.
Their RSI is neutral & trading volumes have been below average recently compared to the year prior.
They will need to break above the $27.19 & $27.91 resistance levels as they continue to climb higher.
Camping World Holdings, Inc. CWH Stock As A Long-Term Investment
Long-term oriented investors will like CWH stock’s P/E (ttm) of 4.96, but may find their P/B (mrq) to be a bit high at 9.18.
They recently reported 6.7% Quarterly Revenue Growth Y-o-Y, with -28.2% Quarterly Earnings Growth.
Their balance sheet will require a closer review, with $139.48M of Total Cash (mrq) & $3.57B of Total Debt (mrq).
CWH stock pays a 5.14% dividend yield, which appears sustainable in the long-term, with a 32.95% payout ratio.
94.44% of CWH stock’s outstanding share float is owned by institutional investors.
Camping World Holdings, Inc. CWH Stock As A Short-Term Trade Using Options
Short-term oriented traders can use options to profit from CWH stock’s price movements, while also hedging against broader market volatility.
I am looking at the contracts with the 6/17 expiration date.
The $26, $25 & $24.50 call options are all in-the-money, but all three strike prices are far less liquid than the out-of-the-money $27 call (underlying price is currently 3% below the strike).
The $29, $27 & $28 puts are also in-the-money (listed in order of open interest levels) and are much more liquid than the call options, signaling bearish sentiment.
Tying It All Together
CWH stock has many characteristics that traders & investors will find interesting.
Investors will like their dividend yield & their valuation metrics, but may want to review their balance sheet more thoroughly before investing.
Traders will like their current technical performance compared to other securities, as well as the liquidity of their options contracts.
Overall, it is worth taking a closer look into CWH stock to see how it fits into your portfolio strategy.
*** I DO NOT OWN SHARES OF CWH STOCK AT THE TIME OF PUBLISHING THIS ARTICLE ***
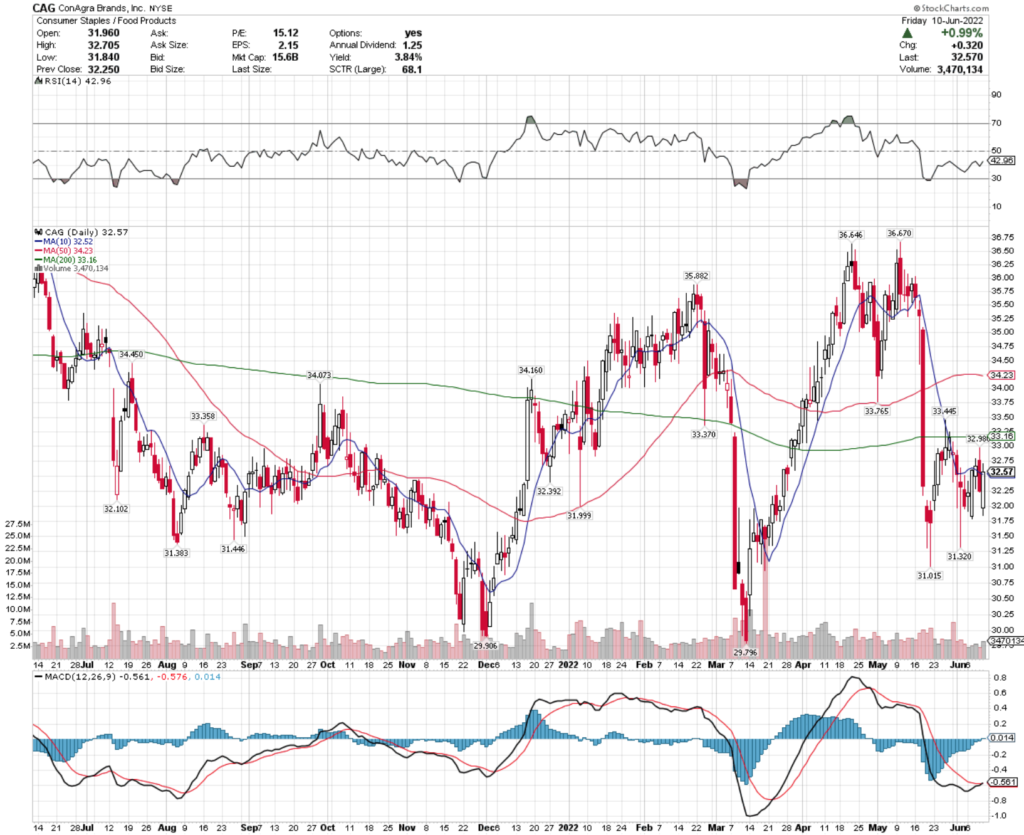
ConAgra Brands, Inc. stock trades under the ticker CAG & has shown recent bullish behavior that traders & investors should take a closer look into.
CAG stock closed at $32.57/share on 6/10/2022.
ConAgra Brands, Inc. CAG Stock’s Technical Performance Broken Down
CAG Stock Price: $32.57
10 Day Moving Average: $32.52
50 Day Moving Average: $34.23
200 Day Moving Average: $33.16
RSI: 42.96
MACD:-0.561
Yesterday, CAG stock completed a bullish MACD crossover, settling above its 10 day moving average.
Their RSI is still on the oversold side of neutral, and volumes have been about average for the year.
They will need to break above the $32.98 & $33.37 resistance levels as they continue to climb higher.
ConAgra Brands, Inc. CAG Stock As A Long-Term Investment
Long-term oriented investors will like CAG stock’s valuation metrics, with a 15.04 P/E (ttm) & a 1.77 P/B (mrq).
They recently reported 5.1% Quarterly Revenue Growth Y-o-Y, on -22.4% Quarterly Earnings Growth Y-o-Y.
Their balance sheet will require a thorough review, with $79.7M in Total Cash (mrq) & $9.16B in Total Debt (mrq).
CAG stock pays a 3.76% dividend yield, which may not be sustainable in the long-term, as their payout ratio is 56.4%.
87.14% of CAG stock’s outstanding share float is owned by institutional investors
ConAgra Brands, Inc. CAG Stock As A Short-Term Trade Using Options
Traders focusing on the short-term can use options to hedge against broader market volatility, while profiting from CAG stock’s price movements in any direction.
I am looking at the contracts with the 6/17 expiration date.
The $32, $31 & $30 calls are all in the money, with the former being the most liquid of the three strikes.
The $35, $36 & $34 puts are also all in-the-money & are much more liquid than the calls mentioned above, showing broader bearish sentiment from the markets.
Tying It All Together
CAG stock has many interesting attributes that traders & investors will like.
Investors will like their valuation metrics & dividend yield, but may want to look closer into their balance sheet to see how their debt picture looks, and to shed light onto their dividend sustainability.
Traders will like the liquidity of their options in the near-term, particularly the puts.
Overall, it is worth taking a closer look at CAG stock to see how it fits into your portfolio strategy.
*** I DO NOT OWN SHARES OF CAG STOCK AT THE TIME OF PUBLISHING THIS ARTICLE ***
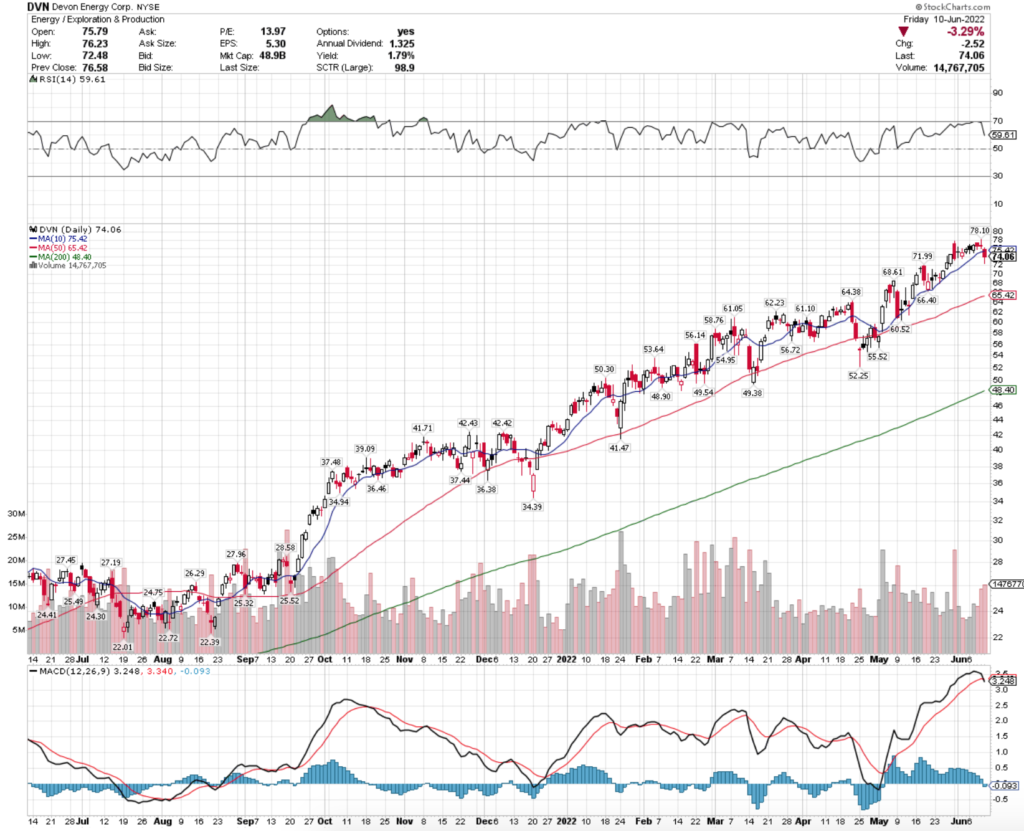
Devon Energy Corp. stock trades under the ticker DVN & has recently shown bullish behavior that traders & investors should research further, as a means of identifying an entry.
DVN stock closed at $74.06/share on 6/10/2022.
Devon Energy Corp. DVN Stock’s Technical Performance Broken Down
DVN Stock Price: $74.06
10 Day Moving Average: $75.42
50 Day Moving Average: $65.42
200 Day Moving Average: $48.40
RSI: 59.61
MACD: 3.248
Yesterday, DVN stock completed a bearish MACD crossover, trading on above average volume compared to the year prior.
Their share price has been steadily climbing since the middle of September 2021, although their current technicals look like there may be more pain to come in the near-term.
This enables traders & investors to enter a new position or add to an existing one as the price goes down, and can also lead to opportunities to capitalize on puts, whose profits can be used to buy new shares using house money.
Devon Energy Corp. DVN Stock As A Long-Term Investment
Long-term focused investors will like DVN stock’s P/E (ttm) of 13.07, but will find its 4.96 P/B (mrq) to be high.
They recently reported 74% Quarterly Revenue Growth Y-o-Y, with 364.3% Quarterly Earnings Growth Y-o-Y.
Their balance sheet will require a closer examination, with $2.46B of Total Cash (mrq) & $6.74B of Total Debt (mrq).
DVN stock pays a 3.49% dividend yield, which appears stable in the long-run, with a 49.9% payout ratio.
85.22% of DVN stock’s outstanding share float is owned by institutional investors.
Devon Energy Corp. DVN Stock As A Short-Term Trade Using Options
Short-term oriented traders can use options to hedge against market volatility, while profiting from DVN stock’s price movements.
This can also be beneficial for acquiring new shares of DVN with the profits from the options, which will then pay dividends.
I am looking at the contracts with the 6/17 expiration date.
The $74, $73 & $72 calls are all in-the-money, although the former is the only one that has a high level of open interest (851 vs. 63 vs. 29).
The $77, $76 & $75 puts are all in-the-money & are much more liquid than the calls.
Tying It All Together
DVN stock has many characteristics that traders & investors will find appealing.
Investors will like their dividend yield & their P/E (ttm), but they may want to review their balance sheet a bit further before investing.
Traders will like their current technical set up, and will be pleased with the liquidity of their put contracts.
Overall, DVN stock is worth taking a closer look into to see how it fits into your portfolio strategy.
*** I DO NOT OWN SHARES OF DVN STOCK AT THE TIME OF PUBLISHING THIS ARTICLE ***
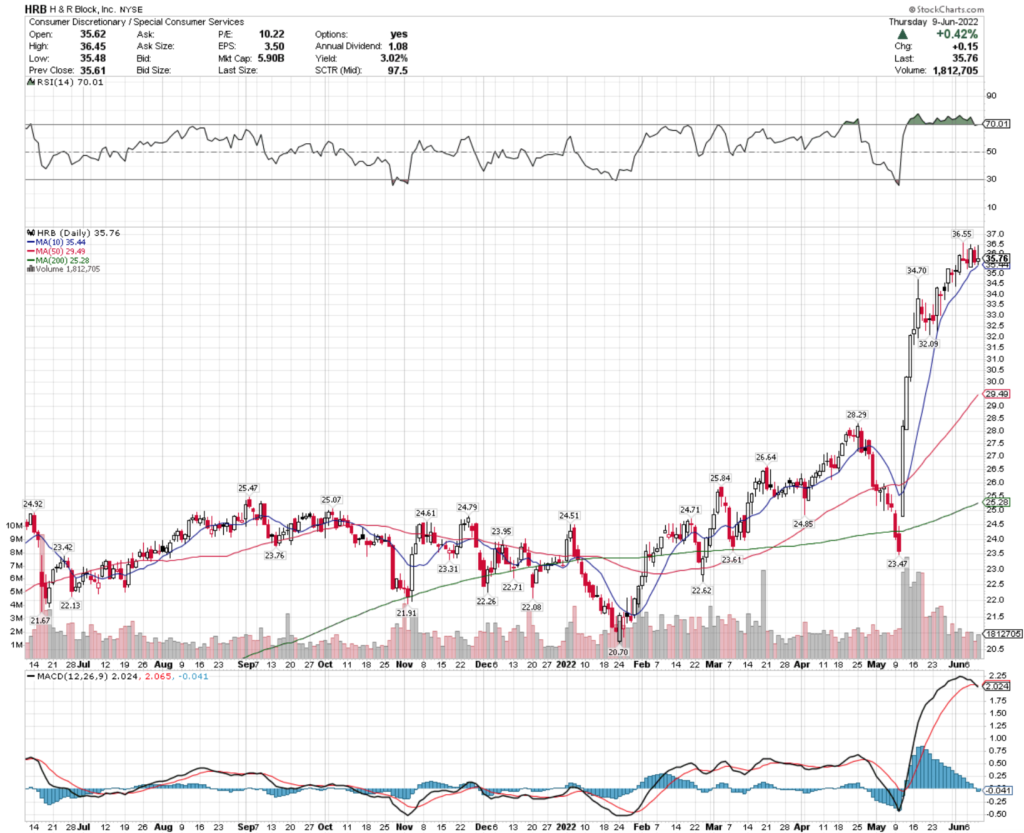
H & R Block, Inc. stock trades under the ticker HRB & has shown recent bullishness amidst a volatile market that traders & investors may be interested in.
HRB stock closed at $35.76/share on 6/9/2022.
H & R Block, Inc. HRB Stock’s Technical Performance Broken Down
HRB Stock Price: $35.76
10 Day Moving Average: $35.44
50 Day Moving Average: $29.49
200 Day Moving Average: $25.28
RSI: 70.01
MACD: 2.024
Yesterday, HRB stock completed a bearish MACD crossover, after gaining 52.4% over the month of May.
Their RSI is in overbought territory & their recent trading volumes have been above average.
Traders & investors may think to purchase puts in HRB stock, as well as common shares, so that they can purchase shares from the profit of the puts, while also earning 3% in dividend payments on the common shares.
Given that HRB stock is near its 52 week high, it is imperative to purchase in-the-money puts, in the event that it continues climbing in the near-term.
H & R Block, Inc. HRB Stock As A Long-Term Investment
Long-term oriented investors will like HRB stock’s P/E (ttm) 10.64, however their P/B (mrq) is a bit high at 117.7.
They recently reported Quarterly Earnings Growth Y-o-Y 3.9%, with -11.2% Quarterly Earnings Growth.
Their balance sheet will require a closer examination, with $1.04B in Total Cash (mrq) & $2.38B of Total Debt (mrq).
HRB stock pays a 3.12% dividend yield, which appears stable in the long-run with a 33.44% payout ratio.
93.14% of HRB stock’s outstanding share float is owned by institutional investors.
H & R Block, Inc. HRB Stock As A Short-Term Trade Using Options
Short-term traders & those employing the long/short strategy outlined above can use options to profit from HRB stock’s movement in either direction, being able to put their profits into new shares.
I am looking at the contracts with the 6/17 expiration date.
The $35, $34 & $33 calls are all in-the-money, with the former two strikes more liquid than the latter.
The $36, $37 & $38 puts are also all in-the-money, with the former being more liquid than the latter two strikes.
Tying It All Together
HRB stock has many interesting characteristics that traders & investors can capitalize on in both the near & long-terms.
Investors will like their dividend yield, as well as their P/E (ttm).
Traders will like their current technical strength, but they may be disappointed in the liquidity of their short-term options.
All-in-all, HRB stock is worth taking a closer look into, regardless of your trading strategy.
*** I DO NOT OWN SHARES OF HRB STOCK AT THE TIME OF PUBLISHING THIS ARTICLE ***
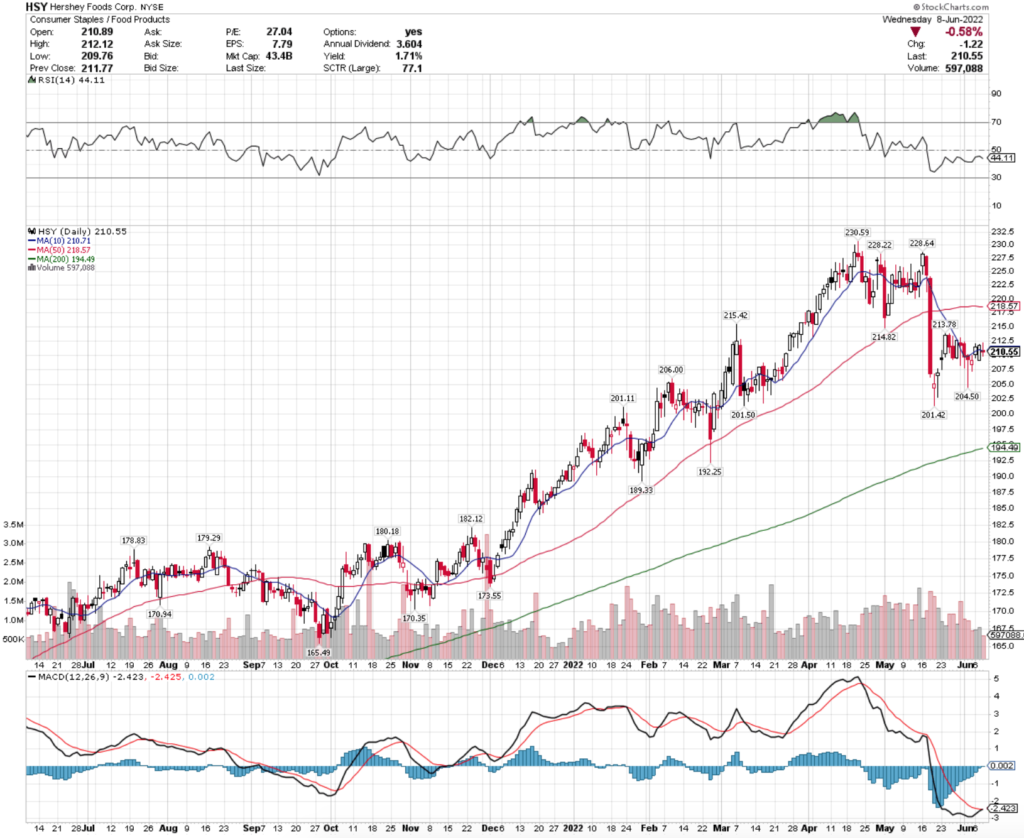
Hershey Foods Corp. stock trades under the ticker HSY & has recently shown bullish behavior that traders & investors should research further into.
HSY stock closed at $210.55/share on 6/8/2022.
Hershey Foods Corp. HSY Stock’s Technical Performance Broken Down
HSY Stock Price: $210.55
10 Day Moving Average: $210.71
50 Day Moving Average: $218.57
200 Day Moving Average: $194.49
RSI: 44.11
MACD: -2.423
Yesterday, HSY stock completed a bullish MACD crossover, settling just below its ten day moving average.
Their recent trading volume has been above average compared to the year prior, which combined with their RSI being oversold may signal more short-term momentum.
They will need to break out above the $213.78 & $214.82 resistance levels.
Hershey Foods Corp. HSY Stock As A Long-Term Investment
Long-term oriented investors will like HSY stock’s P/E (ttm) of 26.37, but they will find their P/B (mrq) of 14.47 to be too high.
They recently reported Quarterly Revenue Growth Y-o-Y of 16.1%, with 34.8% Quarterly Earnings Growth Y-o-Y.
Their balance sheet will require a closer examination, with $338.1M in Total Cash (mrq) & $5.31B in Total Debt (mrq).
HSY stock pays a 1.66% dividend yield, which appears stable in the long run as their payout ratio is 45.08%.
77.8% of HSY stock’s outstanding share float is owned by institutional investors.
Hershey Foods Corp. HSY Stock As A Short-Term Trade Using Options
Short-term focused traders can use options to hedge against broader market volatility, while also profiting from movements in HSY stock’s price.
I am looking at the contracts with the 6/17 expiration date.
The $205, $207.50 & $210 call options are all in the money, but are relatively illiquid with 126 total contracts of open interest between the three strike prices.
The $212.50 & $215 are more liquid, but out-of-the-money.
The $220, $215 & $212.50 puts are also all in-the-money, but are even less liquid.
Tying It All Together
HSY stock has many interesting characteristics that traders & investors may find appealing.
Investors will like their P/E (ttm) & their dividend yield, as well as the sustainability of their interest payments in the longer-run.
Traders will like their current momentum, but may be disapointed by the liquidity of their options contracts.
All-in-all, it is worth taking a closer look into HSY stock to see how it fits into your portfolio strategy.
*** I DO NOT OWN SHARES OF HSY STOCK AT THE TIME OF PUBLISHING THIS ARTICLE ***
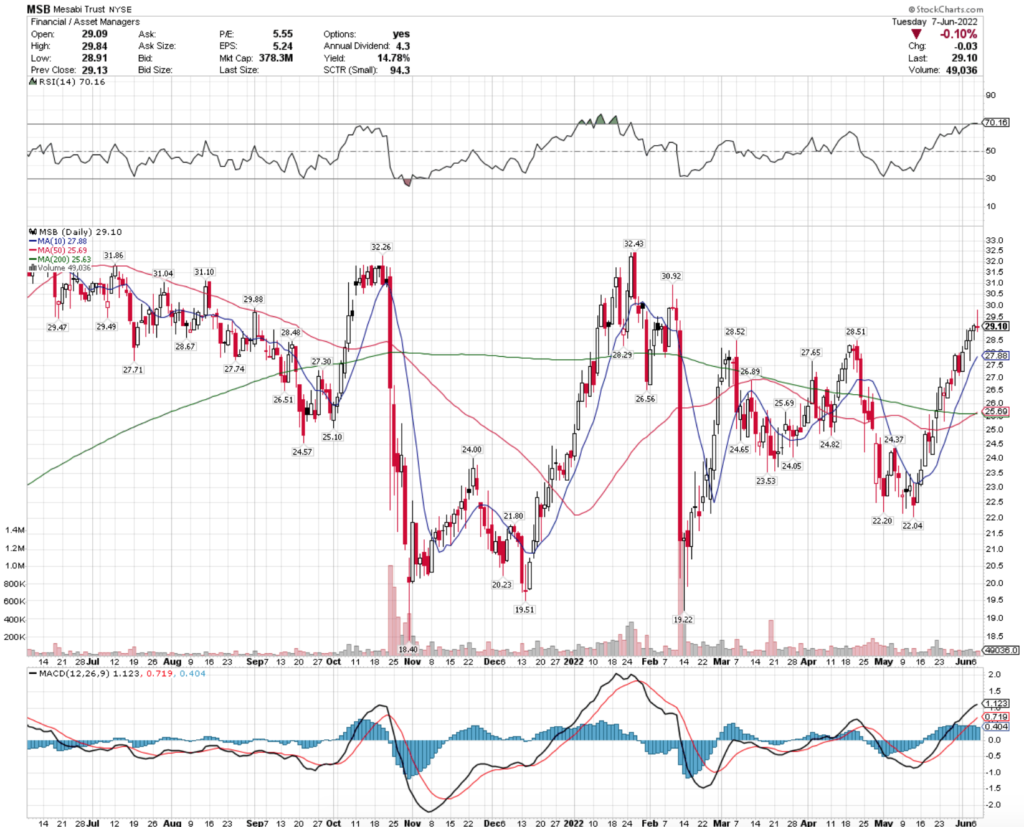
Mesabi Trust stock trades under the ticker MSB & has shown recent bullish behavior that traders & investors should examine more closely.
MSB stock closed at $29.10/share on 6/7/2022.
Mesabi Trust MSB Stock’s Technical Performance Broken Down
MSB Stock Price: $29.10
10 Day Moving Average: $27.88
50 Day Moving Average: $25.69
200 Day Moving Average: $25.63
RSI: 70.2
MACD: 1.123
Yesterday, MSB stock’s 50 Day Moving Average broke out above their 200 Day MA, after a month of solid gains.
Their RSI is in overbought territory & their MACD is beginning to curl over bearishly, signaling that there may be a near-term dip that traders & investors can capitalize on as an entry-point.
They will need to break above the $29.88 & $30.92/share resistance levels as they continue to climb higher.
Mesabi Trust MSB Stock As A Long-Term Investment
Long-term oriented investors will like MSB stock’s P/E (ttm) of 4.91, but will find their P/B (mrq) of 10.97 to be high.
They recently reported 65.8% Quarterly Revenue Growth Y-o-Y, with 74.5% Quarterly Earnings Growth Y-o-Y.
Their Balance Sheet shows $47.73M of Total Cash (mrq).
MSB stock pays a 14.25% dividend yield, which may not be sustainable in the long-run as their payout ratio is 79.2%.
Mesabi Trust MSB Stock As A Short-Term Trade Using Options
Short-term focused traders can use options to profit from MSB stock’s price movements, while hedging against market volatility.
I am looking at the contracts with the 6/17 expiration date.
The $20, $22.50 & $25 calls are all in-the-money, although the former 2 are much less liquid than the latter.
While it is out-of-the-money, the $30 calls are much more liquid than the three strikes mentioned above.
The $50, $45 & $30 puts also have the best liquidity of the strike prices that are in-the-money.
Tying It All Together
Investors & traders are sure to like many of MSB stock’s attributes.
Investors will like their dividend yield & low levels of reported debt, but they may need to be cautious about how long to expect the yield to be sustainable.
Traders will like their current momentum, but may be disappointed by how liquid their options are.
Overall, it is worth taking a closer look at MSB stock to see how it fits into your portfolio strategy.
*** I DO NOT OWN SHARES OF MSB STOCK AT THE TIME OF PUBLISHING THIS ARTICLE ***
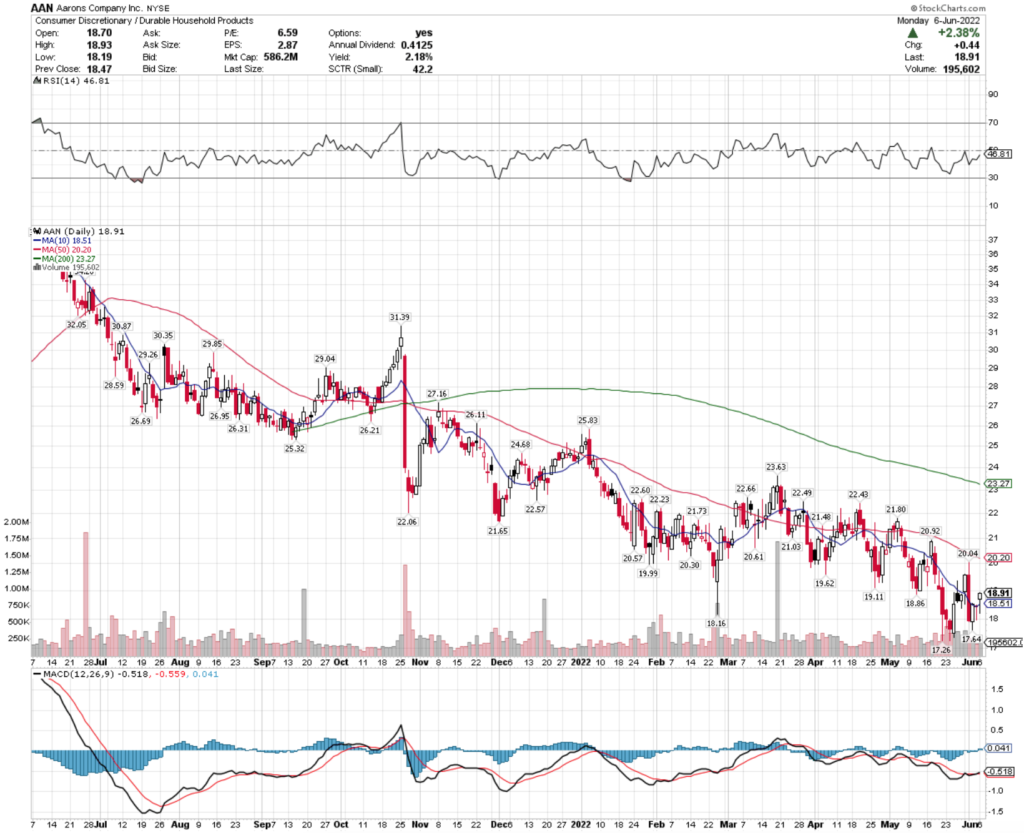
Aaron’s Company Inc. stock trades under the ticker AAN & has recently shown bullishness that traders & investors should take a closer look at.
AAN stock closed at $18.91/share on 6/6/2022.
Aaron’s Company Inc. AAN Stock’s Technical Performance Broken Down
AAN Stock Price: $18.91
10 Day Moving Average: $18.51
50 Day Moving Average: $20.20
200 Day Moving Average: $23.27
RSI: 46.81
MACD: -0.518
Yesterday, AAN stock completed a bullish MACD crossover, while breaking out above its 10 day moving average.
They have recently been trading at about average volume compared to the year prior, and have a neutral RSI, signaling that there may be more near-term bullish momentum to come.
They will need to break above the $19.11 & $19.62/share resistance levels as they continue to climb higher.
Aaron’s Company Inc. AAN Stock As A Long-Term Investment
Long-term oriented investors will like AAN stock’s P/E (ttm) of 6.27, as well as their P/B (mrq) of 0.76.
They recently reported Quarterly Revenue Growth Y-o-Y of -5.2%, with -40.7% Quarterly Earnings Growth Y-o-Y.
Their balance sheet will require a closer examination, with $13.52M of Total Cash (mrq) & $317.98M of Total Debt (mrq).
AAN stock pays a 2.23% dividend yield, which appears stable in the long-term, as their payout ratio is 14.22%.
97.2% of AAN stock’s outstanding share float is owned by institutional investors.
Aaron’s Company Inc. AAN Stock As A Short-Term Trade Using Options
Short-term focused traders can use options to profit from AAN stock’s price movements, while protecting themselves from broader market volatility.
I am looking at the contracts with the 6/17 expiration date.
The $15 & $17.50 call options are the only liquid strikes in-the-money, with $20 being even more liquid, but require a 6% gain in price in 10 days to become in-the-money.
The $25, $22.50 & $20 puts are also all in-the-money, but even combined are much less liquid than the out-of-the-money $17.50 put (7% above being in-the-money).
Tying It All Together
AAN stock has many interesting characteristics that traders & investors are sure to like.
Investors will like their valuation metrics, as well as their dividend yield, but may want to research their balance sheet structure further before investing.
Traders will like their recent technical performance, but will be disappointed by the lack of open interest in their options contracts.
Overall, it is worth taking a closer look at AAN stock to see how it fits into your portfolio strategy.
*** I DO NOT OWN SHARES OF AAN STOCK AT THE TIME OF PUBLISHING THIS ARTICLE ***