Hess Midstream Partners LP stock trades under the ticker HESM & closed for trading at $25.45/share on 7/28/2021.
HESM stock has shown recent technical strength, with a bullish MACD crossover yesterday on a 9%+ gap up day.
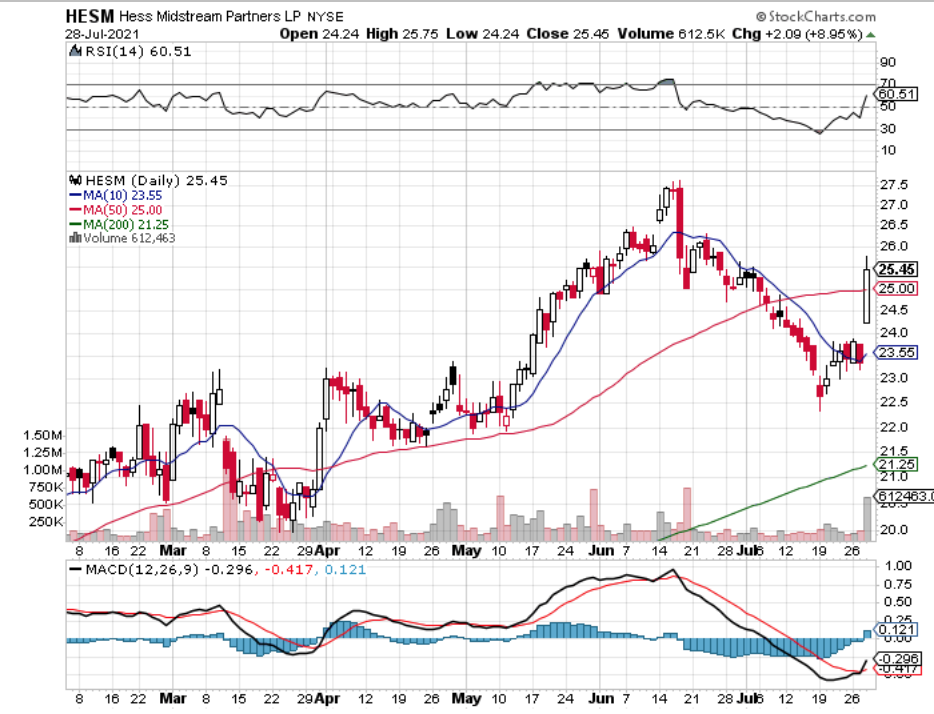
HESM Stock Price: $25.45
10 Day Moving-Average: $23.55
50 Day Moving-Average: $25.00
200 Day Moving-Average: $21.25
RSI: 60.51
Hess Midstream Partners LP’s stock looks to have a bit of momentum driving it forward, as the 10 Day Moving-Average approaches the 50 Day MA.
Their RSI is a bit high at 60, but as they begin to establish a new range this will settle down & enable them to keep growing from a not being overbought standpoint.
If HESM is able to cross the $25.71 mark then there looks to be open room to run up to $26.50- low $27’s.
From an options perspective, the HESM calls & puts with the $25 strike price look most appealing, as the $30 calls are far out of the money and the $30 puts (8/20 expiration) have no open interest.
Recall that the less open interest, the less liquidity there is, making it more difficult to unload your position.
Short-term & long-term traders alike have good reason to be looking into HESM stock & options.
From a long-term hold perspective HESM offers a 6.99% Dividend Yield, providing a near 7% cushion annually for investors.
Overall, Hess Midstream Partners LP looks to be a great opportunity for near & long-term investors & traders and is worth considering in your research.
*** I DO NOT OWN SHARES OF HESM STOCK ***