Kroger Co. KR Stock Analysis

Kroger Co. stock trades under the ticker KR & has shown recent bullishness that traders & investors should look closer into.

KR stock closed at $46.44/share on 7/29/2022.

Kroger Co. KR Stock’s Technical Performance Broken Down

Kroger Co. KR Stock's Technical Performance Over The Last Year

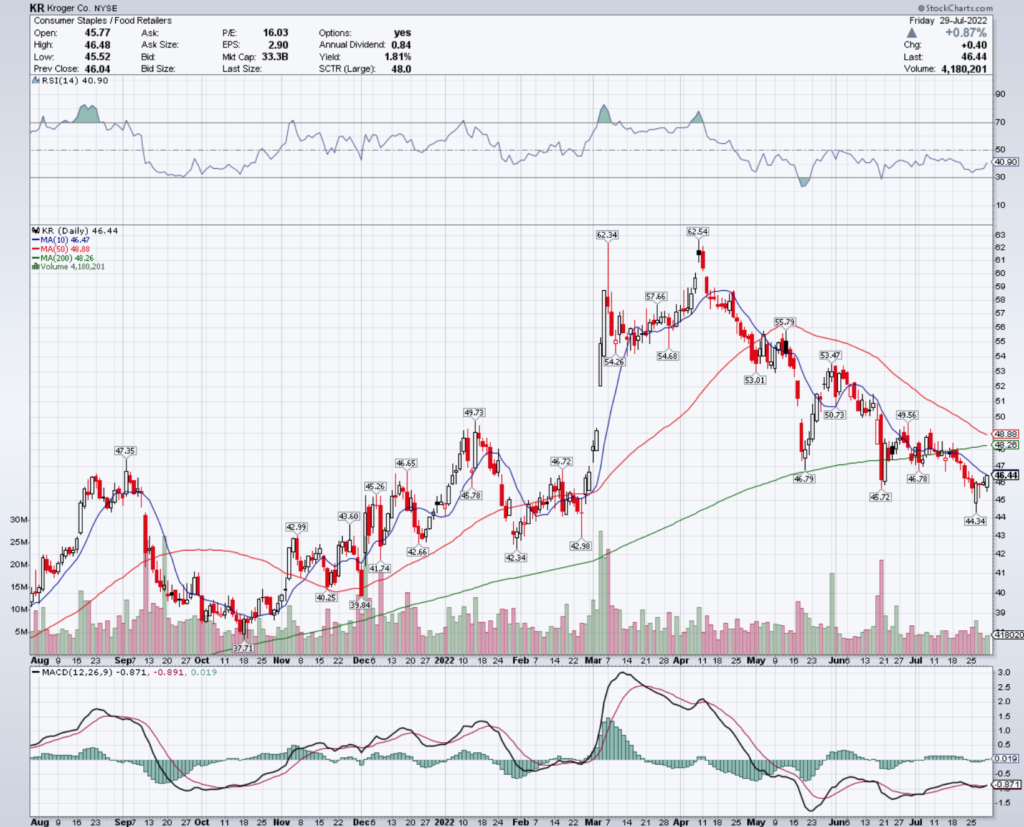
KR Stock Price: $46.44

10 Day Moving Average: $46.47

50 Day Moving Average: $48.88

200 Day Moving Average: $48.26

RSI: 40.9

MACD: -0.871

On Friday, KR stock completed a bullish MACD crossover, closing just beneath its 10 day moving average.

Their RSI is on the oversold side of neutral, and recent volumes have been lighter than average, signaling that investors still have an unsure sentiment about its price.

They need to remain above the $45.72 support level, while trying to break above the $46.78 resistance level.

Kroger Co. KR Stock As A Long-Term Investment

Long-term oriented investors will like KR stock’s 15.92 P/E (ttm), but may think that their 3.5 P/B (mrq) is too rich at 3.5.

They recently reported 8% Quarterly Revenue Growth Y-o-Y, with 374.3% Quarterly Earnings Growth Y-o-Y.

Their balance sheet will require a closer examination, with $1.38B of Total Cash (mrq) & $20.75B of Total Debt (mrq).

KR stock pays a 1.82% dividend yield, which appears to be stable in the long-run, as their payout ratio is 28%.

82.73% of KR stock’s outstanding share float is owned by institutional investors.

Kroger Co. KR Stock As A Short-Term Trade Using Options

Short-term focused traders can use options to profit from price movements in KR stock, while protecting themselves from broader market volatility.

I am looking at the contracts with the 8/19 expiration date.

The $46, $45 & $44 call options are all in-the-money, with the former having more open interest than the latter 2.

The $48, $47 & $46.50 puts are also all in-the-money, listed in order of most to least liquid.

Tying It All Together

KR stock offers many opportunities to investors & traders alike.

Investors will like their safe dividend, along with their P/E, but may want to look closer into their balance sheet.

Traders will like their current market performance in times of elevated volatility compared to many of their peers, as well as how liquid their options are.

All-in-all, it is worth taking a closer look into KR stock to see how it fits into your portfolio strategy.

*** I DO NOT OWN SHARES OF KR STOCK AT THE TIME OF PUBLISHING THIS ARTICLE ***

The Travelers Cos., Inc. TRV Stock Analysis

The Travelers Cos., Inc. stock trades under the ticker TRV & has shown recent bullishness that traders & investors should take a closer look into.

TRV stock closed at $158.96/share on 7/27/2022.

The Travelers Cos., Inc. TRV Stock’s Technical Performance Broken Down

The Travelers Cos., Inc. TRV Stock's Technical Performance Over The Last Year

TRV Stock Price: $158.96

10 Day Moving Average: $157.64

50 Day Moving Average: $167.32

200 Day Moving Average: $165.64

RSI: 42.51

MACD: -2.705

Yesterday, TRV stock completed a bullish MACD crossover, despite settling down 1.18%

Their RSI is still in oversold territory, and their recent trading volumes have been about average compared to the year prior, signaling that there may still be some momentum to come in the near-term.

They will need to break above the $159.76 & $160.52/share resistance levels as they continue to climb higher.

The Travelers Cos., Inc. TRV Stock As A Long-Term Investment

Long-term oriented investors will like TRV stock’s valuation metrics, with a 10.87 P/E (ttm) & a 1.62 P/B (mrq).

They recently reported 5.2% Quarterly Revenue Growth Y-o-Y, with -41% Quarterly Earnings Growth Y-o-Y.

Their balance sheet will warrant a closer review before making an investment though, with $4.28B of Total Cash (mrq) & $7.29B of Total Debt (mrq).

TRV stock pays a 2.22% dividend yield, which appears to be sustainable in the long-run, with a 24.8% payout ratio.

85% of TRV stock’s outstanding share float is owned by institutional investors.

The Travelers Cos., Inc. TRV Stock As A Short-Term Trade Using Options

Short-term oriented traders can use options to profit from short term movements in TRV stock’s price, while hedging against broader market volatility.

I am looking at the contracts with the 8/19 expiration date.

The $155, $150 & $140 calls are all in-the-money, listed from most to least liquid.

The $160, $165 & $170 puts are also all in-the-money, with the former being more liquid than the latter strikes.

Tying It All Together

TRV stock has many interesting characteristics that traders & investors will find appealing.

Investors will like their valuation metrics, as well as their dividend yield, but may want to review the structure of their balance sheet before making an investment.

Traders will like their current technical strength amid volatility, but may be disappointed by how liquid their options are.

All-in-all, TRV stock is worth taking a closer look into to see how it fits into your portfolio strategy.

*** I DO NOT OWN SHARES OF TRV STOCK AT THE TIME OF PUBLISHING THIS ARTICLE ***

Southwest Gas Corp. SWX Stock Analysis

Southwest Gap Corp. stock trades under the ticker SWX & has shown recent bullishness that traders & investors should research further into.

SWX stock closed at $86.09/share on 7/26/2022.

Southwest Gas Corp. SWX Stock’s Technical Performance Broken Down

Southwest Gas Corp. SWX Stock's Technical Performance Over The Last Year

SWX Stock Price: $86.09

10 Day Moving Average: $85.15

50 Day Moving Average: $88.74

200 Day Moving Average: $76.01

RSI: 49.23

MACD: -0.818

Yesterday, SWX stock completed a bullish MACD crossover, while break out & settling above its 10 day moving average.

With a neutral RSI & low trading volumes in the recent days compared to the year prior, there seems to be a lot of uncertainty about the future direction of SWX stock in the near-term.

They will need to remain above their support levels of $85.15 & $84.89, while trying to break above their $88.74 & $89.97/share resistance levels.

Southwest Gas Corp. SWX Stock As A Long-Term Investment

Long-term oriented investors will like SWX stock’s valuation metrics, with a 29.05 P/E (ttm) & a 1.63 P/B (mrq).

They recently reported 43.1% Quarterly Revenue Growth Y-o-Y, with -18% Quarterly Earnings Growth Y-o-Y.

Their balance sheet will require an additional review, with $624.7M of Total Cash (mrq) & $6.23B of Total Debt (mrq).

SWX stock pays a 2.8% dividend, which may not be sustainable in the long-run, with an 81.23% payout ratio/

Still, 95.3% of SWX stock’s outstanding share float is owned by institutional investors.

Southwest Gas Corp. SWX Stock As A Short-Term Trade Using Options

Short-term focused traders can use options to profit from SWX stock’s price movements, while hedging against volatility in the broader markets.

I am looking at the contracts with the 8/19 expiration date.

The $70, $65, $75 & $85 call options are all in-the-money, listed from highest to lowest levels of open interest.

The $90 puts are the only strike price in-the-money at the moment, although there is liquidity at the $85 & $80 levels.

Tying It All Together

SWX stock has a lot of characteristics that traders & investors are sure to find appealing.

Investors will like their valuation metrics & dividend yield, but may want to review their balance sheet to see how sustainable that yield is in the long-term.

Traders will like the way that they have weathered recent market volatility, but will be disappointed by how illiquid their options are.

Overall, it is worth taking a closer look into SWX stock to see how it fits into your portfolio strategy.

*** I DO NOT OWN SHARES OF SWX STOCK AT THE TIME OF PUBLISHING THIS ARTICLE ***

Procter & Gamble Co. PG Stock Analysis

Procter & Gamble Co. stock trades under the ticker PG & has shown recent bullishness that traders & investors should research further into.

PG stock closed at $143.99/share on 7/25/2022.

Procter & Gamble Co. PG Stock’s Technical Performance Broken Down

Procter & Gamble Co. PG Stock's Technical Performance Over The Last Year

PG Stock Price: $143.99

10 Day Moving Average: $143.10

50 Day Moving Average: $143.10

200 Day Moving Average: $149.50

RSI: 52.8

MACD: -0.028

Yesterday, PG stock completed a bullish MACD crossover, breaking out & settling above both their 10 & 50 day moving averages.

Their recent momentum may be unsustainable though, with recent trading volumes being below average compared to the year prior & their RSI is neutral.

They will need to stay above the $142.57 & $143.79/share support levels, and will need to break above the $144.30/share resistance level to continue climbing higher.

Procter & Gamble Co. PG Stock As A Long-Term Investment

Long-term oriented investors will like PG stock’s 25 P/E (ttm), but will find their 7.69 P/B (mrq) to be too high.

They recently reported 7% Quarterly Revenue Growth Y-o-Y, with 2.6% Quarterly Earnings Growth Y-o-Y.

Their balance sheet will require a closer examination, with $8.53B of Total Cash (mrq) & $33.67B of Total Debt (mrq).

PG stock pays a 2.43% dividend yield, which may not be sustainable in the long-run, as their payout ratio is 60.83%.

65.9% of PG stock’s outstanding share float is owned by institutional investors.

Procter & Gamble Co. PG Stock As A Short-Term Trade Using Options

Short-term oriented traders can use options to profit from price movements in PG stock, while hedging against broader market volatility.

I am looking at the contracts with the 8/19 expiration date.

The $140, $142 & $141 call options are all in-the-money, listed from most to least liquid.

The $145, $144 & $147 puts are also in-the-money, with the former having more open interest than the latter two strikes.

Tying It All Together

Proctor & Gamble stock has many interesting characteristics that traders & investors are sure to like.

Investors will like their recent growth & their dividend yield, but may want to research their balance sheet further to find more clues about how sustainable the yield is.

Traders will like their recent market performance amid volatility, as well as the liquidity of their options.

All-in-all, PG stock is worth taking a closer look into to see how it fits into your portfolio strategy.

*** I DO NOT OWN SHARES OF PG STOCK AT THE TIME OF PUBLISHING THIS ARTICLE ***

Sun Communities, Inc. SUI Stock Analysis

Sun Communities, Inc. stock trades under the ticker SUI & has shown recent bullish behavior that traders & investors should research further into.

SUI stock closed at $160.52/share on 7/23/2022.

Sun Communities, Inc. SUI Stock’s Technical Performance Broken Down

Sun Communities, Inc. SUI Stock's Technical Performance Over The Last Year

SUI Stock Price: $160.52

10 Day Moving Average: $159.55

50 Day Moving Average: $158.92

200 Day Moving Average: $180.17

RSI: 52.23

MACD: -0.126

On Friday, SUI stock completed a bullish MACD crossover, settling above its 10 day moving average.

Their recent trading volumes have been about average for the last year, which paired with a neutral RSI signals there may be more near-term strength to come.

They need to break above the $163.31 & $164.03/share resistance levels to continue climbing higher.

Sun Communities, Inc. SUI Stock As A Long-Term Investment

Long-term oriented investors may find SUI stock’s valuation metrics to be a bit rich, with a 51.12 P/E (ttm) & a 2.98 P/B (mrq).

They recently reported 23.8% Quarterly Revenue Growth Y-o-Y, although their -97.2% Quarterly Earnings Growth Y-o-Y should be researched further before making an investment.

Their balance sheet will also require an additional review, with $116M of Total Cash (mrq) & $6.21B of Total Debt (mrq).

SUI stock pays a 2.10% dividend, which may not be sustainable in the long-run, with a 107% payout ratio.

Still, 98.5% of SUI stock’s outstanding share float is owned by institutional investors.

Sun Communities, Inc. SUI Stock As A Short-Term Trade Using Options

Short-term oriented traders can trade options to profit from price movements in SUI stock, while hedging against broader market volatility.

I am looking at the contracts with the 8/19 expiration date.

The $160 call options are in-the-money, while the out-of-the-money $165 & $170 strike prices also have open interest.

The $165 puts are also in-the-money, with liquidity in the out-of-the-money $160 & $155 strikes as well.

Tying It All Together

SUI stock has many interesting characteristics that traders & investors are sure to like.

Investors will like their dividend yield (should it remain sustainable) & strong institutional support, but may want to dig deeper into their balance sheet.

Traders will like their recent technical strength amid volatility, but will be disappointed by the liquidity of their options.

Overall, SUI stock is worth taking a closer look at to see how it fits into your portfolio strategy.

*** I DO NOT OWN SHARES OF SUI STOCK AT THE TIME OF PUBLISHING THIS ARTICLE ***

ICF International Inc. ICFI Stock Analysis

ICF International Inc. stock trades under the ticker ICFI & has shown recent bullishness that traders & investors should research further into.

ICFI stock closed at $91.98/share on 7/22/2022.

ICF International Inc. ICFI Stock’s Technical Performance Over The Last Year

ICF International Inc. ICFI Stock's Technical Performance Over The Last Year

ICFI Stock Price: $91.98

10 Day Moving Average: $91.64

50 Day Moving Average: $95.04

200 Day Moving Average: $96.73

RSI: 45.45

MACD: -1.066

On Friday, ICFI stock completed a bullish MACD crossover, settling down slightly, but remaining above its 10 day moving average.

Their recent trading volumes have been average compared to the year prior & their RSI is still neutral/oversold, signaling that there may be more strength to come in the near-term.

They need to break above the $92.40 & $94.99/share resistance levels as they continue climbing higher.

ICF International Inc. ICFI Stock As A Long-Term Investment

Long-term oriented investors will like ICFI stock’s valuation metrics, with a P/E (ttm) of 24.58 & a 2.13 P/B (mrq).

They recently reported 9.2% Quarterly Revenue Growth Y-o-Y, with -2.7% Quarterly Earnings Growth Y-o-Y.

Their balance sheet will require a closer review, with $7.39M of Total Cash (mrq) & $680.7M of Total Debt (mrq).

ICFI stock pays a 0.61% dividend yield, which appears stable in the long-term as their payout ratio is 15.14%.

94.7% of ICFI stock’s outstanding share float is owned by institutional investors.

ICF International Inc. ICFI Stock As A Short-Term Trade Using Options

Short-term oriented traders can use options to hedge against market volatility, while profiting from price movements in any direction.

I am looking at the contracts with the 9/16 expiration date.

They have very limited levels of open interest this far out, but the $90 calls are in-the-money, with liquidity in the out-of-the-money $95 & $100 strikes as well.

The $100 puts are the only strike in-the-money currently, but as time gets closer to expiration there should be more contracts written.

Tying It All Together

ICFI stock has many unique attributes that traders & investors should look closer into.

Investors will like their modest, but safe dividend yield, as well as their valuation metrics, but may want to review their balance sheet structure before investing.

Traders will like their recent technical strength amid market volatility, but will be disappointed by how illiquid their options are.

Overall, it is worth taking a closer look at ICFI stock to see how it fits into your portfolio strategy.

*** I DO NOT OWN SHARES OF ICFI STOCK AT THE TIME OF PUBLISHING THIS ARTICLE ***

Philip Morris International Inc. PM Stock Analysis

Philip Morris International Inc. stock trades under the ticker PM & has shown recent bullishness that traders & investors should research further into.

PM stock closed at $95.93/share on 7/22/2022.

Philip Morris International Inc. PM Stock’s Technical Performance Broken Down

Philip Morris International Inc. PM Stock's Technical Performance Over The Last Year

PM Stock Price: $95.93

10 Day Moving Average: $91.78

50 Day Moving Average: $99.31

200 Day Moving Average: $95.89

RSI: 51.46

MACD: -2.059

On Friday, PM stock completed a bullish MACD crossover, breaking out & settling above its 200 day moving average.

With a neutral RSI & recent trading volumes being about average for the last year, there may be more room to continue climbing in the near-term.

They will need to break above the $98.40 resistance level in order to continue climbing.

Philip Morris International Inc. PM Stock As A Long-Term Investment

Long-term oriented investors will like PM stock’s 16.2 P/E (ttm), but may want to look into why they do not have a positive P/B (mrq).

They recently reported 3.1% Quarterly Revenue Growth Y-o-Y, with 2.8% Quarterly Earnings Growth Y-o-Y.

Their balance sheet will require a closer examination, with $5.04B of Total Cash (mrq) & $28.1B of Total Debt (mrq).

PM stock pays a 5.34% dividend, which may not be sustainable in the long-run, as their payout ratio is 85.6%.

76.3% of PM stock’s outstanding share float is owned by institutional investors.

Philip Morris International Inc. PM Stock As A Short-Term Trade Using Options

Short-term focused traders can use options to hedge against volatility, while also profiting from price movements for PM stock in any direction.

I am looking at the contracts with the 8/19 expiration date.

The $95, $92.50 & $94 call options are all in-the-money, listed from most to least open interest.

The $97.50, $99 & $97 puts are also in-the-money, in order of most to least liquid strike price.

Tying It All Together

PM stock has many interesting characteristics that traders & investors will find appealing.

Investors will like their recent positive growth & their dividend, but may want to look deeper into their balance sheet before investing.

Traders will like their weekly options expirations, as well as their recent momentum.

All-in-all, PM stock is worth taking a closer look into to see how it fits into your portfolio strategy.

*** I DO NOT OWN SHARES OF PM STOCK AT THE TIME OF PUBLISHING THIS ARTICLE ***

RLI Corp. RLI Stock Analysis

RLI Corp. stock trades under the ticker RLI & has shown recent bullishness that traders & investors should research further.

RLI stock closed at $115.81/share on 7/21/2022.

RLI Corp. RLI Stock’s Technical Performance Broken Down

RLI Corp. RLI Stock's Technical Performance Over The Last Year

RLI Stock Price: $115.81

10 Day Moving Average: $113.99

50 Day Moving Average: $115.35

200 Day Moving Average: $109.14

RSI: 54.27

MACD: -0.186

Yesterday, RLI stock completed a bullish MACD crossover, breaking out & settling above both its 10 & 50 day moving averages.

Their RSI is neutral & their recent trading volumes have been above average, signaling that there may be more momentum in the near-term.

They will need to test & break above the $117.56 & $119.48/share resistance levels as they continue to climb higher.

RLI Corp. RLI Stock As A Long-Term Investment

Long-term oriented investors will like RLI stock’s P/E (ttm) of 20.3, but will find their 4.42 P/B (mrq) to be a bit too high.

One possible area of concern is that they recently reported -7.8% Quarterly Revenue Growth Y-o-Y, with -34.4% Quarterly Earnings Growth Y-o-Y.

Their balance sheet will also require a more thorough review, with $72.2M of Total Cash (mrq) & $215.4M of Total Debt (mrq).

RLI stock pays a 0.88% dividend yield, which appears to be very stable in the long-run, with a 17.99% payout ratio.

83% of RLI stock’s outstanding share float is owned by institutional investors.

RLI Corp. RLI Stock As A Short-Term Trade Using Options

Short-term oriented traders can use options to profit from price movements in RLI stock, while hedging against broader market volatility.

I am looking at the contracts with the 8/19 expiration date.

The $115 & $110 call options are in-the-money, with the latter having more open interest than the former.

Currently none of their strike prices are in-the-money for puts, but the $115’s are only ~1% away.

Tying It All Together

RLI stock has many interesting attributes that traders & investors should find appealing.

Investors will like their dividend yield, but may find their balance sheet & recent growth metrics to be troubling & in need of further research.

Traders will like their current technical set up, but may be disappointed by how illiquid their options are.

All-in-all, it is worth taking a closer look at RLI stock to see how it fits into your portfolio strategy.

*** I DO NOT OWN SHARES OF RLI STOCK AT THE TIME OF PUBLISHING THIS ARTICLE ***

Weyco Group, Inc. WEYS Stock Analysis

Weyco Group, Inc. stock trades under the ticker WEYS & has shown recent bullish behavior that traders & investors should take a closer look at.

WEYS stock closed at $25.82/share on 7/21/2022.

Weyco Group, Inc. WEYS Stock’s Technical Performance Broken Down

Weyco Group, Inc. WEYS Stock's Technical Performance Over The Last Year

WEYS Stock Price: $25.82

10 Day Moving Average: $25.49

50 Day Moving Average: $27.71

200 Day Moving Average: $24.49

RSI: 46.44

MACD: -0.588

Yesterday, WEYS stock completed a bullish MACD crossover, while remaining over its 10 day moving average.

Their recent trading volumes have been about average compared to the year prior, and their RSI is still neutral, signaling that there may be some more strength left in the near-term.

They will need to break above the $26.02 & $26.52/share resistance levels as they continue to climb higher.

Weyco Group, Inc. WEYS Stock As A Long-Term Investment

Long-term oriented investors will like WEYS stock’s valuation metrics, with a 10.41 P/E (ttm) & a 1.19 P/B (mrq).

They recently reported 73.5% Quarterly Revenue Growth Y-o-Y, with 205.9% Quarterly Earnings Growth Y-o-Y.

Their balance sheet appears healthy, with $24.98M of Total Cash (mrq) & $10.34M of Total Debt (mrq).

WEYS stock pays a 3.74% dividend yield, which appears stable in the long-run, with a 40% payout ratio.

19.8% of WEYS stock’s outstanding share float is owned by institutional investors.

Weyco Group, Inc. WEYS Stock As A Short-Term Trade Using Options

Unfortunately, WEYS stock does not have options for traders to trade.

However, traders can use ETFs such as DES, the Wisdom Tree Small Cap Dividend Fund’s options as a means of getting some down-side protection for WEYS stock.

Tying It All Together

Overall, WEYS stock has many interesting characteristics that investors are sure to like.

Their valuation metrics & balance sheet both look healthy.

Their dividend yield is also nice & appears to be stable in the long-run based on their payout ratio.

While they do not have options to trade, ETFs can be leveraged to get downside protection for long-shares of WEYS stock.

It is worth researching WEYS stock more to see how it fits your portfolio strategy.

*** I DO NOT OWN SHARES OF WEYS STOCK AT THE TIME OF PUBLISHING THIS ARTICLE ***

General Dynamics Corp. GD Stock Analysis

General Dynamics Corp. stock trades under the ticker GD & has shown recent bullishness that traders & investors should take a closer look at.

GD stock closed at $216.89/share on 7/21/2022.

General Dynamics Corp. GD Stock’s Technical Performance Broken Down

General Dynamics Corp. GD Stock's Technical Performance Over The Last Year

GD Stock Price: $216.89

10 Day Moving Average: $215.22

50 Day Moving Average: $220.02

200 Day Moving Average: $215.70

RSI: 48.93

MACD: -1.837

Yesterday, GD stock completed a bullish MACD crossover, settling just above its 10 & 200 day moving averages at the close.

With a neutral RSI & trading volumes below average, there may be some weakness on the horizon for GD in the near-term, presenting an opportunity for a better entry price.

They will need to break above the $218.17/share price level, before going on to test the $221.92/share level.

General Dynamics Corp. GD Stock As A Long-Term Investment

Long-term oriented investors will like GD stock’s 18.22 P/E (ttm), but may find their 3.28 P/B (mrq) to be a bit rich.

They recently reported 0% Quarterly Revenue Growth Y-o-Y, with 3.1% Quarterly Earnings Growth Y-o-Y.

Their balance sheet may warrant a closer review, with $2.91B of Total Cash (mrq) & $13.17B of Total Debt (mrq).

GD stock pays a 2.23% dividend yield, which appears stable in the long-run, as their payout ratio is 51.5%.

86.5% of GD stock’s outstanding share float is owned by institutional investors.

General Dynamics Corp. GD Stock As A Short-Term Trade Using Options

Short-term oriented traders can use options to hedge against market volatility, while profiting from price movements in GD stock.

I am looking at the contracts with the 8/19 expiration date.

The $210, $215 & $207.50 calls are all in-the-money, listed from most to least liquid.

Currently, only the $220 puts are in-the-money, but since GD has weekly expirations, I expect there to be more contracts written as the weeks pass.

Tying It All Together

GD stock has many characteristics that traders & investors are sure to find appealing.

Investors will like their dividend yield, but may want to research into their balance sheet a bit more before investing.

Traders will like their current technicals, as well as their weekly option expirations.

Overall, GD stock is worth taking a closer look into to see how it fits into your portfolio strategy.

*** I DO NOT OWN SHARES OF GD STOCK AT THE TIME OF PUBLISHING THIS ARTICLE ***