Safety Insurance Group, Inc. SAFT Stock Analysis

Safety Insurance Group, Inc. stock trades under the ticker SAFT & has shown recent bullishness that traders & investors should take a closer look into.

SAFT stock closed at $91.58/share on 8/9/2022.

Safety Insurance Group, Inc. SAFT Stock’s Technical Performance Broken Down

Safety Insurance Group, Inc. SAFT Stock's Technical Performance Over The Last Year

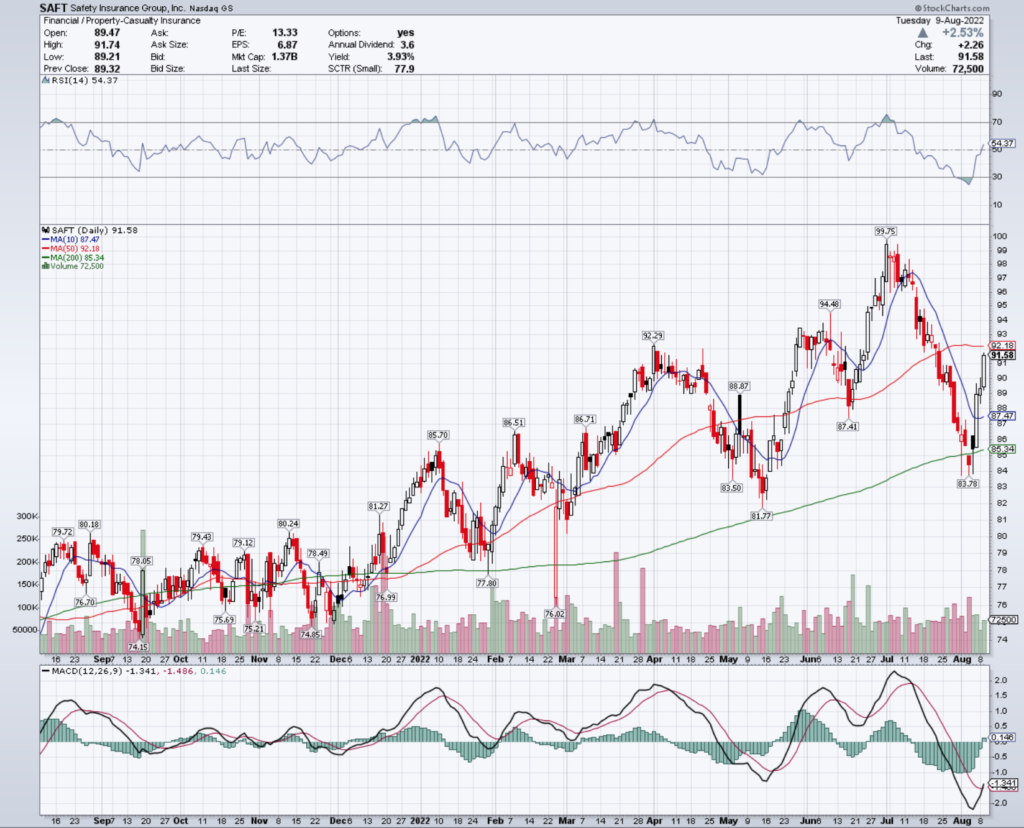
SAFT Stock Price: $91.58

10 Day Moving Average: $87.47

50 Day Moving Average: $92.18

200 Day Moving Average: $85.34

MACD: -1.341

RSI: 54.37

Yesterday, SAFT stock completed a bullish MACD crossover, notching its third consecutive day of gains.

Recent trading volumes have been about average compared to the year prior, and their RSI is neutral, signaling that there may be more bullish momentum to come in the near-term.

They have support at the $88.87 & $87.41/share price levels, as they try to break above the $92.29 & $94.48 resistance levels.

Safety Insurance Group, Inc. SAFT Stock As A Long-Term Investment

Long-term oriented investors will like SAFT stock’s valuation metrics, with a 17.32 P/E (ttm) & a 1.54 P/B (mrq).

They recently reported -17.6% Quarterly Revenue Growth Y-o-Y, with -79% Quarterly Earnings Growth Y-o-Y, which should alarm investors.

Their balance sheet looks decent, with $39M of Total Cash (mrq) & $55.35M of Total Debt (mrq).

SAFT stock pays a 4.03% dividend yield, which may not be sustainable in the long-run, as their payout ratio is 73%.

Still, 87% of SAFT stock’s outstanding share float is owned by institutional investors.

Safety Insurance Group, Inc. SAFT Stock As A Short-Term Trade Using Options

Traders focused on the near-term can trade options to profit from SAFT stock’s price movements, while hedging against market volatility.

I am looking at the contracts with the 8/19 expiration date.

The $90, $85 & $80 call options are all in-the-money, with the former being more liquid than the latter two strike prices.

The $95 & $105 puts are also in-the-money, listed in order of highest to lowest open interest levels.

Tying It All Together

SAFT stock has many interesting attributes that can benefit your portfolio.

Investors will like their valuation metrics & balance sheet, but may want to look into their recent growth troubles & the long-term sustainability of their dividend yield.

Traders will like their current technical set up, but may be disappointed by how illiquid their options are.

Overall, it is worth taking a closer look at SAFT stock to see how it fits into your portfolio strategy.

*** I DO NOT OWN SHARES OF SAFT STOCK AT THE TIME OF PUBLISHING THIS ARTICLE ***

CME Group Inc. CME Stock Analysis

CME Group Inc. stock trades under the ticker CME & has shown recent bullish behavior that traders & investors should research further into.

CME stock closed at $201.46/share on 8/8/2022.

CME Group Inc. CME Stock’s Technical Performance Broken Down

CME Group Inc. CME Stock's Technical Performance Over The Last Year

CME Stock Price: $201.46

10 Day Moving Average: $199.34

50 Day Moving Average: $202.38

200 Day Moving Average: $218.68

MACD: -1.138

RSI: 49.49

Yesterday, CME completed a bullish MACD crossover, despite closing down slightly from its 50 day moving average after two days of growth.

Their recent trading volumes have been lighter than average, and their RSI is still neutral, signaling that there is uncertainty regarding CME stock’s value in the near-term.

They have support at the $199.53 & $199.34/share price levels, while they attempt to break out above the $206.11 & $211.19 resistance levels.

CME Group Inc. CME Stock As A Long-Term Investment

Long-term oriented investors will like CME stock’s valuation metrics, with a 24.56 P/E (ttm) & 2.54 P/B (mrq).

They recently reported 4.9% Quarterly Revenue Growth Y-o-Y, with 29.8% Quarterly Earnings Growth Y-0-Y.

Their balance sheet will require a closer examination, with $1.97B of Total Cash (mrq) & $3.97B of Total Debt (mrq).

CME stock pays a 1.88% dividend yield, which appears sustainable in the long-term, with a 47.2% payout ratio.

89.1% of CME stock’s outstanding share float is owned by institutional investors.

CME Group Inc. CME Stock As A Short-Term Trade Using Options

Short-term focused traders can use options to profit from CME stock’s price movements in any direction, while hedging against broader market volatility.

I am looking at the contracts with the 8/19 expiration date.

The $200, $190 & $197.50 call options are all in-the-money, with the former having more open interest than the latter two strike price.

The $210, $205 & $202.50 puts are also in-the-money, listed from highest to lowest levels of open interest.

Tying It All Together

CME stock has many interesting characteristics that can be used to add value to a portfolio.

Investors will like their valuation metrics & dividend yield, but may want to research their balance sheet further before investing.

Traders will like their current momentum, as well as the liquidity of their options & weekly expiration dates.

All-in-all, it is worth taking a closer look into CME stock to see how it fits into your portfolio strategy.

*** I DO NOT OWN SHARES OF CME STOCK AT THE TIME OF PUBLISHING THIS ARTICLE ***

Allstate Corp. ALL Stock Analysis

Allstate Corp. stock trades under the ticker ALL & has shown recent bullishness that traders & investors should research further into.

ALL stock closed at $118.29/share on 8/9/2022.

Allstate Corp. ALL Stock’s Technical Performance Broken Down

Allstate Corp. ALL Stock's Technical Performance Over The Last Year

ALL Stock Price: $118.29

10 Day Moving Average: $116.09

50 Day Moving Average: $124.25

200 Day Moving Average: $123.19

RSI: 46.17

MACD: -2.527

Yesterday, ALL stock completed a bullish MACD crossover, gapping up 1.1%.

Their recent trading volumes are about average for the year prior & their RSI is still neutral, signaling that there may be more momentum to come as they begin to establish a new range.

They have support at the $117.64 & $116.38/share price level, as they try to break above the $119.61 & $119.81 resistance levels.

Allstate Corp. ALL Stock As A Long-Term Investment

Long-term oriented investors will like ALL stock’s valuation metrics, with a 10.05 P/E (ttm) & a 1.33 P/B (mrq).

They recently reported -3.4% Quarterly Revenue Growth Y-o-Y.

Their balance sheet reports $5.15B of Total Cash (mrq), with $8.01B of Total Debt (mrq).

ALL stock pays a 2.84% dividend yield, which may not be sustainable in the long-run, as their payout ratio is -25%.

Still, 79.9% of their outstanding share float is owned by institutional investors.

Allstate Corp. ALL Stock As A Short-Term Trade Using Options

Short-term focused traders can use options to hedge against market volatility, while profiting from price movements in any direction.

I am looking at the contracts with the 8/19 expiration date.

The $115, $110 & $100 call options are all in-the-money, listed from highest to lowest levels of open interest.

The $120, $125 & $130 puts are also in-the-money, with the former being more liquid than the latter two.

Tying It All Together

ALL stock offers many unique characteristics to their shareholders’ portfolios.

Investors will like their valuation metrics & balance sheet, but may want to research the sustainability of their dividend further before investing.

Traders will like their current technical set up, and the liquidity of their options.

All-in-all, it is worth taking a closer look into ALL stock to see how it fits into your portfolio strategy.

*** I DO NOT OWN SHARES OF ALL STOCK AT THE TIME OF PUBLISHING THIS ARTICLE ***

Western Gas Partners, L.P. WES Stock Analysis

Western Gas Partners, L.P. stock trades under the ticker WES & has shown recent bullishness that traders & investors should take a closer look into.

WES stock closed at $26.31/share on Friday, 8/5/2022.

Western Gas Partners, L.P. WES Stock’s Technical Performance Broken Down

Western Gas Partners, L.P. WES Stock's Technical Performance Over The Last Year

WES Stock Price: $26.31

10 Day Moving Average: $26.85

50 Day Moving Average: $25.97

200 Day Moving Average: $23.79

MACD: 0.378

RSI: 51.12

On Friday, WES stock completed a bearish MACD crossover, after recovering 2.37% the day following a gap down day.

Like many other stocks at this time, they are trading on below average volume recently compared to the year prior, and have a neutral RSI, signaling that there is not a lot of conviction behind their price.

Their prices have been relatively concentrated over the last 6 months, with support at the $25.60 & $25.54/share price levels, as they try to break out above the $26.42 & $26.54/share resistance levels.

Western Gas Partners, L.P. WES Stock As A Long-Term Investment

Long-term oriented investors will like WES stock’s 10.32 P/E (ttm), but may find their 3.31 P/B (mrq) to be a bit rich.

They recently reported 21.9% Quarterly Revenue Growth Y-o-Y, with 32.4% Quarterly Earnings Growth Y-o-Y.

Their balance sheet should be reviewed more carefully before making an investment, with $97.43M of Total Cash (mrq) & $6.66B of Toal Debt (mrq).

WES stock pays a 6.27% dividend yield, which should be sustainable in the long-run, with a 54.8% payout ratio.

87% of WES stock’s outstanding share float is owned by institutional investors.

Western Gas Partners, L.P. WES Stock As A Short-Term Trade Using Options

WES stock has options that short-term oriented traders can use to profit from their price movements, while protecting their holdings against volatility.

I am looking at the contracts with the 8/19 expiration date.

The $25, $26 & $22 call options are all in-the-money, listed from most to least liquid strike price.

The $28, $27 & $29 puts are also in-the-money, with the former having the most open interest & the latter having the least.

Tying It All Together

WES stock has many interesting characteristics that traders & investors should research further into.

Investors will like their dividend yield, as well as their recent growth.

Traders will like the liquidity of their options, as well as their recent technical resilience amidst volatility.

All-in-all, it is worth taking a closer look into WES stock to see how it fits into your portfolio strategy.

*** I DO NOT OWN SHARES OF WES STOCK AT THE TIME OF PUBLISHING THIS ARTICLE ***

Weber Inc. WEBR Stock Analysis

Weber Inc. stock trades under the ticker WEBR & has shown recent bullishness after suffering a difficult end to July that I have used to begin a new position at a better price.

WEBR stock closed at $7.48/share on 8/5/2022.

Weber Inc. WEBR Stock’s Technical Performance Broken Down

Weber Inc. WEBR Stock's Technical Performance Over The Last Year

WEBR Stock Price: $7.48

10 Day Moving Average: $6.60

50 Day Moving Average: $7.59

200 Day Moving Average: $10.43

MACD: -0.279

RSI: 53.13

On Friday, WEBR stock completed a bullish MACD crossover, notching a fourth consecutive day of gains & settling just beneath its 200 day moving average.

Their recent trading volumes have been below average for the year & their RSI is neutral, signaling that there is still uncertainty about their proper price level in the market.

WEBR has support at $6.94 & $6.83, as they try to break above the $7.59 & $7.71/share resistance levels.

Weber Inc. WEBR Stock As A Long-Term Investment

Long-term oriented investors are more likely avid users of the product than deep value seekers, as WEBR stock’s valuation metrics are not as strong as those that we typically publish about on this site.

They recently reported -7.2% Quarterly Revenue Growth Y-o-Y.

Their balance sheet leaves a lot to be desired, with $53.6M of Total Cash (mrq) & $1.4B of Total Debt (mrq).

WEBR stock pays a 2.03% dividend yield, but investors should research further into its sustainability before making an investment.

68.5% of WEBR stock’s outstanding share float is owned by institutional investors.

Weber Inc. WEBR Stock As A Short-Term Trade Using Options

Short-term focused traders can trade options to profit from WEBR stock’s price movements in any direction, while also hedging against broader market volatility.

I am looking at the contracts with the 8/19 expiration date.

The $7.50, $5 & $2.5 call options are all in-the-money, listed from highest to lowest levels of open interest.

The $10, $20 & $15 puts are also all in-the-money, with the former being more liquid than the latter strike prices.

Tying It All Together

WEBR stock is a company that I have a soft-spot for, as I own & frequently use many of their products (they also make great gifts, but that’s another story for another time).

Investors will likely not be interested in their name from a value perspective, but there could be a growth story there in the mid-to-long term, as many people flocked to buy patio & outdoor goods at the onset of COVID.

Traders will like the liquidity of their options, as well as their current technical set up.

Overall, it is worth taking a closer look into WEBR stock to see how it fits into your portfolio strategy.

*** I DO HAVE A LONG-POSITION IN WEBR STOCK AT THE TIME OF PUBLISHING THIS ARTICLE ***

Juniper Networks JNPR Stock Analysis

Juniper Networks stock trades under the ticker JNPR & has shown recent bullishness that traders & investors should look closer into.

JNPR stock closed at $28.21/share on 8/3/2022.

Juniper Networks JNPR Stock’s Technical Performance Broken Down

Juniper Networks JNPR Stock's Technical Performance Over The Last Year

JNPR Stock Price: $28.21

10 Day Moving Average: $28.20

50 Day Moving Average: $28.89

200 Day Moving Average: $31.84

RSI: 47.5

MACD: -0.261

Yesterday, JNPR stock completed a bullish MACD crossover, closing just above its 10 day moving average.

Recent trading volumes have been about average compared to the yea prior, and their RSI is still neutral, signaling short-term uncertainty in their price while the market figures out their fair value.

They have support at the $27.79 & $27.33 price levels, while they try to break above the $28.95 & $29.37 resistance levels.

Juniper Networks JNPR Stock As A Long-Term Investment

Long-term oriented investors will like JNPR stock’s valuation metrics, with a P/E (ttm) of 23.48 & a 2.1 P/B (mrq).

They recently reported 8.3% Quarterly Revenue Growth Y-o-Y, with 82.9% Quarterly Earnings Growth Y-o-Y.

Their balance sheet also looks good, with $1.02B of Total Cash (mrq) & $1.81B of Total Debt (mrq).

JNPR stock pays a 2.96% dividend yield, which may not be sustainable in the long-run, as their payout ratio is 69.5%.

96.4% of JNPR stock’s outstanding share float is owned by institutional investors.

Juniper Networks JNPR Stock As A Short-Term Trade Using Options

Short-term focused traders can trade options to profit from price movements in any direction for JNPR stock, while protecting themselves from broader market volatility.

I am looking at the contracts with the 8/19 expiration date.

The $28, $27, $26 & $24 call options are all in-the-money, listed from highest to lowest levels of open interest.

The $29, $30 & $31 puts are also in-the-money, with the former being more liquid than the latter.

JNPR stock has weekly options expirations, so there may be more contracts written as other weekly expiration dates pass.

Tying It All Together

JNPR stock has many interesting elements that traders & investors are sure to like.

Investors will like their valuation metrics, balance sheet & dividend yield, but should dig in deeper to see how sustainable their dividend is in the long-run.

Traders will like their weekly option expirations & current technical performance amidst market volatilty.

All-in-all, it is worth taking a closer look into JNPR stock to see how it fits into your portfolio strategy.

*** I DO NOT OWN SHARES OF JNPR STOCK AT THE TIME OF PUBLISHING THIS ARTICLE ***

InterDigital Inc. IDCC Stock Analysis

InterDigital Inc. stock trades under the ticker IDCC & has shown recent bullish behavior amid a volatile market.

IDCC stock closed at $61.29/share on 8/3/2022.

InterDigital Inc. IDCC Stock’s Technical Performance Broken Down

InterDigital Inc. IDCC Stock's Technical Performance Over The Last Year

IDCC Stock Price: $61.29

10 Day Moving Average: $61.09

50 Day Moving Average: $62.15

200 Day Moving Average: $64.60

RSI: 49.7

MACD: -0.276

Yesterday, IDCC completed a bullish MACD crossover, closing just above their 10 day moving average.

Recent volumes have been light & their RSI is neutral, signaling that there is uncertainty around the price of IDCC in the markets.

They have support at $61.24 & $61.02, while they try to break above the $62.15 & $63.16/share resistance levels.

InterDigital Inc. IDCC Stock As A Long-Term Investment

Long-term oriented investors will like IDCC stock’s valuation metrics, with a 28.29 P/E (ttm) & a 2.51 P/B (mrq).

They recently reported 23% Quarterly Revenue Growth Y-o-Y, with 223% Quarterly Earnings Growth Y-o-Y.

Their balance sheet also looks appealing, with $899.22M of Total Cash (mrq) & $424.1M of Total Debt (mrq).

IDCC stock pays a 2.28% dividend yield, which may be sustainable in the long-term, despite their 64.5% payout ratio.

84.6% of IDCC stock’s outstanding share float is owned by institutional investors.

InterDigital Inc. IDCC Stock As A Short-Term Trade Using Options

Short-term focused traders can use options to hedge against the volatile market environment, while profiting from movements in either direction for IDCC stock.

I am looking at the contracts with the 8/19 expiration date.

The $60, $57.50 & $55 call options are all in-the-money, listed from most to least liquid.

There are currently no puts in-the-money, but there is open interest at the $57.50, $60 & $55 strike prices should the stock fall.

Tying It All Together

IDCC stock has many interesting attributes that traders & investors are sure to like.

Investors will like their valuation metrics & balance sheet health, but may want to research further on their dividend’d sustainability in the mid-to-long term.

Traders will like their recent resilience in a volatile market period, but may be disappointed by how illiquid their options are.

Overall, it is worth researching how IDCC stock fits into your portfolio strategy.

*** I DO NOT OWN SHARES OF IDCC STOCK AT THE TIME OF PUBLISHING THIS ARTICLE ***

Hasbro, Inc. HAS Stock Analysis

Hasbro, Inc. stock trades under the ticker HAS & has shown recent bullishness that traders & investors should research further into.

HAS stock closed at $79.48/share on 8/1/2022.

Hasbro, Inc. HAS Stock’s Technical Performance Broken Down

Hasbro, Inc. HAS Stock's Technical Performance Over The Last Year

HAS Stock Price: $79.48

10 Day Moving Average: $79.43

50 Day Moving Average: $82.48

200 Day Moving Average: $89.56

RSI: 46.61

MACD: -1.127

Yesterday, HAS stock completed a bullish MACD crossover, break out & settling just above its 10 day moving average.

Their RSI is neutral, and recent trading volumes have been above average compared to the year prior, signaling that there may be more momentum to come in the near-term.

They have support at the $78.70/share level, while they try to break above the $79.82 & $80.01 resistance levels.

Hasbro, Inc. HAS Stock As A Long-Term Investment

Long-term oriented investors will like HAS stock’s 20.48 P/E (ttm), but they may find their 3.68 P/B (mrq) to be a bit rich.

They recently reported 1.3% Quarterly Revenue Growth Y-o-Y.

Their balance sheet will need a more thorough review, with $586.3M of Total Cash (mrq) & $4.21B of Total Debt (mrq).

HAS stock pays a 3.51% dividend yield, which may be unsustainable in the long-run, as their payout ratio is 70.6%.

86.64% of HAS stock’s outstanding share float is owned by institutional investors.

Hasbro, Inc. HAS Stock As A Short-Term Trade Using Options

Short-term focused traders can trade options to profit from movements in HAS stock’s price in any direction, while hedging against broader market volatility.

I am looking at the contracts with the 8/19 expiration date.

The $77.50, $75 & $72.50 call options all are in-the-money, listed from highest to lowest levels of open interest.

The $80, $85 & $82.50 puts are also all in-the-money, with that former being more liquid than the latter two.

Tying It All Together

HAS stock has many interesting characteristics that traders & investors will like.

Investors will like their P/E (ttm) & dividend yield, but may want to review their balance sheet more thoroughly before investing to see how sustainable the yield will be in the long term.

Traders will like their current technical set up, but may be disappointed by how liquid their options are.

All-in-all, it is worth taking a closer look at HAS stock to see how it fits into your portfolio strategy.

*** I DO NOT OWN SHARES OF HAS STOCK AT THE TIME OF PUBLISHING THIS ARTICLE ***

Alphabet Inc. GOOGL Stock Analysis

Alphabet Inc. stock trades under the ticker GOOGL & has shown recent bullish behavior amid market volatility that traders & investors should research further into.

GOOGL stock closed at $116.32/share on 7/29/2022.

Alphabet Inc. GOOGL Stock’s Technical Performance Broken Down

Alphabet Inc. GOOGL Stock's Technical Performance Over The Last Year

GOOGL Stock Price: $116.32

10 Day Moving Average: $111.51

50 Day Moving Average: $112.05

200 Day Moving Average: $130.47

RSI: 55.83

MACD: -0.181

On Friday, GOOGL stock completed a bullish MACD crossover, notching its third consecutive day of gains.

Their RSI is still neutral, and their recent trading volumes have been above average compared to the year prior, signaling that there may still be more near-term momentum.

They will need to remain above the $$115.40 support level, while they try to break above the $117.88 resistance level.

Alphabet Inc. GOOGL Stock As A Long-Term Investment

Long-term oriented investors will like GOOGL stock’s P/E (ttm) of 21.27, but may find their 5.83 P/B (mrq) to be a bit too high.

They recently reported 12.6% Quarterly Revenue Growth Y-o-Y, with -13.6% Quarterly Earnings Growth Y-o-Y.

Their balance sheet will delight investors, with $125B of Total Cash (mrq) & only $28.81B of Total Debt (mrq).

Unfortunately, GOOGL stock does not pay a dividend.

Regardless, 79.33% of GOOGL stock’s outstanding share float is owned by institutional investors.

Alphabet Inc. GOOGL Stock As A Short-Term Trade Using Options

Short-term focused traders can use options to protect themselves from market volatility, while also profiting from price movements in any direction for GOOGL stock.

I am looking at the contracts with the 8/19 expiration date.

The $115, $116 & $114 call options are all in-the-money, listed from most to least liquid strike price.

The $116.50, $117.50 & $117 puts are also all in-the-money, with the former having the highest level of open interest.

Tying It All Together

GOOGL stock offers investors many interesting opportunities for growth, while still maintaining some value characteristics.

Investors will like their valuation metrics & balance sheet, but will be disappointed by their lack of dividend.

However, should they instate a dividend that may signal that there is headwinds on the horizon or that they are not as confident in the ability to continue growing.

Traders will like their current technical set up, as well as the liquidity of their options.

All-in-all, GOOGL stock is worth taking a closer look into to see how it fits into your portfolio strategy.

*** I DO NOT OWN SHARES OF GOOGL STOCK AT THE TIME OF PUBLISHING THIS ARTICLE ***

Northrop Grumman Corp. NOC Stock Analysis

Northrop Grumman Corp. stock trades under the ticker NOC & has shown recent bullishness that traders & investors should research further into.

NOC stock closed at $478.90/share on 7/29/2022.

Northrop Grumman Corp. NOC Stock’s Technical Performance Broken Down

Northrop Grumman Corp. NOC Stock's Technical Performance Over The Last Year

NOC Stock Price: $478.90

10 Day Moving Average: $454.55

50 Day Moving Average: $463.21

200 Day Moving Average: $418.59

RSI: 59.73

MACD: -2.007

On Friday, NOC stock gapped up 5.38%, closing above its 50 day moving average & completing a bullish MACD crossover.

Their RSI is on the overbought end of neutral, and recent trading volumes have been about average compared to the year prior, signaling that there may be momentum to come in th enear-term.

They will need to remain above the $475.49 support level as they try to break above the $487.89 resistance level.

Northrop Grumman Corp. NOC Stock As A Long-Term Investment

Long-term oriented investors will like NOC stock’s P/E (ttm) of 12.55, but will find their 5.32 P/B (mrq) to be a bit rich.

They recently reported -3.8% Quarterly Revenue Growth Y-o-Y, with -8.8% Quarterly Earnings Growth Y-o-Y.

Their balance sheet will require some additional research before making an investment, with $1.17B of Total Cash (mrq) & $14.49B of Total Debt (mrq).

NOC stock pays a 1.36% dividend yield, which appears to be stable in the long-term, as their payout ratio is 17.98%.

84.2% of NOC stock’s outstanding share float is owned by institutional investors.

Northrop Grumman Corp. NOC Stock As A Short-Term Trade Using Options

Short-term oriented traders can use options to hedge against market volatility, while profiting from movements in NOC stock in any direciton.

I am looking at the contracts with the 8/19 expiration date.

The $470, $475 & $472.50 call options are all in-the-money, listed from highest to lowest level of open interest.

The $480, $485 & $490 puts are also in-the-money, in order of most to least liquid.

Tying It All Together

NOC stock offers many interesting opportunities to traders & investors alike.

Investors will like NOC stock’s safe dividend yield, but may want to research their balance sheet more before making an investment.

Traders will like their recent technical performance, as well as how liquid their options are.

Overall, NOC stock is worth taking a closer look into to see how it fits into your portfolio strategy.

*** I DO NOT OWN SHARES OF NOC STOCK AT THE TIME OF PUBLISHING THIS ARTICLE ***