John Bean Technologies Corp. stock trades under the ticker JBT & has shown recent bullishness that traders & investors should research further into for when market volatility has calmed down.
JBT stock closed at $104.76/share on 5/22/2023.
John Bean Technologies Corp. JBT Stock’s Technical Performance Broken Down
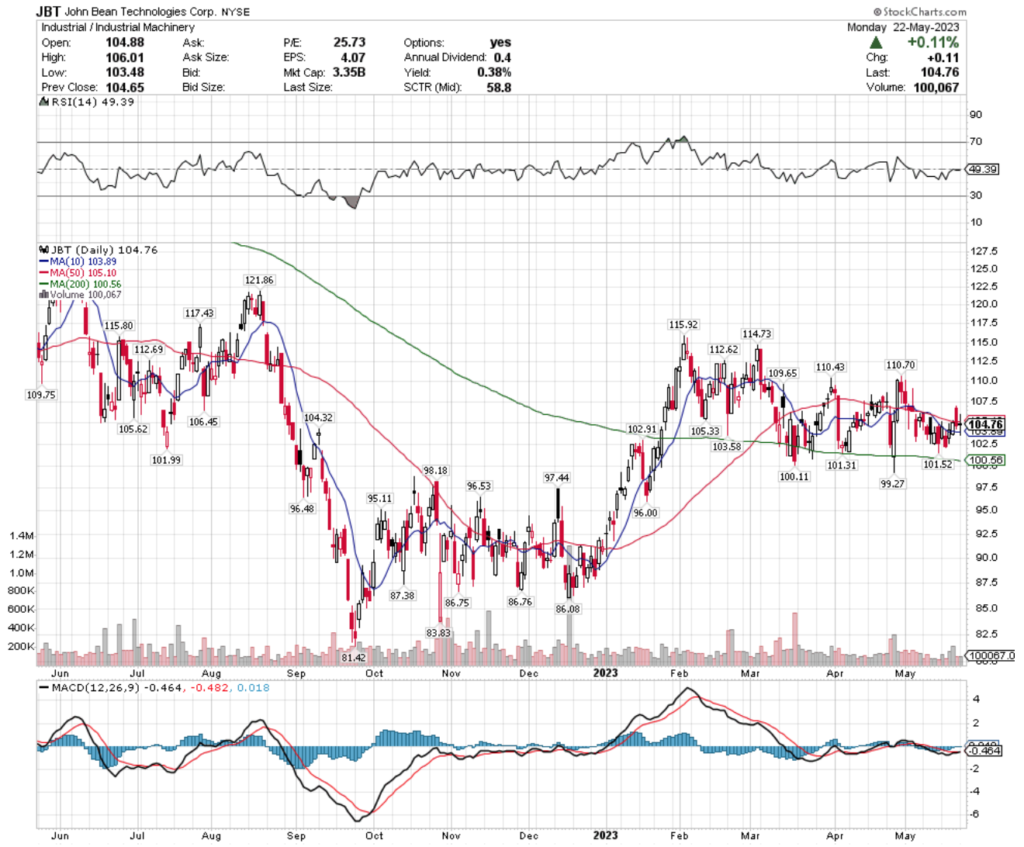
JBT Stock Price: $104.76
10 Day Moving Average: $103.89
50 Day Moving Average: $105.10
200 Day Moving Average: $100.56
RSI: 49.39
MACD: -0.464, -0.482, 0.018
Yesterday, JBT stock completed a bullish MACD crossover, gaining+0.11% on the day’s session.
Their RSI is neutral at 49 & recent trading volumes have been below average compared to the year prior, indicating that investors are uncertain about where they value JBT’s shares currently.
Investors would be wise to watch how they behave at support levels in the coming weeks, in order to figure out what price level to enter at once market volatility has subsided a bit.
JBT stock has support at the $104.32, $103.89 (10 day moving average), $103.58 & $101.99/share price levels, with resistance at the $105.10 (50 day moving average), $105.33, $105.62 & $106.45/share price levels.
John Bean Technologies Corp. JBT Stock As A Long-Term Investment
Long-term oriented investors will like JBT stock’s 25.18 P/E (ttm), but may find their 3.78 P/B (mrq) to be a bit too rich.
They recently reported 12.9% Quarterly Revenue Growth.
Their balance sheet will require a more thorough review, with $45.7M of Total Cash (mrq) & $957.3M of Total Debt (mrq).
JBT stock pays a modest 0.38% dividend, which appears to be sustainable in the long-run, as their payout ratio is 9.83%.
99.34% of JBT stock’s outstanding share float is owned by institutional investors.
John Bean Technologies Corp. JBT Stock As A Short-Term Trade Using Options
Traders who has shorter time horizons can trade options to profit from JBT stock’s price movements, while protecting their portfolios from volatility.
Their options are pretty illiquid, with no in-the-money strike prices for calls in the coming expiration dates, but there are contracts at the $115 calls dated for 6/16, as well as $115, $110, $120 & $125 strikes for the 7/21 expiration date (in order of highest to lowest level of open interest)
The $110 puts with the 7/21 expiration date are in-the-money.
Tying It All Together
JBT stock has many interesting characteristics that traders & investors will find appealing.
Investors will like their P/E (ttm) & sustainable, yet modest dividend.
Traders will like their recent technical performance, but will be disappointed by how illiquid their options are.
Overall, it is worth taking a closer look to see how JBT stock fits into your portfolio strategy.
*** I DO NOT OWN SHARES OR OPTIONS CONTRACT POSITIONS IN JBT STOCK AT THE TIME OF PUBLISHING THIS ARTICLE ***