La Z Boy LZB Stock Analysis

La Z Boy stock trades under the ticker LZB & has shown recent bullishness that traders & investors should research further into to plan an entry once markets have become less volatile.

LZB stock closed at $28.85/share on 4/19/2023.

La Z Boy LZB Stock’s Technical Performance Broken Down

La Z Boy LZB Stock's Technical Performance Over The Past Year
La Z Boy LZB Stock’s Technical Performance Over The Past Year

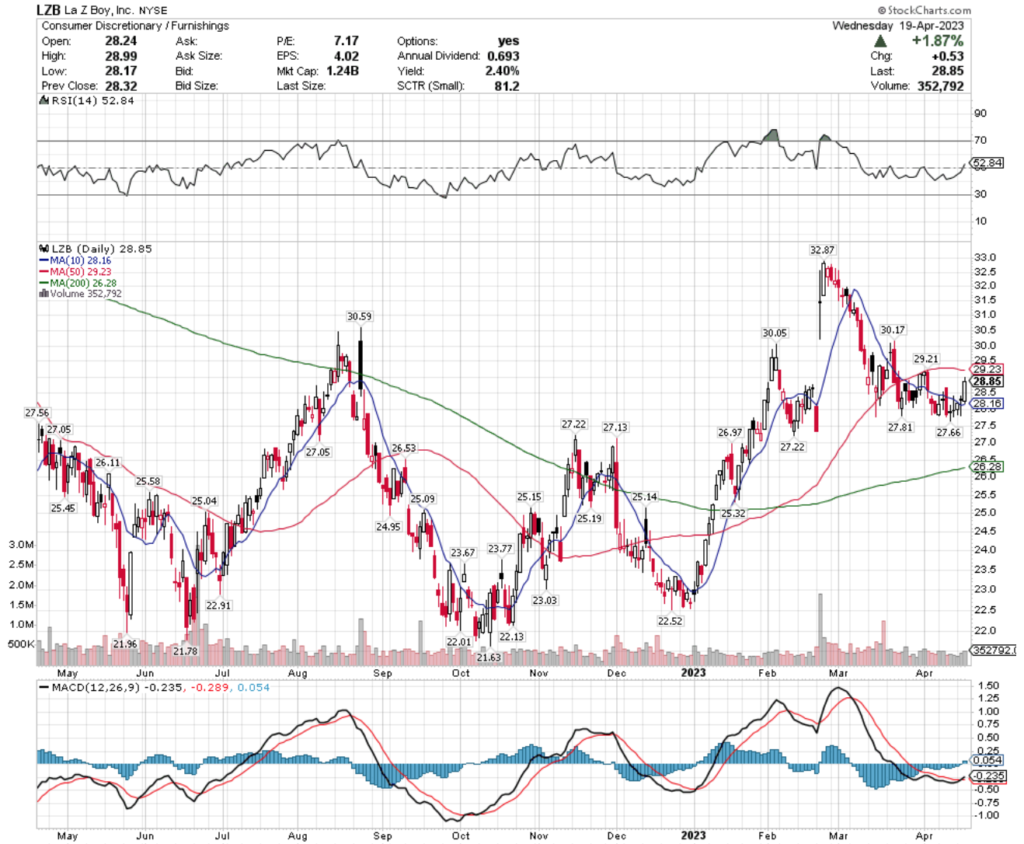
LZB Stock Price: $28.85

10 Day Moving Average: $28.16

50 Day Moving Average: $29.23

200 Day Moving Average: $26.28

RSI: 52.84

MACD: -0.235

Yesterday, LZB stock completed a bullish MACD crossover, gaining +1.87% on they day’s session.

Recent trading volumes have been slightly below average, signaling that investors are not certain as to how to price LZB shares currently, amid a turbulent macro environment.

Their RSI is neutral & traders & investors should be watching how they behave at their support & resistance levels in the coming weeks to identify when an opportune entry time may be after volatility cools off.

LZB stock has support at the $28.16 (10 day moving average), $27.81, $27.66 & $27.56, with resistance overhead at $29.21, $29.23 (50 day moving average), $30.05 & $30.17/share price levels.

La Z Boy LZB Stock As A Long-Term Investment

Long-term oriented investors will like LZB stock’s valuation metrics, with a 7.04 P/E (ttm) & a 1.35 P/B (mrq).

They recently reported 0.2% Quarterly Revenue Growth Y-o-Y, with 11.4% Quarterly Earnings Growth Y-o-Y.

Their balance sheet will require a more thorough review, with $293.08M of Total Cash (mrq) & $427.29M of Total Debt (mrq).

LZB stock pays a 2.39% dividend, which appears to be sustainable in the long-run, as their payout ratio is 16.83%.

97.2% of LZB stock’s outstanding share float is owned by institutional investors.

La Z Boy LZB Stock As A Short-Term Trade Using Options

Traders with shorter time horizons can trade options to profit from movements in LZB stock’s price, while protecting their portfolios from volatility.

I am looking at the contracts with the 5/19 expiration date.

The $25 are the only strike that is currently in-the-money, with open interest at the $30 & $35 strike prices as well.

The $30 & $40 puts are also in-the-money, with the former being more liquid than the latter.

Tying It All Together

LZB stock has many unique characteristics that traders & investors will find appealing.

Investors will like their dividend yield & valuation metrics, but may want to review their balance sheet structure in more detail before investing.

Traders will like their recent technical performance, but may be disappointed in how illiquid their options are.

All-in-all, LZB stock is worth taking a closer look into to see how it fits into your portfolio strategy once market volatility has subsided.

*** I DO NOT OWN SHARES OR CONTRACTS POSITIONS IN LZB STOCK AT THE TIME OF PUBLISHING THIS ARTICLE ***

Toro Co. TTC Stock Analysis

Toro Co. stock trades under the ticker TTC & has shown recent bullishness that traders & investors should research further into in order to plan a position in less volatile market conditions.

TTC stock closed at $105.87/share on 4/18/2023.

Toro Co. TTC Stock’s Technical Performance Broken Down

Toro Co. TTC Stock's Technical Performance Over The Past Year
Toro Co. TTC Stock’s Technical Performance Over The Past Year

TTC Stock Price: $105.87

10 Day Moving Average: $103.93

50 Day Moving Average: $109.06

200 Day Moving Average: $100.44

RSI: 47.16

MACD: -1.366

Yesterday, TTC stock completed a bullish MACD crossover, gaining +0.47% on the day’s session.

Recent trading volumes have been about average compared to the year prior & their RSI is neutral.

Yesterday’s doji candlestick signals uncertainty in their near-term price is on the horizon & traders & investors should be watching how they behave at support levels in order to time a position entry when the markets have become less volatile.

TTC stock has support at the $105.11, $104.14 & $103.93/share (10 day moving average) price levels, with resistance at the $107.07, $107.09 & $108.65/share price levels.

Toro Co. TTC Stock As A Long-Term Investment

Long-term focused investors will like TTC stock’s 22.78 P/E (ttm), but will find their 7.49 P/B (mrq) to be too high.

They recently reported 23.2% Quarterly Revenue Growth Y-o-Y, with 53.7% Quarterly Earnings Growth Y-o-Y.

Their balance sheet will require a more thorough review, with $174.04M of Total Cash (mrq) & $1.17B of Total Debt (mrq).

TTC stock pays a 1.18% dividend, which appears to be sustainable in the long run as their payout ratio is 27.25%.

88.22% of TTC stock’s outstanding share float is owned by institutional investors.

Toro Co. TTC Stock As A Short-Term Trade Using Options

Traders with shorter time horizons can trade options to profit from movements in TTC stock’s price, while protecting their portfolio against volatility.

I am looking at the contracts with the 6/16 expiration date.

The $105, $95 & $90 call options are all in-the-money, listed from highest to lowest level of open interest.

The $110, $115 & $120 puts are also all in-the-money, withe the former strike being more liquid than the latter two.

Tying It All Together

TTC stock has many interesting characteristics that traders & investors will find favorable.

Investors will like their dividend yield, as well as their recent growth metrics, but will want to dig deeper into their balance sheet’s structure.

Traders will like TTC’s recent technical performance, but may be disappointed by their relatively illiquid options.

Overall, it is worth taking a closer look into TTC stock now to see how it fits into your portfolio strategy for when market volatility has subsided.

*** I DO NOT OWN SHARE OR OPTIONS CONTRACT POSITIONS IN TTC STOCK AT THE TIME OF PUBLISHING THIS ARTICLE ***

Eaton Corp. ETN Stock Analysis

Eaton Corp. stock trades under the ticker ETN & has shown recent bullishness that traders & investors should look further into for an possible entry once market volatility has subsided.

ETN stock closed at $163.69/share on 4/18/2023.

Eaton Corp. ETN Stock’s Technical Performance Broken Down

Eaton Corp. ETN Stock's Technical Performance Over The Past Year
Eaton Corp. ETN Stock’s Technical Performance Over The Past Year

ETN Stock Price: $163.69

10 Day Moving Average: $160.47

50 Day Moving Average: $167.80

200 Day Moving Average: $152.50

RSI: 49.1

MACD: -1.625

Yesterday, ETN stock completed a bullish MACD crossover, gaining +0.39% on the day’s session.

Recent trading volumes have been relatively average compared to the year prior & their RSI is neutral.

Yesterday’s shooting star candlestick signals that investors & traders may want to tread with caution & eye ETN stock’s behavior at its support levels, so that they can plan an entry point for a position when volatility has simmered down across the market.

ETN stock has support at the $160.47 (10 day moving average), $160.23 & $157.90/share price levels, with resistance at the $164.52, $165.68 & $166.69/share price level.

Eaton Corp. ETN Stock As A Long-Term Investment

Long-term oriented investors will like ETN stock’s 25.86 P/E (ttm), but may find their 3.71 P/B (mrq) to be too high for their liking.

They recently reported 12.2% Quarterly Revenue Growth Y-o-Y, with 30.9% Quarterly Earnings Growth Y-o-Y.

Their balance sheet will require a more thorough examination, with $555M of Total Cash (mrq) & $9.24B of Total Debt (mrq).

ETN stock pays a 1.99% dividend, which appears to be sustainable in the long-run, as their payout ratio is 52.77%.

84.1% of ETN stock’s outstanding share float is owned by institutional investors.

Eaton Corp. ETN Stock As A Short-Term Trade Using Options

Traders with shorter time horizons can trade options to profit from price movements in ETN stock, while protecting their portfolios from volatility.

I am looking at the contracts with the 5/19 expiration date.

The $160, $140 & $155 call options are all in-the-money, listed from highest to lowest level of open interest.

The $165, $175 & $170 puts are also all in-the-money, with the former being more liquid than the latter strikes.

Tying It All Together

ETN stock has many interesting attributes that traders & investors will find appealing.

Investors will like their dividend yield & recent growth metrics, but may want to research further into their balance sheet structure before investing.

Traders will like their recent technical performance, but may wish their options were more liquid.

All-in-all, it is worth taking a closer look into ETN stock to see how it fits into your portfolio strategy when market volatility subsides.

*** I DO NOT OWN SHARES OR OPTIONS CONTRACT POSITIONS IN ETN STOCK AT THE TIME OF PUBLISHING THIS ARTICLE ***

Terex Corp. TEX Stock Analysis

Terex Corp. stock trades under the ticker TEX & has shown recent bullishness that traders & investors should research further into to find an appropriate entry-point for when market volatility subsides.

TEX stock closed at $44.84/share on 4/14/2023.

Terex Corp. TEX Stock’s Technical Performance Broken Down

Terex Corp. TEX Stock's Technical Performance Over The Past Year
Terex Corp. TEX Stock’s Technical Performance Over The Past Year

TEX Stock Price: $44.84

10 Day Moving Average: $44.58

50 Day Moving Average: $51.55

200 Day Moving Average: $41.11

RSI: 41.08

MACD: -2.119

On Friday, TEX stock completed a bullish MACD crossover, gaining +0.76% on the day’s session.

Recent trading volumes have been above average compared to the year prior & their RSI is climbing back from oversold conditions after a series of down days 2 weeks ago.

The real bodies of their most recent three candlesticks signal that there is uncertainty around TEX stock’s value currently, making it important to watch how they behave at support levels to figure out where to enter once markets become less volatile.

TEX stock has support at the $44.58 (10 day moving average), $43.78, $42.40 & $41.89/share price levels, with resistance at the $44.94, $44.95, $45.07, $46.35 & $46.34/share price levels.

Terex Corp. TEX Stock As A Long-Term Investment

Long-term oriented investors will like TEX stock’s 10.38 P/E (ttm), but may find their 2.58 P/B (mrq) to be a bit too rich.

They recently reported 23% Quarterly Revenue Growth Y-o-Y, with 56.8% Quarterly Earnings Growth Y-o-Y.

Their balance sheet may require a more thorough review, with $304.1M of Total Cash (mrq) & $864.6M of Total Debt (mrq).

TEX stock pays a modest 1.17% dividend, which appears to be sustainable in the long-run, as their payout ratio is 12.04%.

90.12% of TEX stock’s outstanding share float is owned by institutional investors.

Terex Corp. TEX Stock As A Short-Term Trade Using Options

Traders with shorter time horizons can trade options to profit from TEX stock’s price movements, while protecting their portfolios from volatility.

I am looking at the contracts with the 5/19 expiration date.

The $42, $41 & $43 call options are all in-the-money, listed from highest to lowest level of open interest.

The $45, $47 & $48 puts are also in-the-money, with the former being more liquid than the latter strikes.

Tying It All Together

TEX stock has many interesting attributes that traders & investors will find appealing once markets become less volatile.

Investors will like their sustainable dividend & recent growth metrics.

Traders will like their recent technical performance.

Overall, it is worth taking a closer look into TEX stock to see how it fits into your portfolio strategy.

*** I DO NOT OWN SHARES OR OPTIONS CONTRACTS POSITIONS IN TEX STOCK AT THE TIME OF PUBLISHING THIS ARTICLE ***

Powell Industries, Inc. POWL Stock Analysis

Powell Industries, Inc. stock trades under the ticker POWL & has shown recent bullishness that traders & investors should research further into for when market volatility subsides.

POWL stock closed at $41.35/share on 4/14/2023.

Powell Industries, Inc. POWL Stock’s Technical Performance Broken Down

Powell Industries, Inc. POWL Stock's Technical Performance Over The Past Year
Powell Industries, Inc. POWL Stock’s Technical Performance Over The Past Year

POWL Stock Price: $41.35

10 Day Moving Average: $40.89

50 Day Moving Average: $42.68

200 Day Moving Average: $31.02

RSI: 49.36

MACD: -0.406

On Friday, POWL stock completed a bullish MACD crossover, gaining +0.15% on the day’s session.

Their RSI is neutral & recent trading volumes have been about average compared to the year prior, but their last week of candlesticks signals that there is uncertainty in the air about their value.

As such, it is wise to research into POWL stock now, while watching how it behaves around key support areas to figure out a more favorable entry for when markets become less volatile.

POWL stock has support at the $40.89 (10 day moving average), $40.36, $40.16 & $38.87/share price levels, with resistance at the $41.48, $42.63, $42.68 (50 day moving average) & $43.12/share price levels.

Powell Industries, Inc. POWL Stock As A Long-Term Investment

Long-term oriented investors will like POWL stocks 27.39 P/E (ttm) & 1.62 P/B (mrq).

They recently reported 19% Quarterly Revenue Growth Y-o-Y.

Their balance sheet looks appealing, with $110.7M of Total Cash (mrq) & $2.26M of Total Debt (mrq).

POWL stock pays a 2.52% dividend, which may not be sustainable in the long-run, as their payout ratio is 69.8%.

66.25% of POWL stock’s outstanding share float is owned by institutional investors.

Powell Industries, Inc. POWL Stock As A Short-Term Trade Using Options

Traders with shorter time horizons can trade options to profit from price movements in POWL stock, while protecting their portfolios from volatility.

I am looking at the contracts with the 5/19 expiration date.

The $40, $35 & $30 call options are all in-the-money, listed from highest to lowest level of open interest.

The $45 puts are currently the only strike with open interest that is in-the-money.

Tying It All Together

POWL stock has many interesting characteristics that traders & investors will find appealing.

Investors will like their valuation metrics & balance sheet, but may want to look closer into the sustainability of their dividend.

Traders will like their recent technical performance, but may be disappointed by how illiquid their options are.

Overall, it is worth taking a closer look into POWL stock to see how it fits into your portfolio strategy once market volatility subsides.

*** I DO NOT OWN SHARES OR OPTIONS CONTRACT POSITIONS IN POWL STOCK AT THE TIME OF PUBLISHING THIS ARTICLE ***

Snap On Inc. Holding Co. SNA Stock Analysis

Snap On Inc. Holding Co.’s stock trades under the ticker SNA & has shown recent bullishness that traders & investors should research further into for less volatile times in the market.

SNA stock closed at $238.91/share on 3/13/2023.

Snap On Inc. Holding Co. SNA Stock’s Technical Performance Broken Down

Snap On Inc. Holding Co. SNA Stock's Technical Performance Over The Past Year
Snap On Inc. Holding Co. SNA Stock’s Technical Performance Over The Past Year

SNA Stock Price: $238.91

10 Day Moving Average: $237.67

50 Day Moving Average: $243.70

200 Day Moving Average: $226.10

RSI: 50.13

MACD: -1.631

Yesterday, SNA stock completed a bullish MACD crossover, gaining +0.41% on the day’s session.

Their RSI is neutral at 50 & recent trading volumes have been about average compared to the year prior.

After gapping up on Tuesday, their last few days of candlesticks are tightly consolidated in a ~1% range, signaling that investors & traders are anticipating downside moves in the near-term.

This makes it important for traders & investors to watch how SNA stock behaves around support levels in the coming weeks, as they eye a safer entry when times have become less volatile.

SNA stock has support at the $237.67 (10 day moving average), $231.89 & $230.33/share price levels, with resistance overhead at the $243.70 (50 day moving average), $243.94 & $247.74/share price levels.

Snap On Inc. Holding Co. SNA Stock As A Long-Term Investment

Long-term oriented investors will like SNA stock’s 14.02 P/E (ttm), but may find their 2.8 P/B (mrq) to be a bit too rich.

They recently reported 4.1% Quarterly Revenue Growth Y-o-Y, with 6.8% Quarterly Earnings Growth Y-o-Y.

Their balance sheet will require a more thorough examination, with $757.1M of Total Cash (mrq) & $1.27B of Total Debt (mrq).

SNA stock pays a 2.47% dividend, which appears to be sustainable in the long-run, as their payout ratio is 34.96%.

89.29% of SNA stock’s outstanding share float is owned by institutional investors.

Snap On Inc. Holding Co. SNA Stock As A Short-Term Trade Using Options

Traders with shorter time horizons can trade options to profit from movements in SNA stock’s price, while protecting their portfolios from broader market volatility.

I am looking at the contracts with the 6/16 expiration date.

The $230, $220 & $200 calls are all in-the-money, listed from highest to lowest level of open interest.

The $250, $240 & $260 puts are also all in-the-money, with the former being more liquid than the latter strikes.

Tying It All Together

SNA stock has many interesting attributes that traders & investors will want to look into so that they can enter positions at better prices when market volatility has subsided.

Investors will like their sustainable dividend, as well as their balance sheet.

Traders will like their recent technical performance, as well as how liquid their options are compared to other names.

All-in-all, it is worth taking a closer examination into SNA stock to see how it fits into your portfolio strategy.

*** I DO NOT OWN SHARES OR OPTIONS CONTRACT POSITIONS IN SNA STOCK AT THE TIME OF PUBLISHING THIS ARTICLE ***

Piper Sandler Companies PIPR Stock Analysis

Piper Sandler Companies stock trades under the ticker PIPR & has shown recent bullishness that traders & investors should research further into for when market volatility subsides.

PIPR stock closed at $134.18/share on 4/12/2023.

Piper Sandler Companies PIPR Stock’s Technical Performance Broken Down

Piper Sandler Companies PIPR Stock's Technical Performance Over The Past Year
Piper Sandler Companies PIPR Stock’s Technical Performance Over The Past Year

PIPR Stock Price: $134.18

10 Day Moving Average: $133.83

50 Day Moving Average: $141.93

200 Day Moving Average: $127.80

RSI: 46.08

MACD: -2.079

Yesterday, PIPR stock completed a bullish MACD crossover, gaining +0.32% on the day’s session.

Their RSI is neutral, with recent trading volumes being below average compared to the year prior, signaling investors are being cautious in how they value the stock.

While they closed above their 10 day moving average yesterday, the day’s hanging man candlestick signals more near-term volatility is on the horizon, so traders & investors should be watching their behavior at support levels to begin planning future entry points for when broader market volatility is lower.

PIPR stock has support at the $133.83 (10 day moving average), $133.53 & $132.41/share price levels & has resistance at the $141.93 (50 day moving average), $142.44 & $142.62/share price levels.

Piper Sandler Companies PIPR Stock As A Long-Term Investment

Long-term oriented investors will like PIPR stock’s 20.51 P/E (ttm) & their 2.25 P/B (mrq).

They recently reported -39.7% Quarterly Revenue Growth Y-o-Y, with -66.4% Quarterly Earnings Growth Y-o-Y, which prospective investors will want to research further into.

Their balance sheet looks appealing at first glance, with $705.6M of Total Cash (mrq) & $239.92M of Total Debt (mrq).

PIPR stock pays a 1.79% dividend, which appears to be sustainable in the long-run, as their payout ratio is 36.81%.

66.65% of PIPR stock’s outstanding share float is owned by institutional investors.

Piper Sandler Companies PIPR Stock As A Short-Term Trade Using Options

Traders with shorter time horizons can trade options to profit from PIPR stock’s price movements, while protecting their portfolios from broader market volatility.

I am looking at the contracts with the 6/16 expiration date.

There are currently no calls with strike prices in-the-money for this date, but that will likely change as there are 2 expiration dates in the meantime that may shuffle liquidity.

The $143.75 & $138.75 puts are in-the-money, with the former having more open interest than the latter.

Tying It All Together

PIPR stock has many interesting attributes that traders & investors will want to look closer into in anticipation of when markets become less volatile.

Investors will like their balance sheet, valuation metrics & sustainable dividend, but may want to review their recently reported growth metrics.

Traders will like their recent technical performance, but may be disappointed by how illiquid their options are.

All-in-all, it is worth taking a closer look into PIPR stock to see how it fits into your portfolio strategy when the broader markets are less volatile.

*** I DO NOT OWN SHARES OR OPTIONS CONTRACT POSITIONS IN PIPR STOCK AT THE TIME OF PUBLISHING THIS ARTICLE ***

Hooker Furniture Corp. HOFT Stock Analysis

Hooker Furniture Corp. stock trades under the ticker HOFT & has shown recent bullishness that traders & investors may want to research further into for when market volatility subsides.

HOFT stock closed at $18.73/share on 4/10/2023.

Hooker Furniture Corp. HOFT Stock’s Technical Performance Broken Down

Hooker Furniture Corp. HOFT Stock's Technical Performance Over The Past Year
Hooker Furniture Corp. HOFT Stock’s Technical Performance Over The Past Year

HOFT Stock Price: $18.73

10 Day Moving Average: $18.54

50 Day Moving Average: $20.06

200 Day Moving Average: $17.00

RSI: 44.9

MACD: -0.471

Yesterday, HOFT stock completed a bullish MACD crossover, gaining +2.18% on the day’s session.

Recent trading volume have been slightly elevated compared to the average of the year before & their RSI is still in the neutral range after spending the last few weeks in a consolidation period.

Broader macro volatility signals are still abound, making it important to watch how HOFT stock behaves at its support levels to figure out where the best entry-point will be once markets become less volatile.

HOFT stock has support at the $18.54 (10 day moving average), $18.39 & $18.07/share price levels, with resistance at the $19.14, $19.34 & $19.82/share price levels.

Hooker Furniture Corp. HOFT Stock As A Long-Term Investment

Long-term oriented investors will like HOFT stock’s valuation metrics, with a 22.63 P/E (ttm) & a 0.8 P/B (mrq).

They recently reported 13.6% Quarterly Revenue Growth Y-o-Y.

Their balance sheet will require a more thorough examination before investing, with $6.51M of Total Cash (mrq) & $79.04M of Total Debt (mrq).

HOFT stock pays a 4.36% dividend, which may not be sustainable in the long-run, as their payout ratio is 98.77%.

72.8% of HOFT stock’s outstanding share float is owned by institutional investors.

Hooker Furniture Corp. HOFT Stock As A Short-Term Trade Using Options

Traders with shorter time horizons can trade options to profit from HOFT stock’s price movements, while protecting their portfolios from volatility.

I am looking at the contracts that expire on 5/19.

The $17.50 call options are in-the-money.

The $25, $22.50 & $20 puts are also all in-the-money, listed from highest to lowest level of open interest.

Tying It All Together

HOFT stock has many interesting characteristics that traders & investors will find appealing.

Investors will like their valuation metrics & dividend yield, but may want to dig deeper into their balance sheet for clues on how sustainable their dividend is.

Traders will like their recent technical performance, but may be disappointed by how illiquid their options are.

All-in-all, it is worth taking a closer look into HOFT stock to see how it fits into your portfolio strategy.

*** I DO NOT OWN SHARES OR OPTIONS CONTRACT POSITIONS IN HOFT STOCK AT THE TIME OF PUBLISHING THIS ARTICLE ***

Fulton Financial Corp. FULT Stock Analysis

Fulton Financial Corp. stock trades under the ticker FULT & has shown recent bullishness that traders & investors may want to research further into once market volatility calms down.

FULT stock closed at $13.49/share on 4/7/2023.

Fulton Financial Corp. FULT Stock’s Technical Performance Broken Down

Fulton Financial Corp. FULT Stock's Technical Performance Over The Past Year
Fulton Financial Corp. FULT Stock’s Technical Performance Over The Past Year

FULT Stock Price: $13.49

10 Day Moving Average: $13.69

50 Day Moving Average: $15.74

200 Day Moving Average: $16.12

RSI: 33.41

MACD: -0.678

On Friday, FULT stock completed a bullish MACD crossover, gaining +0.45% on the day’s session.

Their RSI is approaching oversold conditions, after declining for the past month & recent trading volumes have been above average.

Broader market volatility will continue to impact FULT stock, but their behavior at support levels throughout it will provide clues into where to enter a position once the volatility subsides.

FULT stock has support at the $13.28 & $13.16/share price level, as they look to break out & above the $13.53, $13.69 (10 day moving average) & $13.80/share price level.

Fulton Financial Corp. FULT Stock As A Long-Term Investment

Long-term oriented investors will like FULT stock’s valuation metrics, with an 8.08 P/E (ttm) & a 0.94 P/B (mrq).

They recently reported 16.6% Quarterly Revenue Growth Y-o-Y, with 32.2% Quarterly Earnings Growth Y-o-Y.

Their balance sheet will require a more thorough examination, with $835.49M of Total Cash (mrq) & $3.26B of Total Debt (mrq).

FULT stock pays a 4.47% dividend, which appears to be sustainable in the long-run, as their payout ratio is 35.93%.

67.9% of FULT stock’s outstanding share float is owned by institutional investors.

Fulton Financial Corp. FULT Stock As A Short-Term Trade Using Options

Traders with shorter-term time horizons can trade options to profit from price movements in FULT stock, while protecting their portfolios from volatility.

I am looking at the contracts with the 4/21 expiration date.

The $12.50 call options are in-the-money.

The $17.50 & $15 puts are also in-the-money, with the former being more liquid than the latter strike.

Tying It All Together

FULT stock has many interesting characteristics that are worth researching into for when their share price stabilizes & broader market volatility subsides.

Investors will like their dividend yield, as well as their valuation metrics, but should research more into their balance sheet structure.

Traders will like their recent technical performance, but may be disappointed in how illiquid their options are.

Overall, it is worth taking a closer look into how FULT stock fits into your portfolio strategy for once market volatility dies down.

*** I DO NOT OWN SHARES OR OPTIONS CONTRACT POSITIONS IN FULT STOCK AT THE TIME OF PUBLISHING THIS ARTICLE ***

BOK Financial Corp. BOKF Stock Analysis

BOK Financial Corp. stock trades under the ticker BOKF & has shown recent bullishness that traders & investors may want to research further into for the future.

BOKF closed at $82.24/share on 4/7/2023.

BOK Financial Corp. BOKF Stock’s Technical Performance Broken Down

BOK Financial Corp. BOKF Stock's Technical Performance Over The Past Year
BOK Financial Corp. BOKF Stock’s Technical Performance Over The Past Year

BOKF Stock Price: $82.24

10 Day Moving Average: $83.76

50 Day Moving Average: $95.62

200 Day Moving Average: $93.54

RSI: 34.63

MACD: -4.023

On Friday, BOKF stock completed a bullish MACD crossover, after steadily declining since late February.

Recent trading volumes have been above average compared to the year prior & their RSI is on the oversold end of neutral after the aforementioned decline.

Their chart is still not signaling it is safe to enter, but watching how they behave at their support levels will help identify a safe entry in the future.

BOKF stock has support at the $80.88, $80.45 & $80.33/share price level, with resistance at the $83.76 (10 day moving average), $83.94 & $84.57/share price level.

BOK Financial BOKF Stock As A Long-Term Investment

Long-term oriented investors will like BOKF stock’s valuation metrics, with a 10.71 P/E (ttm) & a 1.17 P/B (mrq).

They recently reported 18.4% Quarterly Revenue Growth Y-o-Y, with 43.6% Quarterly Earnings Growth Y-o-Y.

Their balance sheet also looks appealing, with $6.75B of Total Cash (mrq) & $7.91B of Total Debt (mrq).

BOKF stock pays a 2.67% dividend, which appears to be sustainable in the long-run, as their payout ratio is 27.73%.

38.8% of BOKF stock’s outstanding share float is owned by institutional investors.

BOK Financial Corp. BOKF Stock As A Short-Term Trade Using Options

Traders focused on shorter time horizons can trade options to profit from price movements in BOKF stock, while protecting their portfolios from volatility.

I am looking at the contracts with the 4/21expiration date.

The $80 call options are in-the-money.

The $85 & $90 puts are also in-the-money, with the former being more liquid than the latter strike.

Tying It All Together

BOKF has many interesting attributes that traders & investors may find appealing after the coming market volatility passes by.

Investors will like their dividend yield, valuation metrics & balance sheet.

Traders will like their recent technical performance, but may be disappointed in how liquid their options are.

All-in-all, it is worth taking a closer look into how BOKF stock may fit into your portfolio strategy down the line after market volatility settles down.

*** I DO NOT OWN SHARES OR OPTIONS CONTRACT POSITIONS IN BOKF STOCK AT THE TIME OF PUBLISHING THIS ARTICLE ***