Liberty Global Inc. LBTYA Stock Notes

Liberty Global Inc. stock trades under the ticker LBTYA & has shown recent bullishness that traders & investors should take a closer look at.

LBTYA stock closed at $28.03/share on 1/13/22, with bullish momentum behind it.

Liberty Global Inc. LBTYA Stock’s Technical Performance Broken Down
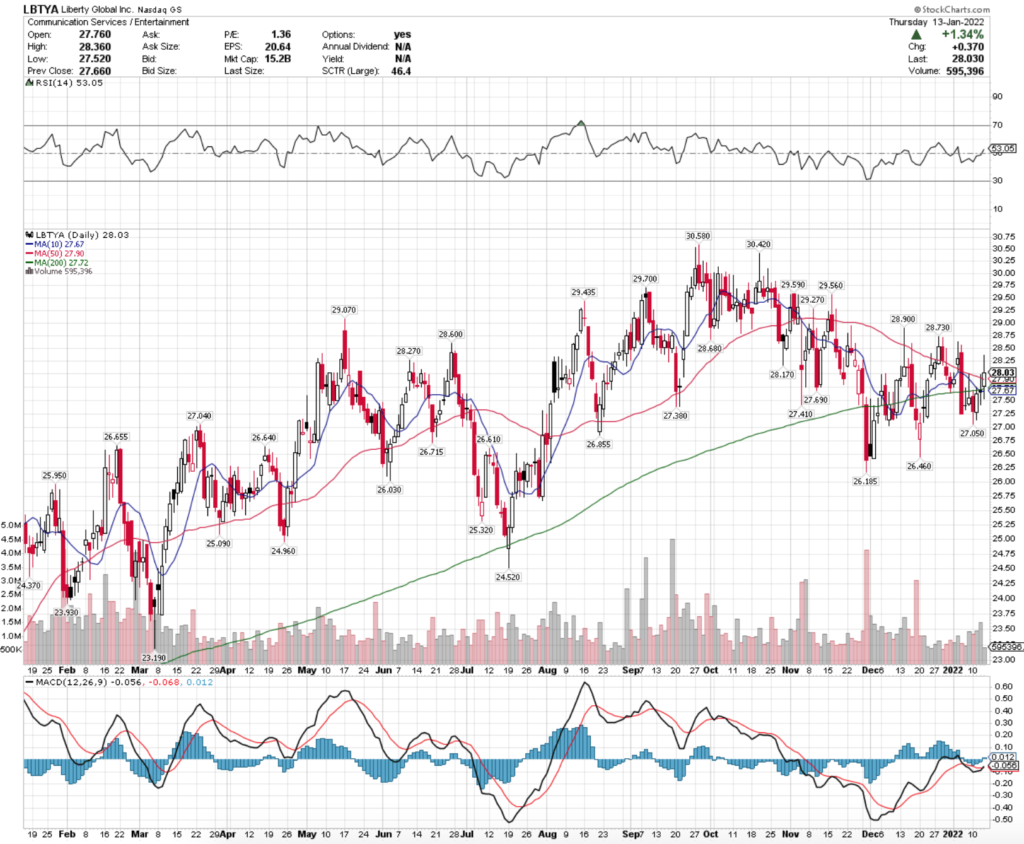
Libtery Global Inc. LBTYA Stock's Technical Performance Over The Last Year

LBTYA Stock Price: $28.03

10 Day Moving Average: $27.67

50 Day Moving Average: $27.90

200 Day Moving Average: $27.72

RSI: 53

MACD: -0.007

Yesterday, LBTYA stock completed a bullish MACD crossover, while also breaking out above its 10, 50 & 200 Day Moving Averages.

While their volume has recently been a bit below average compared to the rest of the year, with a neutral RSI there looks to be additional momentum to push higher.

Their next level of resistance to test will be the $28.56-$28.63/share range.

Liberty Global Inc. LBTYA Stock As A Long-Term Investment

Long-term oriented investors will like LBTYA stock’s valuation metrics, with a P/E(ttm) of 1.36 & a P/B (mrq) of 0.58.

Their Quarterly Revenue Growth Y-o-Y is rather disappointing, at -33%.

Investors will want to take a closer look at LBTYA’s balance sheet, with Total Cash (mrq) of $3.39B & $17.07B in Total Debt (mrq).

Despite not offering a dividend, 94% of LBTYA stock’s total share float is held by institutional investors.

Liberty Global Inc. LBTYA Stock As A Short-Term Trade Using Options

LBTYA stock has options contracts that can be used to make profits in both directions in the near-term.

I am looking at the contracts with the 1/21 expiration date.

The $27.50 & $30 calls both look appealing & very liquid with solid open interest levels.

The $30 & $32.50 puts also look appealing, but have far less open interest, signaling that the market’s sentiment is still bullish in the near-term for LBTYA stock.

Tying It All Together

Overall, LBTYA stock has many interesting attributes that investors & traders should take a closer look at.

Their valuation levels are quite low, which investors focused on the long-run will find appealing.

Traders will like their current momentum & technical set up, as well as the liquidity in their call options.

LBTYA stock is worth taking a closer look at to see if it is right for your portfolio.

*** I DO NOT OWN SHARES OF LBTYA STOCK ***
Telecom Argentina TEO Stock Analysis

Telecom Argentina stock trades under the ticker TEO & has recently shown bullishness that traders & investors should take a closer look at.

TEO stock closed at $5.16/share on 1/11/22.

Telecom Argentina TEO Stock’s Technicals Broken Down

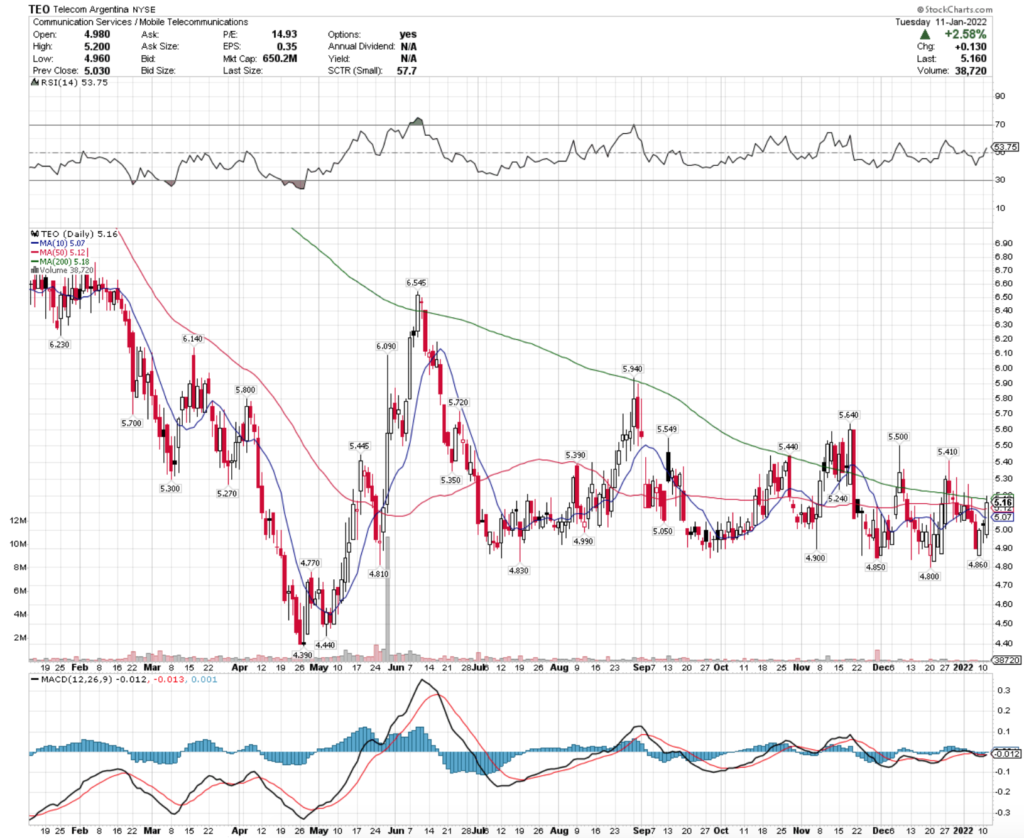
Telecom Argentina TEO Stock's Technical Performance Over The Last Year

TEO Stock Price: $5.16

10 Day Moving Average: $5.07

50 Day Moving Average: $5.12

200 Day Moving Average: $5.18

RSI: 53.8

MACD: -0.012

Yesterday, TEO stock completed a bullish MACD crossover, while breaking out above its 10 & 50 Day Moving Averages.

With a neutral RSI & 0.4% between the price & the 200 Day MA, there looks to be added momentum in the coming days for traders to profit from.

Telecom Argentina TEO Stock As A Long-Term Investment

TEO stock’s valuation metrics may be appealing to investors, with a P/E (ttm) of 21.3 & a P/B (mrq) of 0.46.

Their Quarterly Revenue Growth Y-o-Y was -5.8%.

TEO’s balance sheet is concerning & warrants a closer look before investment.

They have Total Cash (mrq) of $25.3B & Total Debt (mrq) of $266.1B.

They also offer a 4.43% dividend yield, with 7.9% of their total share float held by institutional investors.

Telecom Argentina TEO Stock As A Short-Term Trade Using Options

Telecom Argentina stock has options for traders to use to capture profits in the near-term.

I am looking at the contracts with the 1/21 expiration date.

The $2.10 & $4.60 calls look appealing, although illiquid with limited open interest.

The $7.10 puts look appealing, but also lack open interest which may dissuade some traders from buying them.

Traders prefer more open interest, as it means that there are more active buyers & sellers in the market for a particular name, so that they can more easily profit from trades gone well & exit trades gone bad.

Tying It All Together

Telecom Argentina stock has many interesting characteristics that may appeal to both long & short term traders.

Investors will like its valuation & dividend yield, but may want to look more closely at their balance sheet.

Traders will like their current momentum path, but should watch out for the open interest on their options contracts.

Overall, it is worth taking a closer look at TEO stock.

*** I DO NOT OWN SHARES OF TEO STOCK ***

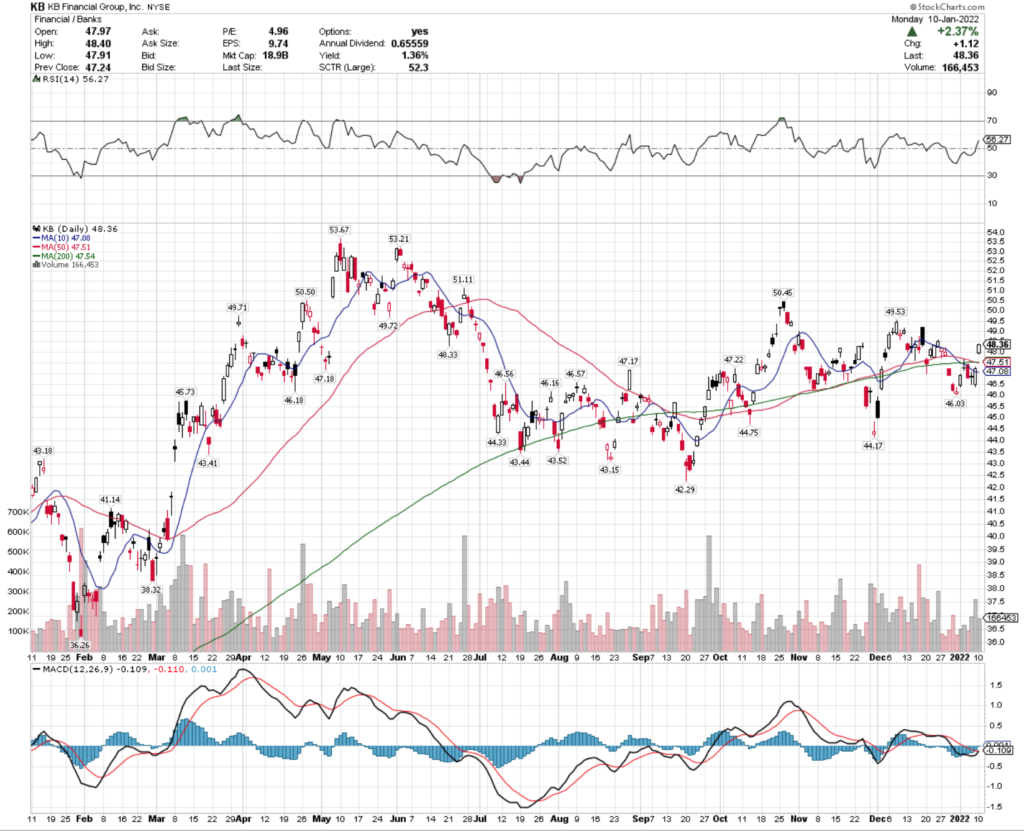
KB Financial Group, Inc. KB Stock

KB Financial Group Inc. stock trades under the ticker KB & has shown bullishness that traders & investors should take a closer look into.

KB stock closed at $48.36/share on 1/11/22, after a 2.4% gap up, on above average trading volume.

KB Financial Group, Inc. KB Stock’s Technicals Broken Down

KB Financial Group, Inc. KB Stock's Technical Performance Over The Last Year

KB Stock Price: $48.36

10 Day Moving Average: $47.08

50 Day Moving Average: $47.51

200 Day Moving Average: $47.54

RSI: 56.3

MACD: 0.34

Yesterday, KB stock completed a bullish MACD crossover, while also gapping up 2.4% & breaking out above all of their major moving averages.

Their trading volume has been stronger than average for the past year so far going into 2022.

Their next test of resistance will be at the $49.03-level, followed by the $50.45-level.

KB Financial Group, Inc. KB Stock As A Long-Term Investment

Investors may find KB Financial Group, Inc. stock’s valuation metrics appealing, with a P/E (ttm) of 5.34 & a P.B (mrq) of 0.48.

KB stock had 14.4% Quarterly Revenue Growth Y-o-Y.

Their Balance Sheet will require a deeper dive to sort through thought, with Total Cash (mrq) of $77.41T & Total Debt (mrq) of $133.3T.

KB pays a 4.6% dividend yield, which should be safe, although their payout ratio is a bit rich at 57%, which could indicate a need to cut the yield in the future possibly.

KB stock only has 5.9% of its share float held by institutional investors.

KB Financial Group, Inc. KB Stock As A Short-Term Trade Using Options

KB Financial Group, Inc. has options that traders can use to take advantage of price movement in either direction.

I am looking at the contracts with the 1/21 expiration date.

The $50 calls look appealing, although very illiquid with 22 contracts of open interest.

The $50 puts also look appealing, but illiquid as well.

There is more liquidity in the $45 puts, indicating that the sentiment for KB stock has changed recently regarding its near-term sentiment from more bearish to being more bullish.

Tying It All Together

KB Financial Group, Inc. has many interesting attributes that traders & investors may be interested in.

Investors will like their international banking exposure & valuation metrics, although be slightly weary about their balance sheet.

Traders will like their current momentum, but be troubled by the lack of open interest in their options contracts.

However, their put volume shows either people were hedging at the $45/share mark, or the sentiment has changed for them in the near-term to a more bullish tune.

Overall, it is worth taking a closer look at KB stock.

*** I DO NOT OWN SHARES OF KB STOCK ***

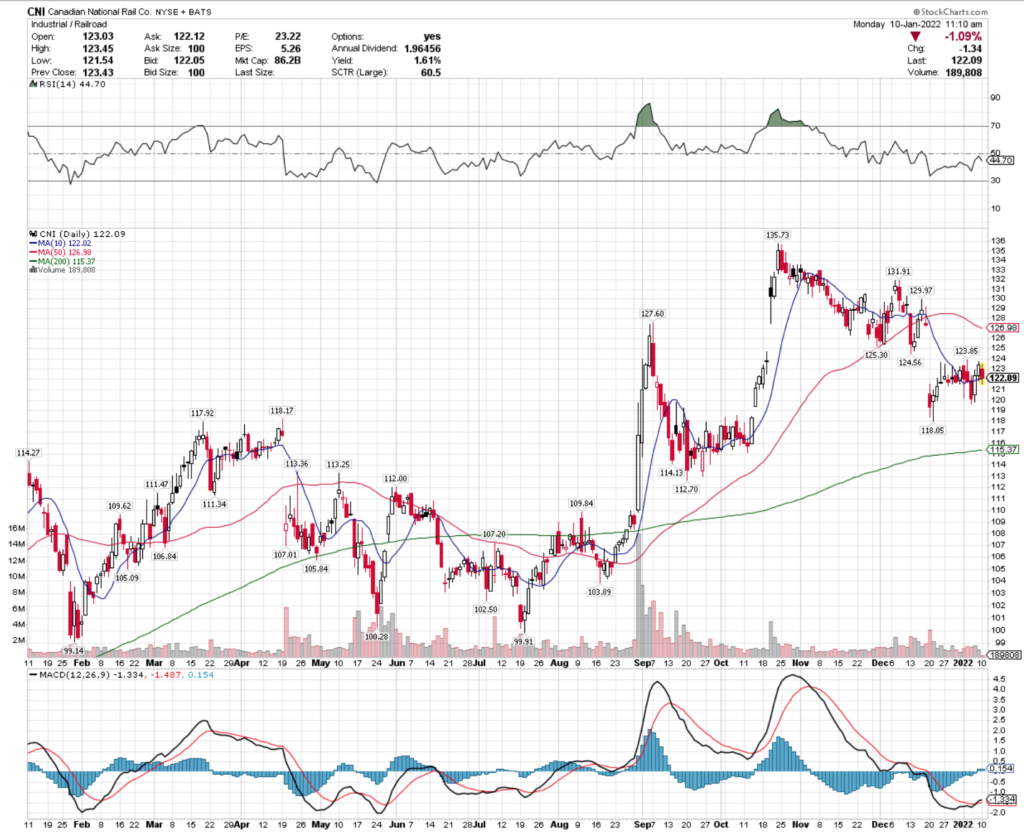
Canadian National Rail Co. CNI Stock

Canadian National Rail Co. stock trades under the ticker CNI & has shown recent bullishness that traders & investors should take a closer look at.

CNI stock closed at $123.43/share on 1/7/2022.

Canadian National Rail Co. CNI Stock’s Technicals Broken Down

Canadian National Rail Co. CNI Stock's Technical Performance Over The Last Year

CNI Stock Price: $122.09 (at time of chart above’s screenshot)

10 Day Moving Average: $122.02

50 Day Moving Average: $126.98

200 Day Moving Average: $115.37

RSI: 44.7

MACD: -1.4

CNI stock completed a bullish MACD crossover on Friday, on relatively average trading volume compared to the year prior.

The broader market volatility is not going to exclude them, which may open up entry opportunities for investors, and trade opportunities for traders.

CNI stock will need to break through the $123.85 & $124.56 levels of resistance to carry on momentum.

Canadian National Rail Co. CNI Stock As A Long-Term Investment

CNI stock may be an appealing fit for some investor’s portfolios.

Their P/E (ttm) is 24.7, with a P/B of 5.34.

CNI stock saw a 5.3% increase in Quarterly Revenue Growth Y-o-Y.

Their balance sheet will need some further review though, with $2.19B in Total Cash (mrq) & $13.99B in Total Debt (mrq).

CNI stock offers a 1.96% dividend yield, that looks safe with a 36.5% payout ratio.

78% of CNI’s total share float is held by institutional investors.

Canadian National Rail Co. CNI Stock As A Short-Term Trade Using Options

Canadian National Rail Co. stock has options, which enable traders to benefit from changes in price in either direction, which can be beneficial durring market volatility.

I am looking at the contracts with the 1/21 expiration date.

The $115, $120 & $125 call options are all appealing, although somewhat illiquid with open interest for each strike price being in the 400-700 range.

The $125 puts have the most open interest, with 2,251 contracts outstanding, showing traders are not bullish beyond the $125/share point.

The $130 & $135 puts also look appealing, although much less liquid than the $125’s.

Tying It All Together

Canadian National Rail Co. stock is certainly worth taking a closer look at, regardless of your trading or investing style.

Investors will like their dividend structure, although it is advised to look closer at their balance sheet before determining if it is investment-worthy for you or not.

Traders will like their current momentum, as well as the volatility that has been kicking up in 2022, increasing the opportunities to earn profits.

All-in-all, CNI stock is worth doing some more homework on.

*** I DO NOT OWN SHARES OF CNI STOCK ***

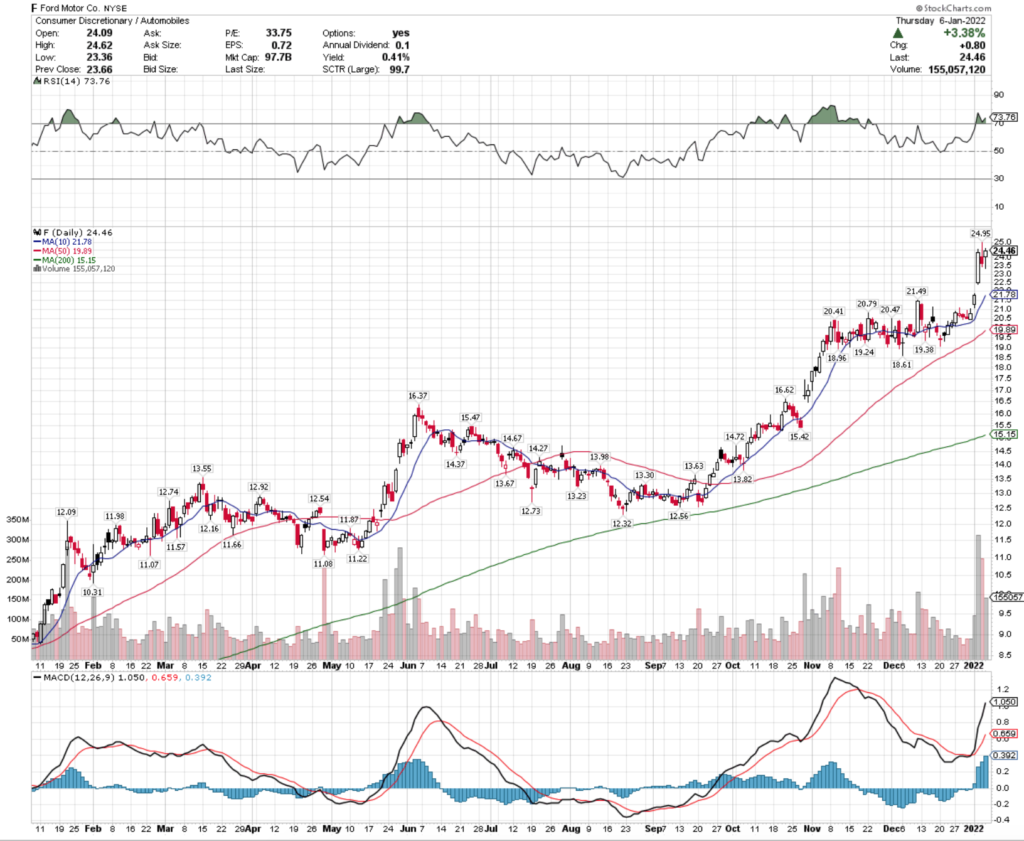
Ford Motor Co. F Stock Analysis

Ford Motor Co. stock trades under the ticker F & has recently shown bullishness that traders & investors should take a closer look at.

F stock closed at $24.46/share on 1/6/2022 & looks set to continue climbing in the near-term.

Ford Motor Co. F Stock’s Technicals Broken Down

Ford Motor Co. F Stock's Technical Performance Over The Last Year

F Stock Price: $24.46

10 Day Moving Average: $21.78

50 Day Moving Average: $19.89

200 Day Moving Average: $15.15

RSI: 73.8

Ford Motor Co. stock has been on a steady uptrend since November, with higher than average volume for the last year so far in 2022.

Although their RSI is overbought, they look at have more momentum to come, although that may be cut short by broader market volatility that we have been experiencing.

I will be keeping an eye on their MACD lines to see how the trend slows while the look to establish a new price range for F shares.

Ford Motor Co. F Stock As A Long-Term Investment

As noted above, this post was begun on Friday, 1/7/2022, so some of the data below will reflect today, Monday 1/10/2022’s updated information as the markets are open as of me writing this & the following section.

F stock’s P/E (ttm) is 30.64, with a P/B (mrq) of 2.34, which investors may find appealing from a valuation perspective, given the nature of other, higher multiples we are seeing.

Ford saw -4.8% Quarterly Revenue Growth Y-o-Y, which was somewhat to be expected based on news reports during COVID times.

F stock’s balance sheet may be concerning to investors, with Total Cash (mrq) of $31.42B & Total Debt (mrq) of $145.87B.

Ford stock’s dividend yield has resumed payment, at ~1.68% based on the projected amount seen in 2022.

Only 53% of F stock’s share float is held by institutional investors.

Ford Motor Co. F Stock As A Short-Term Trade Using Options

Traders can use options to take advantage of Ford Motor Company’s current momentum, while hedging against a broader market downturn.

I am looking at the contracts with the 1/21/22 expiration date.

The $23.50 & $24 strike price call options all look appealing & highly liquid, as they have high levels of open interest.

The $24.50 & $25 puts also look interesting, and very liquid as well, although slightly less than calls, indicating that there is a stronger bullish sentiment in the near-term than bearish.

Tying It All Together

Overall, investors & traders should take a closer look at Ford Motor Co.’s stock.

They currently are on a long bullish streak, and have crossed into new highs in 2022.

While they are trying to establish a new price range to trade in there may be opportunities for traders to make some profits on the up & downside.

Long-term oriented investors may also use this as a means of timing a good entry, which can be difficult when a stock is at its highest levels in over a year.

*** I DO NOT OWN SHARES OF F STOCK ***

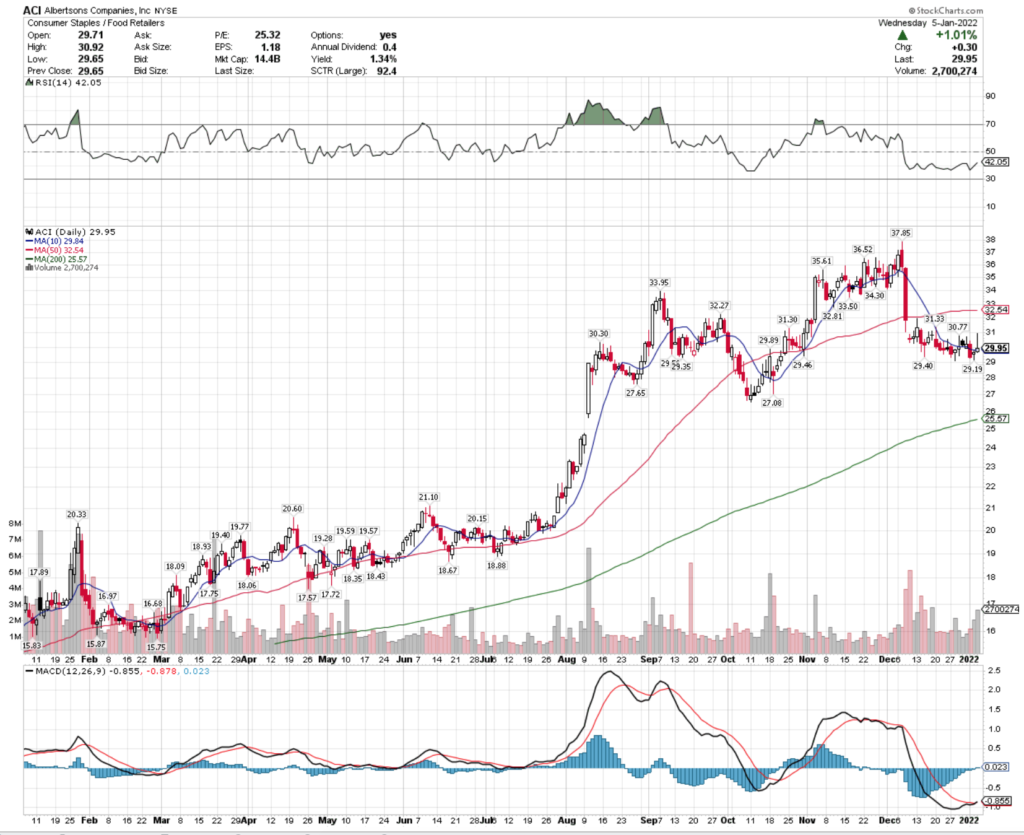
Albertsons Companies, Inc. ACI Stock

Albertsons Companies, Inc. stock is a food retailer stock that traders & investors should take a closer look at in this time of market volatility.

Albertsons Companies, Inc. stock trades under the ticker ACI & closed at $29.95/share on 1/5/2022.

Albertson’s Companies, Inc. ACI Stock’s Technicals Broken Down

Albertsons Companies, Inc. ACI Stock's Technical Performance Over The Last Year

ACI Stock Price: $29.95

10 Day Moving Average: $29.84

50 Day Moving Average: $32.54

200 Day Moving Average: $25.57

RSI: 42

MACD: -0.855

ACI stock completed a bullish MACD crossover yesterday, and it still has a relatively oversold RSI, making it possible to minimize losses.

Their trading volume was also above average for the last month.

ACI stock’s price is looking to establish a new range, where the $31.95-level will be the next test of resistance.

Albertsons Companies, Inc. ACI Stock As A Long-Term Investment

Long-term focused investors may find ACI stock’s valuation appealing, with a P/E(ttm) of 24.96 & a P/B of 7.32 (which is a bit high).

Their Quarterly Revenue Growth Y-o-Y was 4.7%.

ACI stock’s balance sheet looks a bit concerning, with only $2.86B in Total Cash (mrq) & Total Debt (mrq) of $14.45B.

ACI offers a 1.35% dividend yield, which looks to be safe with a 32% payout ratio.

73.6% of ACI’s share float is held by institutional investors.

Albertsons Companies, Inc. ACI Stock As A Short-Term Trade Using Options

Traders who are interested in the short-term performance of ACI stock can use options to capture their momentum, while fending off broader market volatility.

I am looking at the contracts with the 1/21 expiration date.

The $28 & $29 call options look appealing, although relatively illiquid with their combined open interest being ~600 contracts between the two.

The $30 & $31 puts also look interesting, and have a bit more liquidity, signaling that there is more hedging being done in anticipation of the markets continuing to fall for the rest of this month.

Tying It All Together

All-in-all ACI stock looks to have many interesting characteristics that traders & investors should be interested in.

Their industry is going to have consistent demand regardless of what happens with COVID measures, as they are a grocer & pharmacy company.

Their P/E(ttm) & Dividend Yield also look appealing for investors looking to safely accumulate interest.

From a technical perspective, they have already been trying to find a new range after a large gap down in early December, which when paired with their RSI in the 40’s may help limit how much further they can decline in relation to the broader markets.

Overall, ACI stock is worth taking a closer look at.

*** I DO NOT OWN SHARES OF ACI STOCK ***

Civitas Resources, Inc. CIVI Stock

Civitas Resources, Inc. stock trades under the ticker CIVI & has shown recent bullishness that traders & investors should take a closer look at.

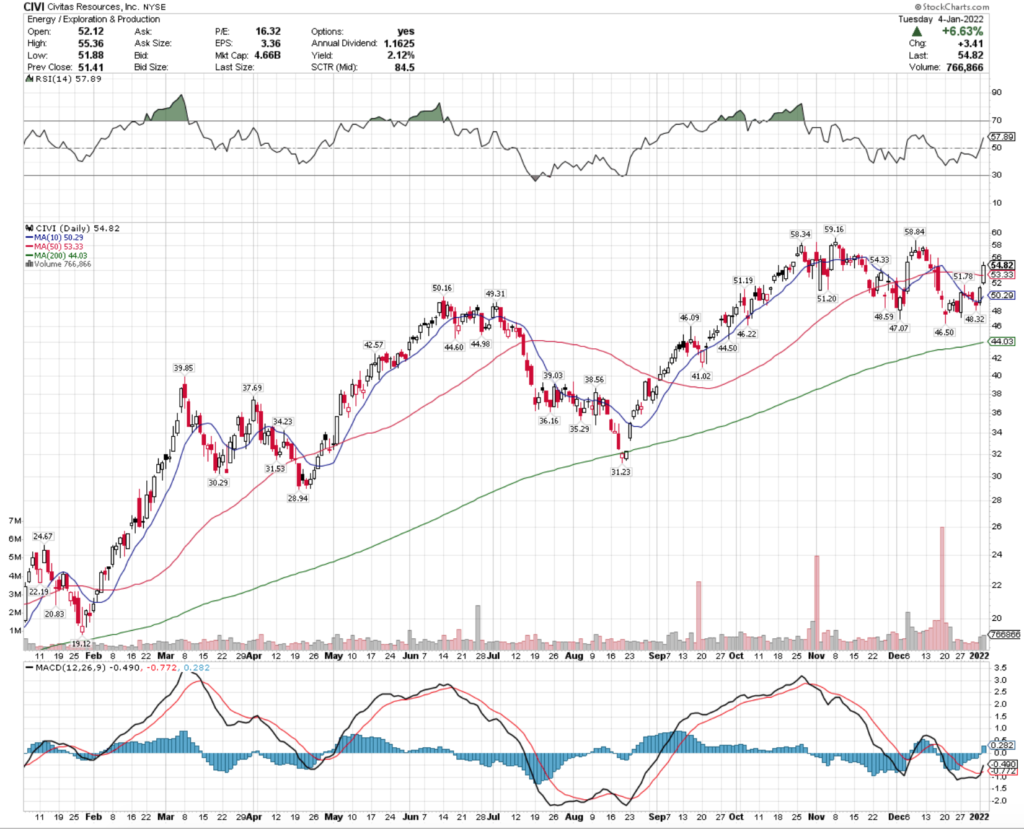
CIVI gapped up 6.63% on 1/4/2021, to $54.82/share.

Civitas Resources, Inc. CIVI Stock’s Technicals Broken Down

Civitas Resources, Inc. CIVI Stock's Technical Performance Over The Last Year

CIVI Stock Price: $54.82

10 Day Moving Average: $50.29

50 Day Moving Average: $53.33

200 Day Moving Average: $44.03

RSI: 57.9

MACD: -0.49

CIVI completed a bullish MACD crossover yesterday, during their 6%+ gap up, while also breaking out above their 50 Day Moving Average.

While their RSI is almost in the 60’s, there looks to be plenty of additional near-term momentum for CIVI stock.

Their volume has been slightly above average recently as well.

Civitas Resources, Inc. CIVI Stock As A Long-Term Investment

Long-term oriented investors may find CIVI’s valuation metrics to be appealing, with a P/E(ttm) of 16.9 & a P/B (mrq) of 3.46.

CIVI stock had Quarterly Revenue Growth Y-o-Y of 222.7%.

Their balance sheet is a bit questionable though, with Total Cash (mrq) of $40.41M & Total Debt (mrq) of $188.4M.

CIVI stock does offer a 1.36% dividend yield, that looks very safe, with a payout ratio of 20.4%.

81.2% of CIVI’s share float is held by institutional investors.

Civitas Resources, Inc. CIVI Stock As A Short-Term Trade Using Options

CIVI stock has options that can be traded in the short-term to take advantage of their recent momentum, while putting aside risks from the broader market.

I am looking at the contracts with the 1/21 expiration date.

The $50 & $55 calls look appealing, although with open interest in the 200’s for each, they are relatively illiquid.

The $55 puts look interesting, although highly illiquid with open interest of 19, and the $60 strike price would also be appealing, but there is no open interest at this time.

Tying It All Together

All-together, CIVI stock has many appealing characteristics that traders & investors should take a closer look at.

Investors will like their valuation metrics & dividend yield, although they may want to take a closer look at their balance sheet.

Traders will like CIVI stock’s current momentum that looks set to continue on into the coming weeks.

Overall, CIVI stock is worth taking a closer look at, regardless of your trading style.

*** I DO NOT OWN SHARES OF CIVI STOCK ***

Wells Fargo & Co. WFC Stock Analysis

Wells Fargo & Co. stock trades under the ticker WFC & has shown recent bullishness that traders & investors should take a closer examination of.

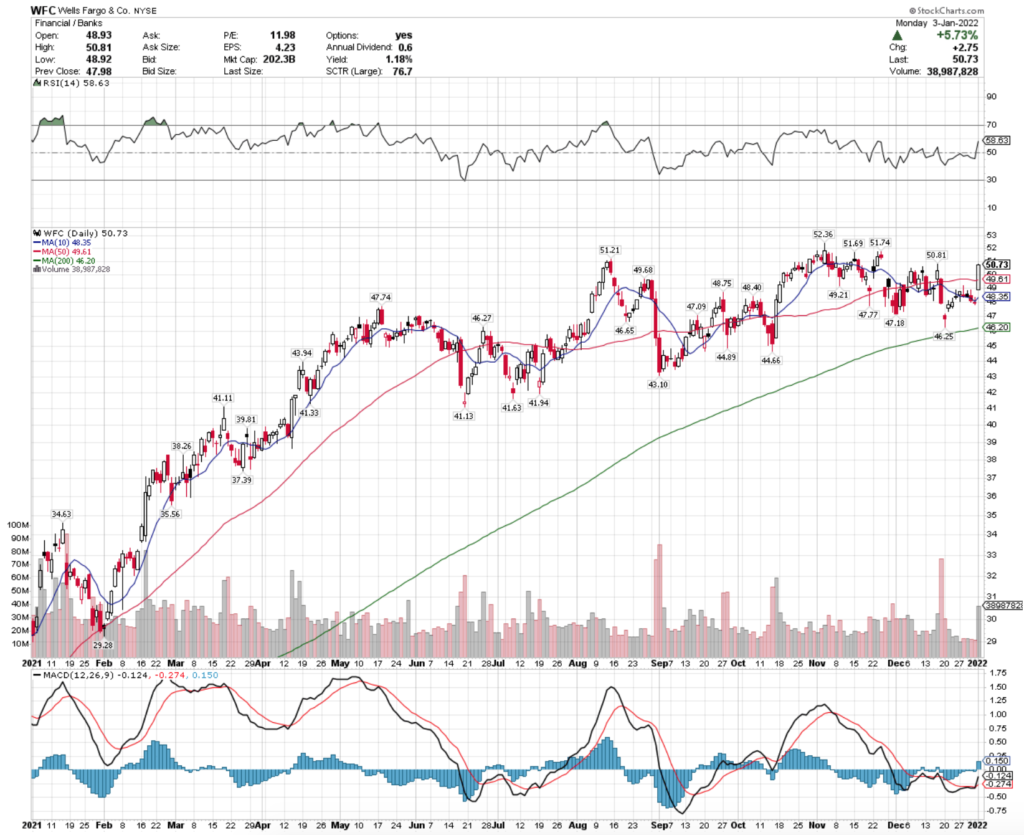
WFC closed at $50.73/share on 1/3/2022, trading on above average volume for the year.

Wells Fargo & Co. WFC Stock’s Technical Broken Down

Wells Fargo & Co. WFC Stock's Technical Performance Over The Last Year

WFC Stock Price: $50.73

10 Day Moving-Average: $48.35

50 Day Moving-Average: $49.61

200 Day Moving-Average: $46.20

RSI: 58.63

MACD: -0.124

WFC stock completed a bullish MACD crossover yesterday, while also gapping up 5%+ & breaking out above its 10 & 50 Day Moving Averages.

Their next resistance level test will be at $50.81 & then at the $51.69 price level.

With an RSI still in the 50’s, there looks to be more gas in the tank to keep pushing WFC higher in the near-term.

Wells Fargo & Co. WFC Stock As A Long-Term Investment

Investors will find WFC stock’s valuation metrics to be appealing, with a P/E(ttm) of 11.92 & a P/B of 1.19.

They experienced 9% Quarterly Revenue Growth Y-o-Y, and also have a strong balance sheet.

WFC stock’s Total Cash (mrq) is $479.7B & their Total Debt (mrq) is $222.6B.

Wells Fargo’s dividend yield is 1.04%, which looks safe, and possible to be increased, as their Payout Ratio is only 11.9%

Due to all of these factors & more, 73.49% of WFC’s total share float is held by institutional investors.

Wells Fargo & Co. WFC Stock As A Short-Term Trade Using Options

Traders can capture WFC’s momentum using options in the near-term.

I am looking at the contracts with the 1/21 expiration date.

The $50, $51 & $52 calls all look appealing & highly liquid, making it easier to find a buyer for your trade.

There is very little open interest on their puts for this expiration date, with only the $52.50 & $53 having anything going on at the moment.

However, given that they have weekly expirations, I expect to see more liquidity flow into the puts in the coming weeks.

Tying It All Together

Investors & traders will both find interesting characteristics for WFC stock to fit their portfolio’s needs.

Investors will like their valuation & balance sheet, as well as their safe dividend yield.

Traders will like their liquid call options in a stock that has a lot of positive momentum behind it in the near-term.

All-in-all, it is worth taking a closer look at Wells Fargo & Co.’s stock.

*** I DO NOT OWN SHARES OF WFC STOCK ***

Clearway Energy, Inc. CWEN Stock

Clearway Energy, Inc. stock trades under the ticker CWEN & has shown recent bullishness that traders & investors should take a closer look at.

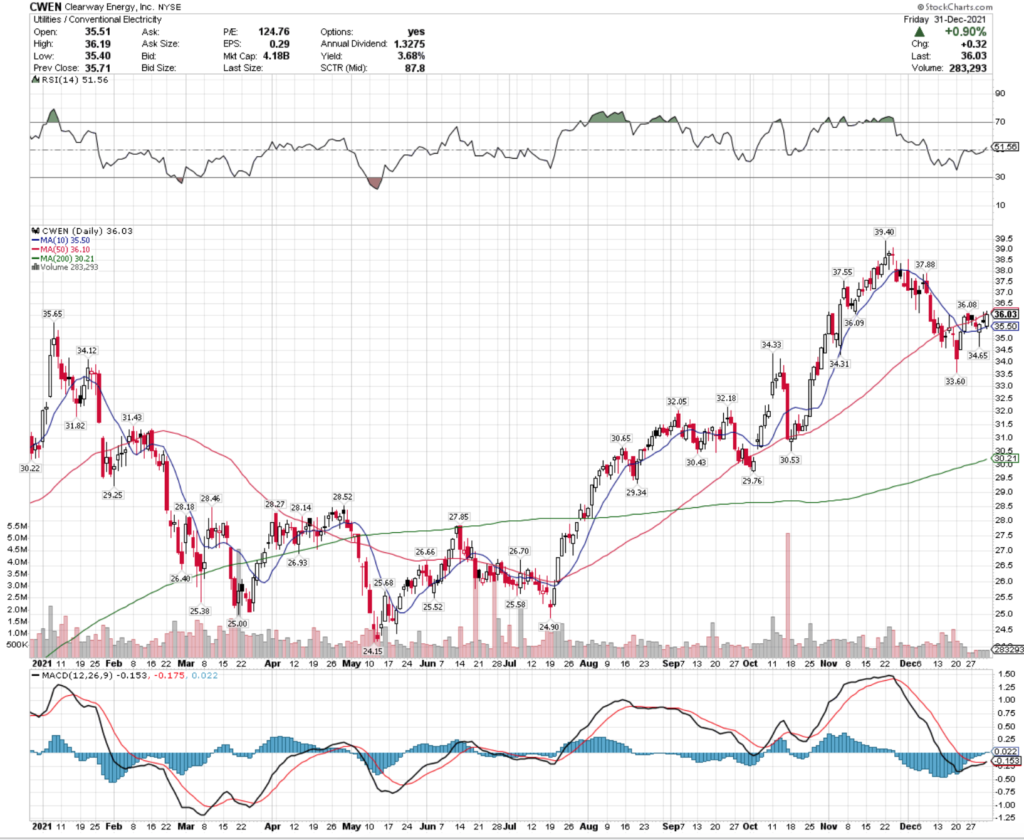
CWEN stock closed at $36.03/share on 12/31/2021.

Clearway Energy, Inc. CWEN Stock’s Technicals Broken Down

Clearway Energy, Inc. CWEN Stock's Technical Performance Over The Last Year

CWEN Stock Price: $36.03

10 Day Moving Average: $35.50

50 Day Moving Average: $36.10

200 Day Moving Average: $30.21

RSI: 51.6

MACD: -0.153

CWEN stock completed a bullish MACD crossover on 12/31/2021, and has a relatively neutral RSI, signaling more gains to come in the short-term.

With their price ~0.1% from crossing above their 50 Day MA, their price looks set to continue climbing, until it tests its next level of resistance at the $37-price level.

Clearway Energy, Inc. CWEN Stock As A Long-Term Investment

Investors may find CWEN stock’s valuation a bit rich, with a P/E(ttm) of 119.3 & a P/B of 2.31.

Their Quarterly Revenue Growth Y-o-Y is 5.7%.

Investors also may want to take a close look on CWEN’s balance sheet, with Total Cash (mrq) of $189M & $8.3B in Total Debt (mrq).

However, CWEN does offer an annual dividend yield of 3.65%, with a Payout Ratio of 441%.

This is very high, and suggests that when paired with the balance sheet figures that their dividend may not be sustainable for too long, as typically a healthy ratio is less than 50%.

Still, ~94% of their share float is held by institutional investors.

Clearway Energy, Inc. CWEN Stock As A Short-Term Trade Using Options

Traders can use options in order to take advantage of CWEN’s current momentum, while staving off broader market fears around COVID & inflation.

I am looking at the 1/21 expiration dated contracts.

The $30 & $35 calls look appealing, although very illiquid.

The $35 & $40 puts also look appealing, with the $35 puts having the most open interest of all of the mentioned contracts.

Tying It All Together

Overall, there are some interesting opportunities for traders & investors in CWEN stock.

They do offer a nice looking dividend yield, however it is unknown how stable it will be over the years with their payout ratio & balance sheet.

In the near-term, their price looks set to continue to rise with their current momentum.

CWEN stock is worth taking a closer look at.

*** I DO NOT OWN SHARES OF CWEN STOCK ***

Calix Networks Inc. CALX Stock

Calix Networks Inc. stock trades under the ticker CALX & has shown recent bullishness that traders & investors should take a closer look at.

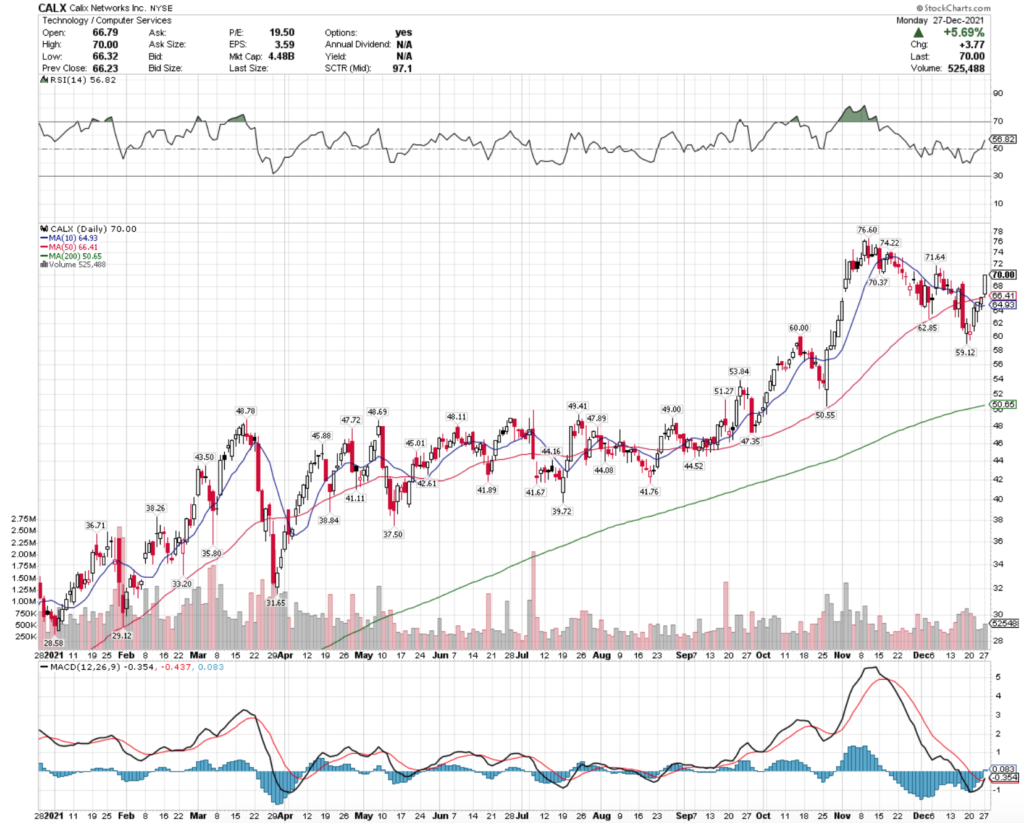
CALX stock closed at $70.00/share on 12/27/2021, with additional near-term momentum signals.

Calix Networks Inc. CALX Stock’s Technicals Broken Down

Calix Networks Inc. CALX Stock's Technical Performance Over The Last Year

CALX Stock Price: $70.00

10 Day Moving Average: $64.93

50 Day Moving Average: $66.41

200 Day Moving Average: $50.65

RSI: 56.8

MACD: -0.354

Yesterday, CALX stock completed a bullish MACD crossover, after experiencing higher than average trading volume over the last 2 weeks.

With their 10 Day Moving Average ~2% below the 50 Day MA, there will be additional positive momentum behind it to drive their share price up higher.

A relatively neutral RSI of <57 also looks to be a positive signal for CALX stock in the near-term.

Their next test of resistance will be the $73/share level.

Calix Networks Inc. CALX Stock As A Long-Term Investment

Investors may find CALX’s valuation metrics appealing, with a P/E(ttm) of 18.8 & a P/B of 8.12 (a bit rich on the P/B, but they are in the Computer Services industry).

CALX stock had 14.4% Quarterly Revenue Growth Y-o-Y.

Their balance sheet looks particularly appealing, with Total Cash (mrq) of $188.7M & Total Debt (mrq) of $14.7M.

This is likely a major reason that 81% of their total share float is held by institutional investors.

Calix Networks Inc. CALX Stock As A Short-Term Trade Using Options

Traders can use CALX options in order to benefit from their positive momentum, while hedging against risks of broader market volatility.

I am looking at the contracts with the 1/21 expiration date.

The $65 & $70 call options look appealing, with the latter having better liquidity than the former.

The $75 & $80 puts look interesting, although very illiquid with open interest of <100 for each.

This reiterates the near-term bullish sentiment.

Tying It All Together

Overall, there looks to be many appealing characteristics to CALX stock.

Investors will be pleased with their balance sheet, despite them not paying a dividend yield.

Traders will like their current momentum & technical set up.

CALX stock is worth taking a closer look at, regardless of your trading style.

*** I DO NOT OWN SHARES OF CALX STOCK ***